Bespoke Market Calendar — March 2026
Please click the image below to view our March 2026 market calendar. This calendar includes the S&P 500’s historical average percentage change and average intraday chart pattern for each trading day during the upcoming month. It also includes market holidays and options expiration dates plus the dates of key economic indicator releases.Click here to view Bespoke’s premium membership options.
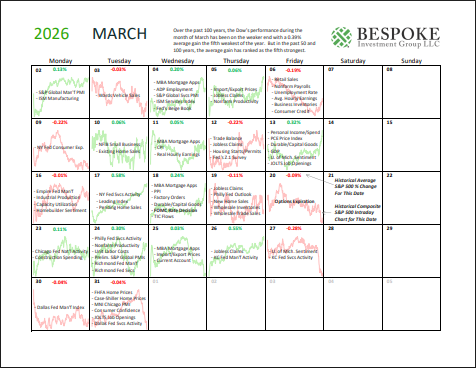
Chart of the Day: March Seasonality
February 2026 Headlines
Bespoke’s Morning Lineup – 3/2/26 – March into War
See what’s driving market performance around the world in today’s Morning Lineup. Bespoke’s Morning Lineup is the best way to start your trading day. Read it now by starting a two-week trial to Bespoke Premium. CLICK HERE to learn more and start your trial.
“If what you have done yesterday still looks big to you, you haven’t done much today.” – Mikhail Gorbachev

Below is a snippet of commentary from today’s Morning Lineup. Start a two-week trial to Bespoke Premium to view the full report.
Markets are poised to open the week sharply lower following the start of the war in the Middle East. Both the S&P 500 and Nasdaq are indicated to open down by over 1%, crude oil is sharply higher, gold is surging, and even Bitcoin is higher.
Overnight in Asia, major averages were all lower except for China, which rallied 0.5%. European markets are also joining in on the weakness, with the STOXX 600 down 1.5% and Spain and Germany both down over 2%.
It’s tempting to look at the initial moves in the opening hours of trading and extrapolate them to a specific endpoint, but we’d stress that we’re still very early in this process. While a short conflict would likely be received positively by the market, the longer it drags on, and the higher energy prices stay, the more of an economic/market impact this will have.
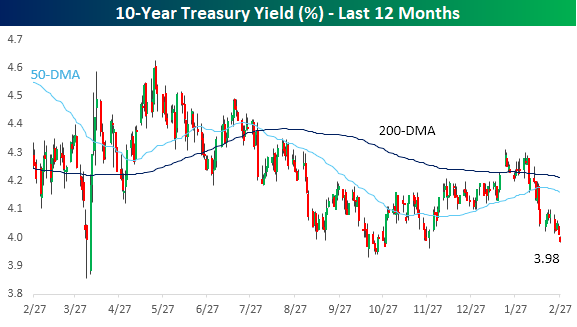
Markets are mostly reacting just as you’d expect given the news of the weekend. Crude oil is sharply higher, stocks are down, and the dollar is up. The only asset class not following the playbook is the 10-year yield. US Treasuries are actually selling off modestly this morning, with the yield on the 10-year up about 3 bps to 3.98%. Higher yields will inevitably raise questions over the sell America trade, but two points are worth highlighting. First, on Friday, yields closed right near 52-week lows even as PPI came in higher than expected, so there was certainly some front-running of the attack on Iran heading into the weekend. Secondly, it’s not just US yields that are higher. Sovereign yields are also higher by similar amounts in Europe as well, so the move is more a reflection of concerns over inflationary impacts of the war.
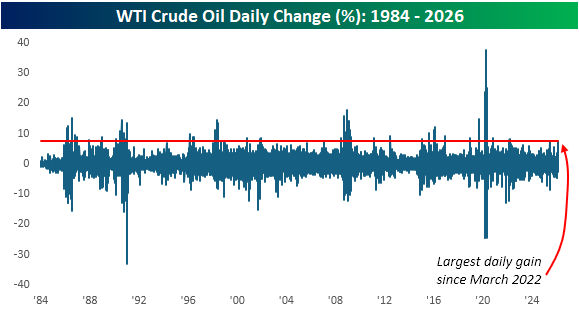
Crude oil has followed the playbook just as you would expect, though. If the pre-market gains hold through the end of the session, it will be the largest one-day rally in WTI crude oil since the early days of the Russia-Ukraine war in March 2022. While crude oil is off the highs from overnight, at over $72 per barrel, it’s right near its highest levels of the last year.
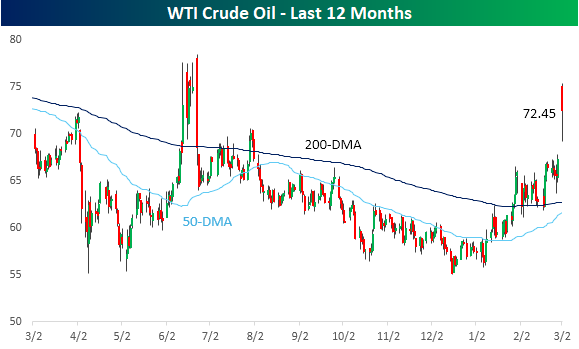
It’s been a large move, but today’s gain would only rank as the 80th largest one-day gain in crude oil since 1984. Given the enormity of the military action, an even larger move in crude oil wouldn’t have been a surprise.
US vs. Rest of World
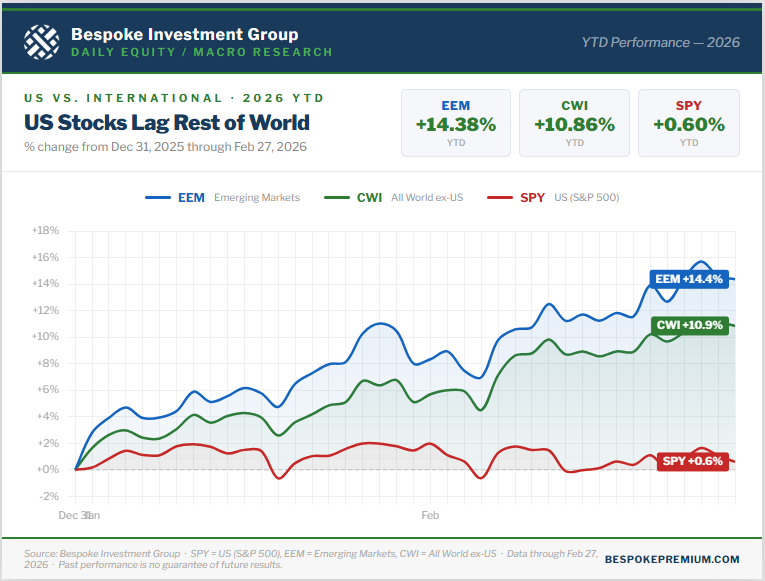
Through the first two months of 2026, the rest of the world has crushed the US when it comes to stock market performance. Using ETFs as a proxy, the US (SPY) is up just 0.6% YTD, while the MSCI All World ex US ETF (CWI) is up 10.86%. In addition to CWI beating SPY by more than ten percentage points through February, the emerging markets ETF (EEM) is up even more with a YTD gain of 14.38%.
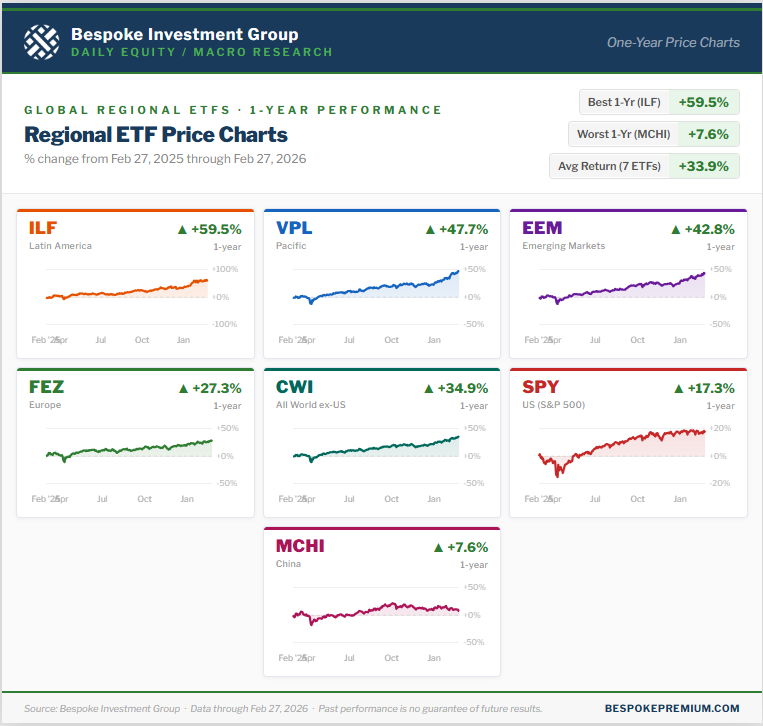
The rest of the world has outperformed the US over the last year as well. Below is a look at one-year performance for seven ETFs: the US (SPY), the rest of the world (CWI), emerging markets (EEM), Latin America (ILF), the Pacific (VPL), Europe (FEZ), and China (MCHI).
Of these seven, Latin America (ILF) leads the pack with a one-year gain of 59.5%. The Pacific (VPL) is up the second-most at +47.7%, followed by emerging markets (EEM) at +42.8%.
Europe (FEZ) is beating the US by exactly ten percentage points with a gain of 27.3% versus 17.3% for SPY. The only ETF of the group that has done worse than the US over the last year is the MSCI China ETF (MCHI).
Like this research? Join our premium members by starting a trial today! Click below for details on how to sign up:

A Mag-7-less Start to the Year
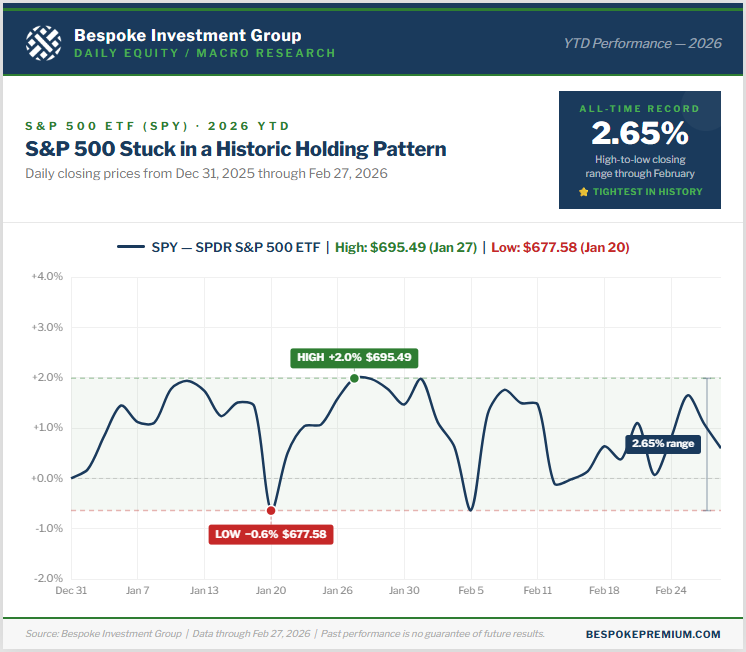
Given the massive geo-political events that have taken place this weekend with Operation Epic Fury taking out Iran’s Supreme Leader Khamenei, no one knows what will happen once the dust settles from tomorrow’s trading action. We do know, however, that 2026 has so far seen the tightest range on record for the S&P 500 through the first two months of the year.
Just 2.65% separates the S&P 500 ETF’s (SPY) highest and lowest close so far this year. That’s its tightest year-to-date high/low spread ever through February, and the same record holds for the actual S&P 500 index throughout its history.
Needless to say, the “market” as measured by the large-cap S&P 500 is a coiled spring heading into March.
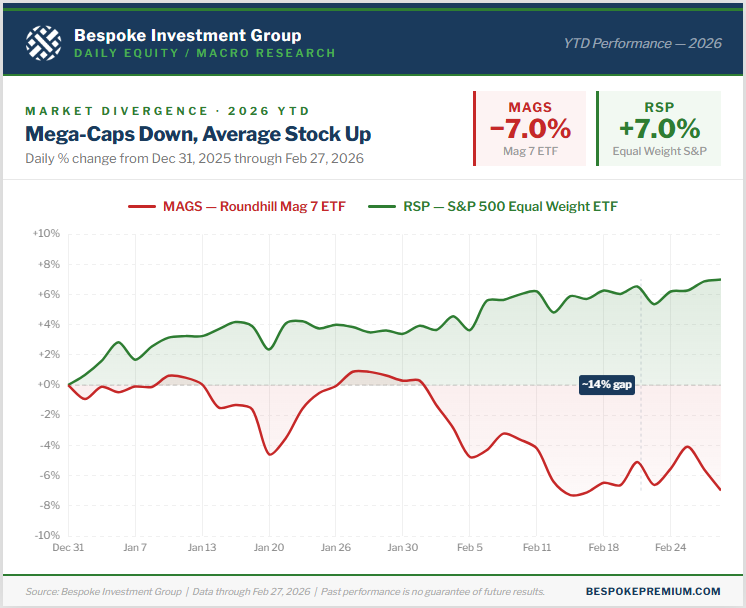
While the cap-weighted S&P 500 has been flat as a pancake this year, the average stock in the index is actually up 7%.
This means the largest stocks in the index, the mega-caps, have underperformed. The Roundhill Mag 7 ETF (MAGS) is made up of Alphabet (GOOGL), Amazon (AMZN), Apple (AAPL), Meta (META), Microsoft (MSFT), NVIDIA (NVDA), and Tesla (TSLA).
So far this year, MAGS is down 7%.
Below is a look at the huge 14-percentage point YTD performance gap between the S&P 500 Equal Weight ETF (RSP) and the Mag 7 ETF (MAGS):
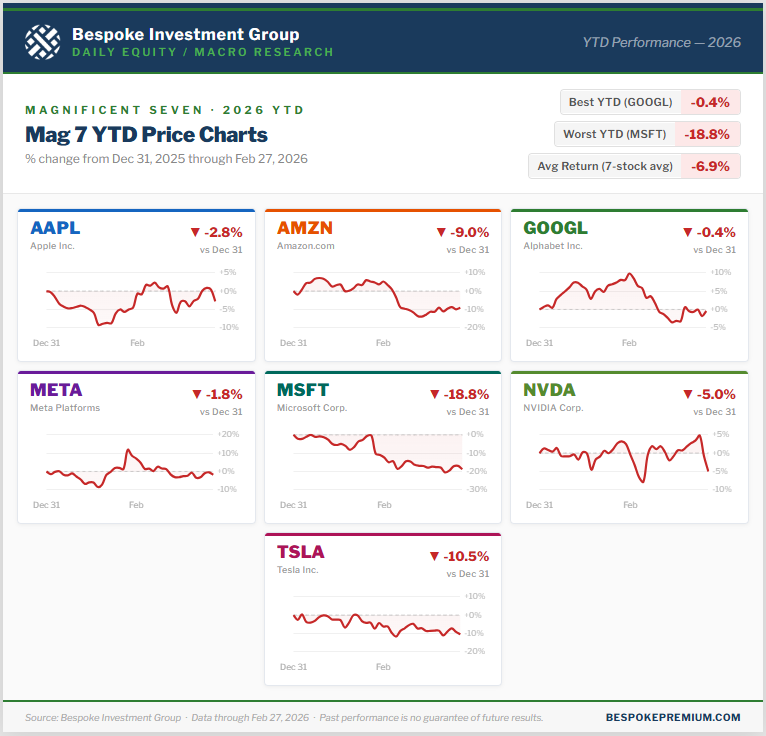
As we get set for March, not one of the Mag 7 stocks is up on the year. As shown below, Alphabet (GOOGL) has been the best performer of the group this year with a small decline of 0.4%. On the flip side, Microsoft (MSFT) is down the most with a decline of 18.8%.
With such big concentration at the top of the S&P 500, investors have been worried that weakness in the mega-cap cohort would inevitably take down the rest of the market. During the recent Mag 7 sell-off, the rest of the market has stepped up enough to essentially keep the major cap-weighted indices flat.
Like this research? Join our premium members by starting a trial today! Click below for details on how to sign up:
Brunch Reads – 3/1/26
Welcome to Bespoke Brunch Reads — a linkfest of some of our favorite articles over the past week. The links are mostly market-related, but there are some other interesting subjects covered as well. We hope you enjoy the food for thought as a supplement to the research we provide you during the week.
Massachusetts March Madness: On March 1, 1692, three women, Tituba, Sarah Good, and Sarah Osborne, were brought before local magistrates in Salem Village (now Danvers) for public examination inside the village meeting house. The questioning was led by John Hathorne and Jonathan Corwin, both prominent figures in the community. This was the beginning of the Salem Witch Hunt.
That January, the daughter and niece of the local minister, Reverend Samuel Parris, began exhibiting strange behaviors, like convulsions, fits, screaming, and trancelike states. Doctors could not explain it. The suspicions in the deeply religious community quickly turned to witchcraft. Tituba was an enslaved woman in the Parris household, while Sarah Good was a homeless beggar, and Sarah Osborne was an elderly woman. Good and Osborne denied the charges, but Tituba did not, perhaps under intense pressure to confess. She described encounters with the Devil and claimed other witches were at work in the colony. Her confession electrified the community, and the crisis escalated exponentially.
In May 1692, the governor of the Province of Massachusetts Bay established a special court to hear the cases. Over the next several months, more than 200 people were accused. Nineteen were hanged. One man was pressed to death under heavy stones. By October 1692, the hysteria began to collapse under growing skepticism. The special court was dissolved, and the remaining accused were gradually released. In the years that followed, public apologies were issued, and convictions were overturned. But, in the beginning, the first accusations in the Massachusetts village set off one of the most infamous episodes of mass hysteria in American history.

AI & Technology
AIs can’t stop recommending nuclear strikes in war game simulations (New Scientist)
When researchers pitted leading AI models against each other in simulated geopolitical crises, at least one side deployed a tactical nuclear weapon in 95% of the games, and no model ever chose to surrender, no matter how badly it was losing. Nobody’s handing AI the launch codes anytime soon, hopefully, but the results are worth paying attention to as militaries around the world increasingly use AI in war gaming and decision support. [Link]
Continue reading our weekly Brunch Reads linkfest by logging in if you’re already a member or signing up for a trial to one of our two membership levels shown below! You can cancel at any time.

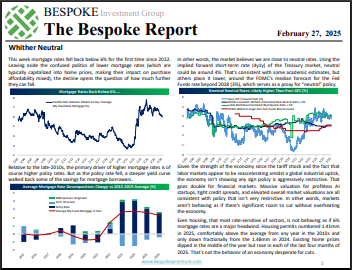
The Bespoke Report – 2/27/26 – Whither Neutral?
To read our weekly Bespoke Report newsletter and access everything else Bespoke’s research platform offers, start a two-week trial to Bespoke Premium. The AI trade continues to dominate conversation, whether it’s private market valuations, policy, investment, or the hits that incumbent companies are taking at the hands of the new technology. Foreign markets continue to crush the US equity market’s performance while uptrends have held for precious metals even as crypto prices remain weak. Earnings season is mostly wound down now, but there were still some fascinating results to skim through this week. We also take some time to ask the question: where is neutral?

Daily Sector Snapshot — 2/27/26
Perfect 10?
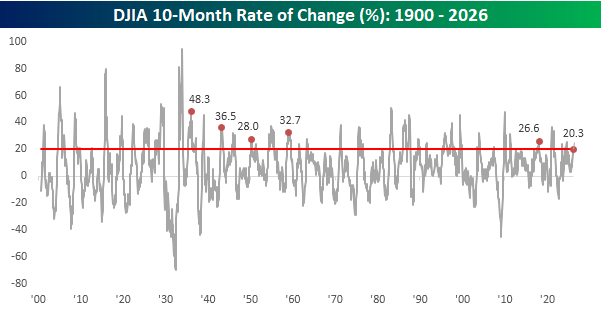
There’s still time in the trading day, but the Dow Jones Industrial Average (DJIA) is barely hanging on to a gain for the month (+0.05%). If it can hold on to these levels, it would extend the current monthly winning streak to ten, tying the streak that ended in January 2018 for the longest since February 1959 (12 months). As shown in the chart below, if the gains for February hold, it would be just the sixth double-digit monthly winning streak in the Dow’s history.
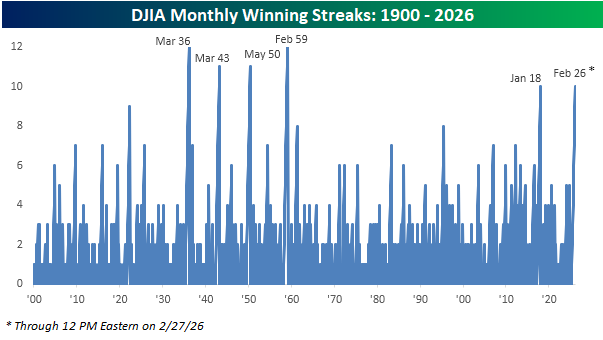
With the Dow up for ten straight months, it’s natural to wonder whether the index is stretched by historical standards. With a gain of just over 20% in the last ten months, its performance ranks in the 81st percentile relative to all other 10-month periods in its history, so the returns have been significantly better than average. However, looking at the chart of the index’s rolling 10-month performance over time shows that relative to prior streaks, the Dow’s gains during this run were actually the lowest of any comparable winning streak in its history. So, yes, the Dow’s performance over the last ten months has been much better than average, but far from extreme.