Q1 2025 Earnings Conference Call Recaps: Tesla (TSLA)
Bespoke’s Conference Call Recaps use AI to summarize lengthy earnings calls. The commentary below is AI-generated and then edited by Bespoke for quality control. As always, none of these summaries should be construed as recommendations to buy or sell any securities, and investors should do their own research and/or consult with a financial professional before making any investment decisions.
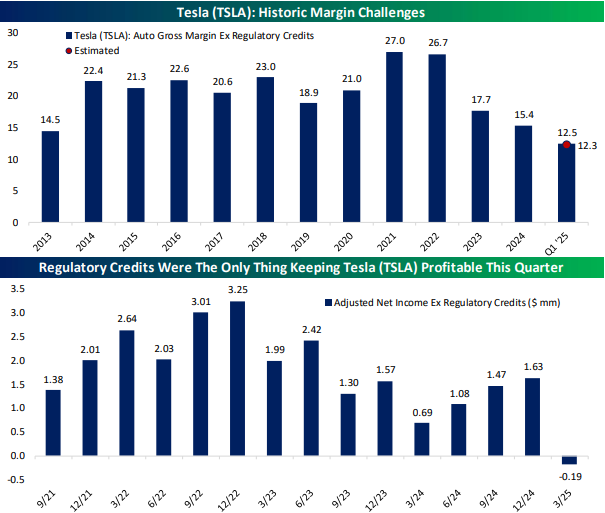
Our latest recap available to Bespoke subscribers covers Tesla’s (TSLA) Q1 2025 earnings call.
![]()
Tesla (TSLA) is a leader in electric vehicles, battery energy storage, and AI-powered automation. It designs and manufactures EVs such as the Model Y, Model 3, Cybertruck, and Semi, alongside battery products like the Megapack and Powerwall. TSLA is also pioneering full self-driving (FSD) software, humanoid robots (Optimus), and advanced factory automation through its “unboxed” manufacturing approach. With deep vertical integration, from lithium refining to AI chip design, TSLA serves a broad range of customers. TSLA used Q1 to refresh the Model Y simultaneously across all global factories and sold out remaining legacy models in major markets. Autonomy dominated the call, with Elon Musk reaffirming a June pilot for paid Robotaxi rides in Austin and forecasting millions of autonomous cars by late 2025. Tariffs remain a headwind, particularly in energy, but TSLA’s regionalized supply chain (~85% USMCA-compliant) and in-house battery production help mitigate risk. Energy storage hit record gross profit despite seasonal demand softness. Musk confirmed thousands of Optimus bots will be deployed by year-end, and the revolutionary “unboxed” Cybercab production process remains on track. While the call was more upbeat, the results were not so hot. Revenue fell 9% and net income plunged 71%. Vehicle deliveries dropped 13% to 336,681 units, marking the worst quarter since 2022. Factors included Model Y production line changeovers, price cuts, and backlash over Elon Musk’s political involvement. Musk announced a reduction in his government role to refocus on Tesla, which was one catalyst for the stock’s 7% move higher on 4/23…
Continue reading our Conference Call Recap for TSLA by becoming a Bespoke Institutional subscriber. You can sign up for Bespoke Institutional now and receive a 14-day trial to read our newest Conference Call Recap. To sign up, choose either the monthly or annual checkout link below:
B.I.G. Tips – Everything Rises Together
Chart of the Day – Whiplash!
Bespoke’s Morning Lineup – 4/23/25 – Beauty is in the Eye of the Beholder
See what’s driving market performance around the world in today’s Morning Lineup. Bespoke’s Morning Lineup is the best way to start your trading day. Read it now by starting a two-week trial to Bespoke Premium. CLICK HERE to learn more and start your trial.
“There is nothing either good or bad, but thinking makes it so.” – William Shakespeare, Hamlet

Below is a snippet of commentary from today’s Morning Lineup. Start a two-week trial to Bespoke Premium to view the full report.
It’s been quite a week for equity markets, and Wednesday hasn’t even started yet! After a 2%+ decline on Monday, the S&P 500 rebounded more than 2% yesterday, and after some less confrontational comments from President Trump after the close yesterday related to Powell and China, futures are up another 2%+ in the pre-market! Even US treasuries are rallying. And gold is down!
One comment from the President that encouraged markets was when he said that the 145% tariff on Chinese imports were “very high, and it won’t be that high. … No, it won’t be anywhere near that high. It’ll come down substantially. But it won’t be zero.” That’s encouraging, although at 145%, there a lot of room for tariff rates to come down significantly and still be incredibly high! 70% is less than half of 145%, but that would still be a crushing rate. Remember, back on April 2nd, the President thought he was going easy on countries with the rate of reciprocal tariffs. We’ll see how this all plays out, but until the next headline comes out that contradicts yesterday’s, markets can rally.
The pace of earnings news has really started to pick up in the last couple of days and will only get busier in the days ahead. On the economic calendar this morning, we’ll get flash PMI readings for the Manufacturing and Services sector at 9:45, which will likely show weakness, and then New Home Sales at 10 AM.
When the market is stuck in a downtrend, one key trend to watch for signs of a reversal is when stocks stop going down on bad news. When that happens, it’s usually taken as a sign that all the bad news is finally ‘priced in’ to the market. So, while an economic or earnings report may be ‘bad news’ in terms of coming in weaker than expected, if the broader market or an individual stock rallies on it, it can actually be considered good news.
Yesterday, the market got some bad news from the IMF regarding global growth forecasts, but considering the 4%+ gain in the S&P 500 since then (including today’s move in the futures), it must have been good news, right? Obviously, there were other factors behind the rally, but it does illustrate that this ‘news’ from the IMF was already well known by the market.
For the world in general, the IMF cut its overall estimated rate of global growth down by half a percentage point. For advanced economies, the growth rate was lowered for every country and region except Spain (+0.2 ppts). The US saw the sharpest downgrade to growth forecasts (-0.9 ppts), second only to Mexico’s drop of 1.7 ppts. In emerging and developing economies, growth forecasts saw nearly across-the-board cuts. The only country where the IMF upgraded global growth forecasts was Russia. Russia!

With the new GDP growth forecasts from the IMF, global growth in 2025 is expected to be slower in most economies. Again, the US is expected to see the sharpest deceleration relative to 2024, with growth declining by a full percentage point while Japan (+0.5 ppts) and Germany (+0.2 ppts) are the only two advanced economies expected to see growth accelerate in 2025 relative to 2024. In EM and developing economies, Russia is expected to see the sharpest slowdown (-2.9 ppts), but Mexico, Brazil, Europe, and China are all expected to see sharp slowdowns in GDP growth. The only economies in this group expected to see growth acceleration are Saudi Arabia, Middle East & Central Asia, and South Africa.

As the charts above illustrate, the US has seen among the sharpest downgrades to GDP growth estimates, but among developed economies, it is still expected to show relatively strong growth (+1.8%), second only to Spain’s expected growth rate of 2.5%. So, while the IMF may be cutting the rate of US growth by more than other advanced economies, its economy is still expected to see much stronger growth than other developed economies. In EM and developing economies, however, most countries are expected to see much stronger growth, as Mexico is the only economy expected to contract. As a result of the stronger growth in emerging and developing economies, overall global growth is expected to come in at 2.8% for 2025.

The Closer – Tesla Earnings, 5 Fed, Dollar Reserve – 4/22/25
Log-in here if you’re a member with access to the Closer.
Looking for deeper insight into markets? In tonight’s Closer sent to Bespoke Institutional clients, we kick off with an earnings rundown including results from Tesla (TSLA) (page 1). We then update our 5 Fed Manufacturing Composite (page 2) in addition to a closer look at the Philly Fed’s Services component (page 3) and the service readings for Richmond too (page 4). Next, we discuss the theme of the dollar’s reserve currency status (page 5) before closing out with an update on Bitcoin (pages 6 and 7).
See today’s full post-market Closer and everything else Bespoke publishes by starting a 14-day trial to Bespoke Institutional today!
Daily Sector Snapshot — 4/22/25
Records in Richmond
US economic data was again light this morning with the only releases of note being regional Fed activity indices: a services index out of the Philly Fed and the manufacturing and services indices out of Richmond. As we noted through our Five Fed Composite last week, regional Fed releases have shown a significant deceleration in activity, and today’s release out of Richmond reaffirmed that. For the headline manufacturing number, there was a decline from -4 in March down to -13 this month. That indicates moderate contraction in activity, albeit similar and lower readings were observed from July to November last year.

Although the composite has seen lower readings relatively recently, April’s reading is still a bottom decile print for the history of the data going back to the 1990s. Breadth this month was also horrible with only six categories rising (not all of which are positives like inventories and prices) versus 10 categories falling month over month. In addition to weakness in current condition categories, expectation indices were especially weak. Across expectation indices, there were multiple record lows or near record lows. Those same sorts of records could also be observed for month over month changes. For example, expectations for number of employees had never fallen by more in a single month.

Perhaps one of the more concerning readings is in regards to demand adjacent categories. New Orders fell 11 points month over month down to -15 (an 11th percentile reading) while shipments also fell double digits to a 5th percentile reading. The expectations counterparts of those categories were even worse as both registered record lows. In other words, at no point of COVID, the Financial Crisis, or the 2001 recession were the region’s firms this pessimistic regarding future demand.

Paired with the weakness in demand expectations was a concerning pickup in inflation which has also been seen across a range of other indicators. Current conditions of prices paid have already picked up materially, rising to a 5.37% annualized rate. While that series did see readings that were roughly three times higher at the post-pandemic peaks in inflation a few years ago, expectations at 8.38% are sitting at a new record. Prices received have also been on the rise but are currently much lower. Current conditions are only at a 2.65% rate whereas expectations are surging to 5.6%, the most elevated reading since March and April 2022.

In addition to the record lows in demand expectations, expenditures have also taken a big hit. The Richmond report includes expenditure readings for three separate categories: Equipment & software, capex, and business services. Each of those three have been in decline since interest rates began ticking higher in early 2022, and since tariff news came to the forefront this year, they have taken a sharp leg lower (reversing post-election gains) and now have only been lower during the depths of COVID.

Click here to find out how to receive Bespoke’s premium stock market research.
Chart of the Day – Sectors and Stocks vs Early April Lows
Bespoke’s Morning Lineup – 4/22/25 – One Step Forward, Three Steps Back
See what’s driving market performance around the world in today’s Morning Lineup. Bespoke’s Morning Lineup is the best way to start your trading day. Read it now by starting a two-week trial to Bespoke Premium. CLICK HERE to learn more and start your trial.
“I don’t wanna be a product of my environment; I want my environment to be a product of me.” – Jack Nicholson
Below is a snippet of commentary from today’s Morning Lineup. Start a two-week trial to Bespoke Premium to view the full report.
After plunging to start the week yesterday, US futures are attempting to continue the late-day rebound that began in yesterday’s last hour of trading. With an indicated gain of about 0.8%, though, that would only be enough to erase a third of yesterday’s losses. With one step forward for every three steps back, it’s not an environment that leads to meaningful gains. European equities are all lower this morning after being closed for Easter yesterday, and with the STOXX 600 down only 0.70%, it’s down less since last Thursday’s close than the S&P 500.
Outside of equities, US Treasury yields are modestly lower, erasing earlier increases. Crude oil is up close to 2% and over $64 per barrel, while Bitcoin is up 1.5% and back near $89,000. Finally, the unstoppable freight train of gold is up another 1% to another record high – its 16th in the last 30 trading days!
The rise in gold prices has been nothing short of amazing, with the safe-haven asset seemingly hitting record high after record high, and today’s 1.15% advance marking yet another one. Yesterday’s 3%+ rally was the fifth time in the last ten trading days that gold rallied at least 2% in a single day. In the last 50 years, the only periods that experienced a higher frequency of 2%+ daily moves were in January and June of 1980. Since then, there have only been a handful of periods where gold experienced as many 2% daily moves in a ten-trading-day span, with the most recent occurring more than 15 years ago in September 2008. Also, keep in mind that the most recent five daily 2%+ gains occurred over an eight-trading-day span, so there are still two more trading days to increase that total!

With the high frequency of big daily gains, gold now trades more than 27% above its 200-day moving average. That’s the most extended traded relative to its 200-DMA since 2011. Like the high frequency of 2% daily moves in the 10-trading day period, there have only been a handful of other periods when gold traded more than 25% above its 200-DMA, and the most extended it ever got was an astonishing 130%+ in early 1980. To trade at similarly extreme levels now, gold would trade above $6,200 per ounce.

The Closer – 60/40 Smashed, Gold, Admin Bad Starts – 4/21/25
Log-in here if you’re a member with access to the Closer.
Looking for deeper insight into markets? In tonight’s Closer sent to Bespoke Institutional clients, we lead off with an overview of the brutal performance of 60/40 portfolios (page 1) followed by some commentary regarding the pros and cons of gold (page 2). We then take a look at how it’s been the worst start to a Presidential administration on record with regards to stock performance (page 3) and also show the performance so far of a number of other assets (pages 4-6). We close out with an update on positioning data (pages 6 and 7).

See today’s full post-market Closer and everything else Bespoke publishes by starting a 14-day trial to Bespoke Institutional today!