Daily Sector Snapshot — 5/5/25
Chart of the Day: Nearly 30 Years of Country ETFs
Bespoke’s Morning Lineup – 5/5/25
See what’s driving market performance around the world in today’s Morning Lineup. Bespoke’s Morning Lineup is the best way to start your trading day. Read it now by starting a two-week trial to Bespoke Premium. CLICK HERE to learn more and start your trial.
“This period has been… It’s really nothing. This is not a very dramatic bear market or anything of the sort.” – Warren Buffett (on recent market weakness)

Below is a snippet of commentary from today’s Morning Lineup. Start a two-week trial to Bespoke Premium to view the full report.
The S&P 500 has quickly clawed its way back from post-Liberation Day losses, closing on Friday above pre-Trump Rose Garden levels.

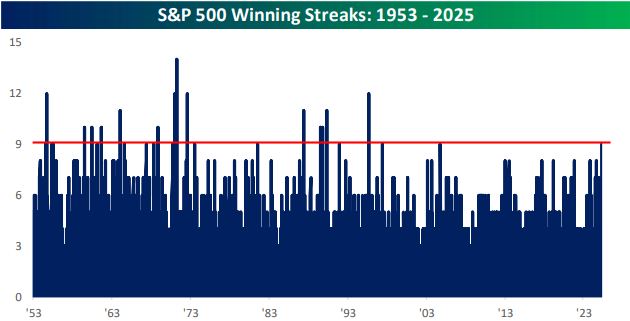
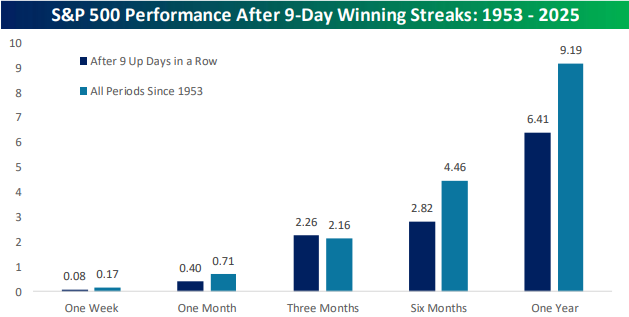
The S&P enters the week on a nine-trading day win streak, which it hasn’t done in more than 20 years! As shown in the second chart below, forward returns following prior nine-day win streaks have been weaker than average over the next week and month as well as longer-term over the next six and twelve months.
Brunch Reads – 5/3/25
Welcome to Bespoke Brunch Reads — a linkfest of some of our favorite articles over the past week. The links are mostly market-related, but there are some other interesting subjects covered as well. We hope you enjoy the food for thought as a supplement to the research we provide you during the week.
Where the Poppies Blow: In Flanders Fields is one of the most iconic war poems ever written, capturing both the sorrow and the resolve born from the battlefield. Penned by Lieutenant Colonel John McCrae on May 3, 1915, the poem reflects the haunting beauty of red poppies growing among soldiers’ graves in Flanders, a region ravaged by World War I. McCrae, a Canadian physician and soldier, was inspired to write the poem shortly after presiding over the funeral of a fellow soldier and friend who died in the Second Battle of Ypres.
The poem begins with the image of poppies swaying between the graves, moves into a remembrance of the fallen who “lived, felt dawn, saw sunset glow,” and ends with a direct plea to the living: “Take up our quarrel with the foe.” That final call to action transformed the poppy into a lasting symbol of remembrance and helped fuel a sense of duty and sacrifice during the war.

Travel & Transportation
Virginia will use technology to slow chronic speeders’ cars—and other states are rushing to join in (Fast Company)
As the federal government retreats from traffic safety enforcement, a surprising number of state legislatures are pushing forward with bills requiring Intelligent Speed Assist (ISA) for the most extreme speeders, drivers clocked at 100+ mph. These systems can either warn drivers or physically prevent further acceleration, and the proposals are tailored to target high-risk individuals. With bipartisan traction from DC to Georgia, advocates see this as a rare moment of political alignment that could reshape how the most dangerous drivers are held in check. [Link]
Continue reading our weekly Brunch Reads linkfest by logging in if you’re already a member or signing up for a trial to one of our two membership levels shown below! You can cancel at any time.

Daily Sector Snapshot — 5/2/25
The Bespoke Report – 5/2/25 – Did We Miss Anything?
To read our weekly Bespoke Report newsletter and access everything else Bespoke’s research platform offers, start a two-week trial to Bespoke Premium. In this week’s report, we break down the market’s action this week and what it might portend for the future. Give it a read!


April 2025 Headlines
Getting Back to Even
It’s been exactly a month since “Liberation Day” on April 2nd when President Trump announced massive reciprocal tariffs on the rest of the world. At its intraday low on April 8th, the S&P 500 ETF (SPY) was down 14.7% from its closing level on April 2nd. Since that low, SPY has now rallied 17.4%, and as of this morning, SPY has fully recovered all of its post-Liberation Day declines.

Below is a look at the performance of key index and sector ETFs since the close on Liberation Day (4/2). Technology (XLK) is now the best performing sector since 4/2 with a gain of 2.9%, followed by the Nasdaq 100 (QQQ), Semis (SMH), and Industrials (XLI). On the downside, the Energy sector (XLE) has been by far the biggest laggard with a decline of 12.7%.

We’d note that even though the stock market has fully recovered its post-Liberation Day drop, investor sentiment remains extremely bearish. This week marked a record 10th consecutive week where AAII Bearish Sentiment was above 50%. The prior record was seven straight weeks back in 1990. Will the bulls finally re-emerge next week? We won’t find out until next Thursday when the weekly AAII numbers get posted.


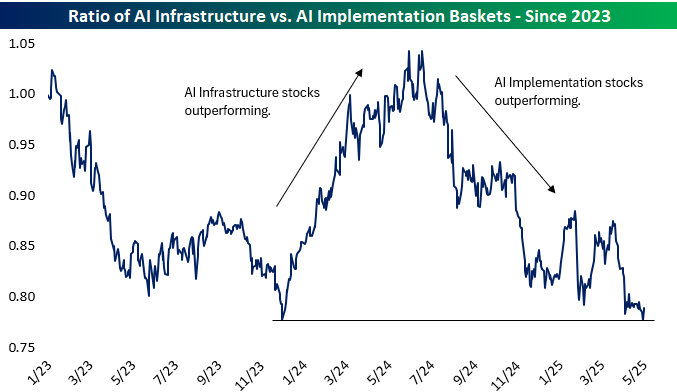
Back in early 2023, we created the Bespoke AI Basket to track key stocks in the space. We broke the basket into two sub-groups: one for AI Infrastructure stocks and one for AI Implementation stocks. The AI Infrastructure basket contains stocks that power the AI Boom like NVIDIA (NVDA), while the AI Implementation basket contains stocks like Meta (META) that are implementing AI to boost the user experience and increase margins and productivity.
As shown below, the AI Implementation basket has outperformed the AI Infrastructure basket since the end of 2022 by quite a wide margin.

There have been periods of significant out- and underperformance for each basket, however. Below is a look at the ratio between the AI Infrastructure and AI Implementation baskets. When the line is rising, AI Infrastructure is outperforming, and vice versa.
The first half of 2024 saw AI Infrastructure outperform quite dramatically, but since mid-2024 for about the last year now, AI Implementation stocks have been outperforming. Are we now due for a reversal that sees AI Infrastructure start to bounce again?
Each night in our post-market macro note, The Closer, we provide a snapshot of recent performance for our AI Baskets along with a couple of pages that showcase all of the individual stocks that make up the baskets. It’s a helpful way to stay on top of the AI Boom and find new ideas (if you’re looking).
If you’re not yet a Bespoke subscriber, you can start a trial to Bespoke Institutional and gain access to our nightly Closer by clicking here.


Click below to watch a video from our “Get Invested” series that covers some of the benefits of long-term investing in the stock market. To become a Bespoke client, start a trial to one of our membership options or visit our Wealth Management page for more info on how we may be of help.

Bespoke’s Morning Lineup – 5/2/25 – Nine Straight?
See what’s driving market performance around the world in today’s Morning Lineup. Bespoke’s Morning Lineup is the best way to start your trading day. Read it now by starting a two-week trial to Bespoke Premium. CLICK HERE to learn more and start your trial.
“The jungle is dark but full of diamonds” – Arthur Miller, Death of a Salesman
Below is a snippet of commentary from today’s Morning Lineup. Start a two-week trial to Bespoke Premium to view the full report.
Futures are pointing to another positive session this morning, even as the market has received earnings reports from Amazon.com (AMZN) and Apple (AAPL) tepidly. Overnight in Asia, major averages finished the week on a higher note as Japan and Hong Kong traded up more than 1% while China was closed. Even though its markets were closed, Chinese officials said they are assessing whether to conduct trade negotiations with the US after they say the Trump administration has reportedly reached out multiple times to start talks.
After yesterday’s holiday, European stocks picked up right where Asia left off as the STOXX 600 rallies more than 1%, putting it on pace for a weekly gain of 2.5%. The region’s Manufacturing PMI for April came in higher than expected at 49.0 versus forecasts for a reading of 48.0. It’s still in contraction territory, but a better-than-expected report is a better-than-expected report. On the trade front, the EU commissioner of trade commented that the bloc could buy more US goods to narrow the trade deficit between the two regions.
Here in the US, while futures are higher, where we close will depend on the April Employment report. After a weaker-than-expected ADP report and an uptick in jobless claims yesterday, there are some heightened concerns of a weaker report. The actual print came in better than expected, though. Non-Farm Payrolls were stronger than expected (177K vs 133K) while the Unemployment Rate was right inline with expectations at 4.2%. Average hourly earnings rose slightly less than expected (0.2% vs 0.3%), but average weekly hours came in slightly higher than expected (34.3 vs 34.2). In response to the report, both treasury yields and equity futures have moved higher.
The equity market’s historical comeback continued yesterday as the S&P 500’s 0.63% rally propelled it back above its 50-day moving average (DMA) for the first time in over two months and a streak of eight gains in a row. While the index’s short-term downtrend has been broken, it still faces upside resistance at the 200-DMA and the mid-March high when it last failed to rally back above that long-term moving average.

The Closer – More Megas, Claims, AI – 5/1/25
Log-in here if you’re a member with access to the Closer.
Looking for deeper insight into markets? In tonight’s Closer sent to Bespoke Institutional clients, after beginning with a review of the latest earnings including the next mega-cap results (page 1) we dive into the latest claims and construction spending data (page 2). We also check in on the ISM reading (page 3) and finish with a dive into AI stock performance (page 4).
See today’s full post-market Closer and everything else Bespoke publishes by starting a 14-day trial to Bespoke Institutional today!