Bespoke’s Morning Lineup – 3/4/26 – Worst to First and First to Worst
See what’s driving market performance around the world in today’s Morning Lineup. Bespoke’s Morning Lineup is the best way to start your trading day. Read it now by starting a two-week trial to Bespoke Premium. CLICK HERE to learn more and start your trial.
“In wartime, truth is so precious that she should always be attended by a bodyguard of lies.” – Winston Churchill

Below is a snippet of commentary from today’s Morning Lineup. Start a two-week trial to Bespoke Premium to view the full report.
It’s been an up-and-down overnight session for US equity indices, and as we type this now, both the S&P 500 and Nasdaq futures are basically flat with moves of less than 10 bps to the upside. Treasury yields are slightly higher, crude oil is flat, and gold is up less than 1%. Pretty quiet day, huh?
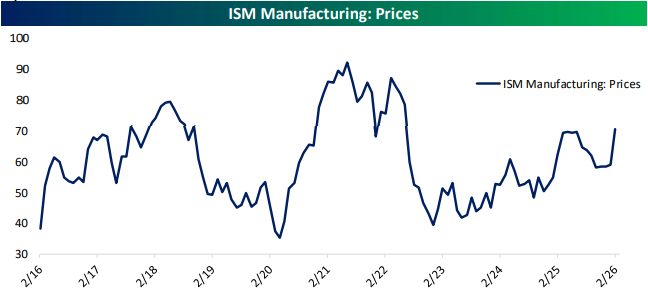
Iran will have the potential to continue dominating market action for the day, but don’t forget about the ADP Employment report, ISM Services, and then Broadcom (AVGO) earnings after the close. Earlier this week, the ISM Manufacturing report had the highest Prices Paid reading since 2022, so that will be a key metric to watch in today’s report for the services sector.
The bottom fell out of Asian stocks overnight as the Nikkei fell 3.6%, and every other major benchmark index in the region fell at least 1%. The real damage, though, was in South Korea, where the KOSPI fell over 12% for its worst day on record. There have been major market panics over the last 40 to 50 years, but none of them featured a day when South Korean stocks had a worse one-day decline. Fallout from the war in Iran was the primary driver of the declines, but Chinese PMI data for the Manufacturing and Services sectors also came in weaker than expected.
European stocks are following a different path than Asia, as the STOXX 600 is up over 1%, and the only major country up by less than 1% is the UK. Spanish stocks have managed a gain of 1.4% despite threats from the Trump Administration to cut off trade with the country. Service sector PMIs for the Eurozone and individual countries were basically in line with or slightly better than expected.
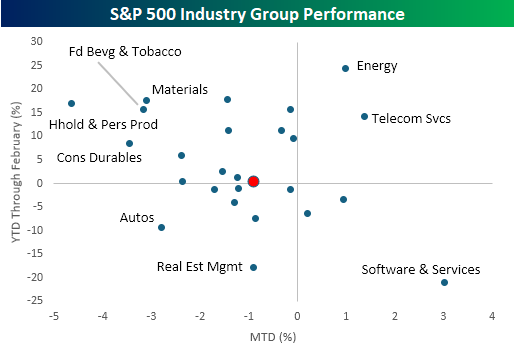
After two full sessions of trading since the war in Iran started, the overall market reaction has been subdued, but there have been some larger moves among individual industry groups. While the S&P 500 is down less than 1%, 16 out of 25 industry groups are up or down more than 1%.
This morning, we wanted to focus on some of the extremes. Starting with the winners that have continued winning, the only two groups that were up YTD heading into the conflict and have continued higher since are Energy and Telecom Services. Along with those two groups, the only others that are up this week are Software & Services (3.0%), which took the opposite path of South Korea by going from worst to first, Commercial Services (0.9%), and Banks (0.2%).
To the downside, some of the worst-performing sectors this week were some of the best YTD performers heading into the conflict. Household & Personal Products, Food Beverages & Tobacco, and Materials were all up over 15% YTD heading into the week, and they’re all down over 3% this week. As painful as the declines may feel this week, they’re coming off of a high base. It’s also worth noting that while Software stocks have bounced, Autos and Real Estate Management- the second and third worst performing groups YTD heading into the conflict have continued lower.
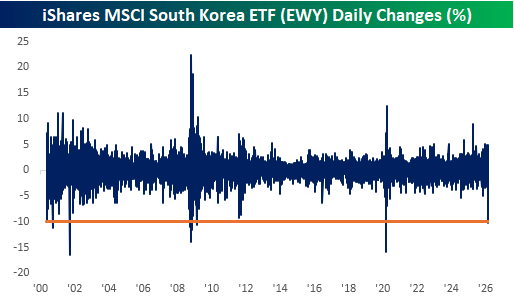
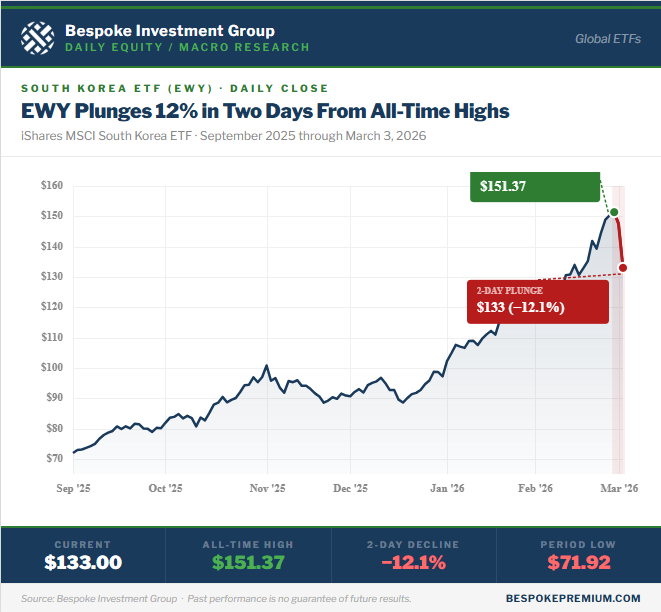
Outside of the US, we’ve also seen some major reversals this week. In yesterday’s Chart of the Day, we noted the outperformance of US stocks relative to the rest of the world. Nowhere has this reversal been more evident than in the performance of South Korean stocks. On Monday, the iShares MSCI South Korea ETF (EWY) fell more than 10% for its largest one-day decline since the Covid crash (South Korea’s KOSPI last night had its worst day on record). As shown in the chart below, declines of this magnitude have only been seen during periods of major crises like Covid, the Financial Crisis, and the dotcom bust.
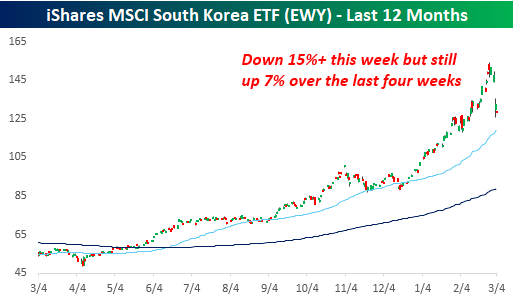
Besides Monday’s decline, EWY continued lower yesterday and is indicated down by another 3% this morning. That takes its decline this week to over 15%, and as sharp as that may sound, the ETF is still up over 7% in the last four weeks. It’s been a rocky few sessions, but if someone told you four weeks ago that you’d have a 7% gain in a month despite a major war in the Middle East, who wouldn’t have signed up for that?
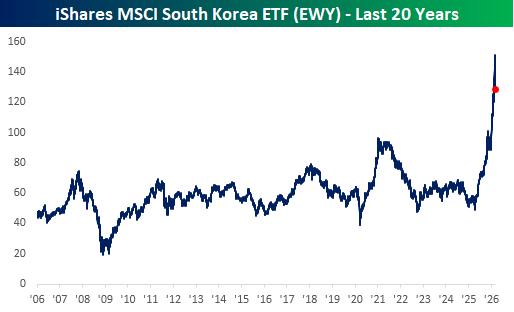
From a longer-term perspective, EWY still looks extremely extended relative to its historical range. After breaking out above its 2021 highs late last year, it is still up over 32% YTD, making it the top-performing major country ETF, so it’s hardly oversold.
The Closer – Leverage, Oil Vol, KISS Basket – 3/3/26
Log-in here if you’re a member with access to the Closer.
- US equity leverage is currently modest at 0.8x, but bond markets are showing elevated leverage levels.
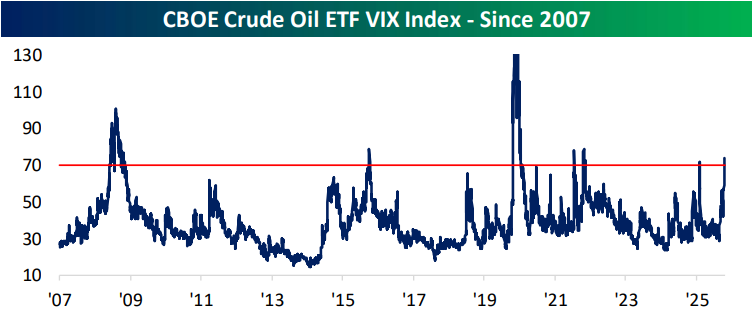
- Volatility is rising across assets with crude oil being the most pronounced example as the oil VIX is now at the highest level since the onset of the Russia-Ukraine war.
- The Logistics Managers Index showed significant expansion in transportation prices.
See today’s full post-market Closer and everything else Bespoke publishes by starting a 14-day trial to Bespoke Institutional today!
Daily Sector Snapshot — 3/3/26
Chart of the Day – Historic Moves
Country ETFs Hit Again Pre-Market
Last night we highlighted the big drop in global equity ETFs to start the week after the US/Israel attack on Iran caused energy prices to spike.
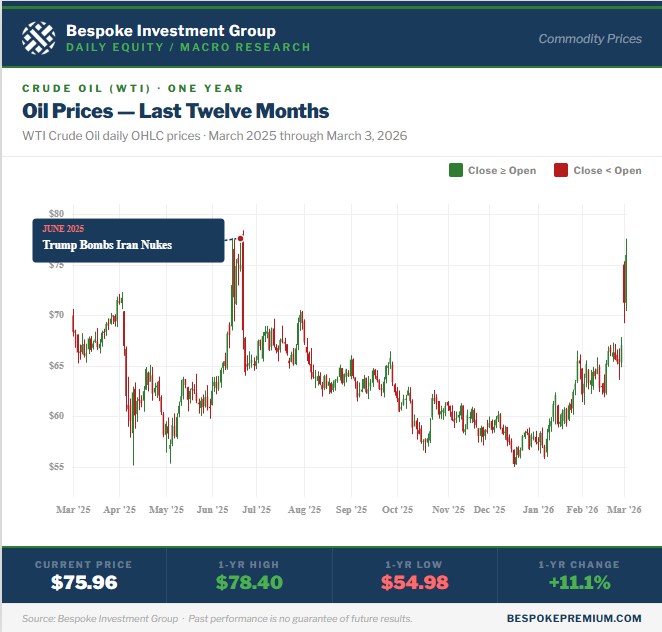
This morning, energy prices are trading sharply higher once again as investors begin to fear a more prolonged conflict in the Middle East. While oil traded up to $75/barrel yesterday, it finished the day just below $72. This morning, crude has gotten as high as $77.50, and it’s currently trading right around $76.
Notably, oil prices are currently right near the levels they peaked at last June when the US and Israel attacked Iran’s nuclear facilities.
Stock markets around the world are trading sharply lower once again today.
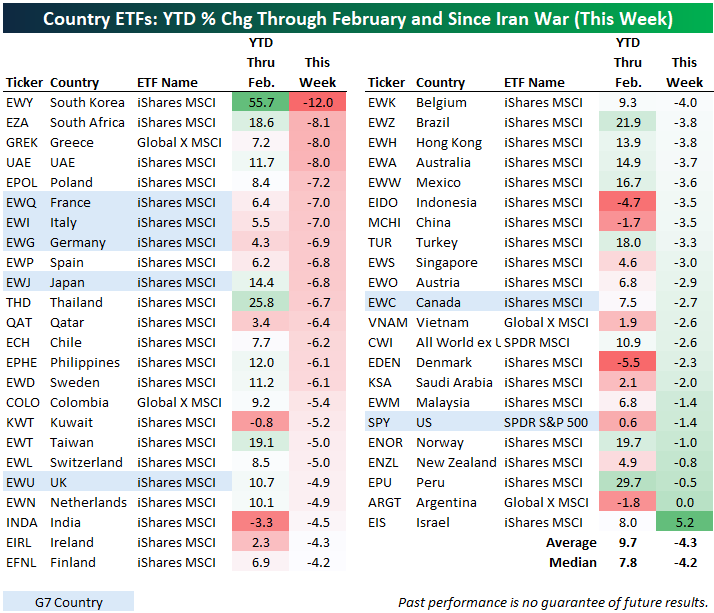
Below is a snapshot of 45 country ETFs traded on US exchanges, along with the all-world ex-US ETF (CWI). On average, these ETFs were up 9.7% year-to-date through February, but based on where they’re trading in the pre-market, they’re down an average of 4.3% already this week since the weekend attack on Iran.
The four hardest hit country ETFs have been South Korea (EWY), South Africa (EZA), Greece (GREK), and the UAE (UAE). All four of these are down 8% or more this week, with South Korea (EWY) down the most at 12%.
Israel (EIS) is the only country ETF that is up since the Iran attack with a gain of 5.2%, while the US (SPY) is down just 1.4%, the sixth best performer. Other country ETFs that have yet to get hit hard include Argentina (ARGT), Peru (EPU), New Zealand (ENZL), Norway (ENOR), and Malaysia (EWM).
Below is a six-month price chart of the South Korea ETF (EWY), which was easily the best performer of the group recently through the end of February. Its 2-day drop of 12.1% only brings it back to levels it was trading at a couple of weeks ago.
Like this analysis? Join our premium members by starting a trial today! Click below for details on how to sign up:

Bespoke’s Morning Lineup – 3/3/26 – Another Sentiment Shift
See what’s driving market performance around the world in today’s Morning Lineup. Bespoke’s Morning Lineup is the best way to start your trading day. Read it now by starting a two-week trial to Bespoke Premium. CLICK HERE to learn more and start your trial.
“The hardest hits are yet to come from the U.S. military,” – Marco Rubio, US Secretary of State
Below is a snippet of commentary from today’s Morning Lineup. Start a two-week trial to Bespoke Premium to view the full report.
Futures are off their overnight lows, but the optimism from the close yesterday evaporated quickly. The S&P 500 is indicated to gap down 1.4% at the open, while the Nasdaq will open down closer to 2%. These are even larger downside moves than at yesterday’s open! Treasury yields continue to move higher as the 10-year yield is back to 4.10%, and oil is on pace for its second day in a row of 6%+ gains. Unlike yesterday, though, there’s been no bid for gold or other precious metals as they’re all sharply lower. Bitcoin is also down 3%.
In Asia, markets are lower again this morning as the Nikkei fell 3.1%, China was down over 1%, and South Korea, after being closed on Monday, tanked 7.2%. It’s the same sea of red in Europe as well. The STOXX 600 is already down 3% on the day, on some of the most negative breadth we have seen in quite some time (24-1 to the downside and every group is down over 1.55%). As bad as US futures look this morning, the losses are a scratch relative to the gash in international markets. From an energy perspective, the US is much more insulated than the rest of the world is to Middle Eastern oil and gas. Therefore, the longer the conflict drags on, the more US assets should catch a bid, at least on a relative basis.
After an impressive turnaround from the morning lows yesterday, the ink was barely dry on the closing prices for the day when US Secretary of State Marco Rubio briefed the press with a statement that included the quote above. That, along with Iranian drone attacks on the US embassy in Riyadh, comments from the IRGC that the Strait of Hormuz was “closed” and any ships that attempted to traverse through it would be set ablaze, and a directive from the State Department for all personnel in Bahrain, Iraq, and Jordan to evacuate those respective countries, has caused a sharp reversal in sentiment as to the scope and duration of the current war situation in the Middle East.
At points yesterday, there was growing confidence that the operation against Iran would be quick, but this morning, we’ve seen some warnings from analysts that it already looks as though the US is getting involved in a prolonged quagmire (even though it hasn’t even been four days to this point). The next several days promise to feature multiple swings in sentiment as the situation unfolds, but remember this: no one knows exactly how this will all play out. The comments from Rubio above and the ones from the IGRC regarding the Strait of Hormuz sound dire, but what else do you expect them to say in the middle of a war?
We’ve only had one day of trading since the war began, and already the market action has been a roller-coaster. After gapping down more than 1% at the open yesterday, the SPDR S&P 500 ETF (SPY) bounced throughout the trading day to finish marginally higher, in what was only the 60th time since its launch 33 years ago that the ETF gapped down at least 1% and finished the day higher. With futures trading sharply lower again this morning, SPY is on pace to gap down more than 1% again today, and of those 59 prior reversals, SPY only gapped down more than 1% the following session six other times
This type of volatility only occurs under one condition – massive uncertainty. As shown by the red dots in the chart, the prior back-and-forth reversals were in December 2002, coming out of the dotcom bust, late 2008 following the collapse of Lehman, January 2022 when inflation started to spike, and last April during the tariff-tantrum. What’s somewhat unique about the current period, however, is the level of the VIX. In the six prior occurrences, the average level of the VIX was 40, and it was never below 30. As of this morning, the VIX is trading just under 26. Also, while the S&P 500 remains close to 52-week highs, all of the others, except the one in January 2022, occurred closer to 52-week lows.

While these types of reversals have been rare for SPY, the Nasdaq 100 is inherently more volatile, so it shouldn’t come as a surprise that they have been more common in QQQ. Today’s reversal will be the 19th such reversal. As shown in the chart below, most of these reversals occurred during the dot-com bust, with 12 between the March 2000 peak and the October 2002 lows. As the Nasdaq has ‘matured’ since then, occurrences have been much less frequent, with three during the financial crisis, one in early 2019, another in January 2022, and most recently in April of last year.

Ex US Gets Hit on Energy Price Spike
The S&P 500 opened down more than 1% to start the week after the US attacked Iran over the weekend, but the index closed slightly positive by day’s end. Yesterday we published a write-up highlighting the recent outperformance of international equities versus the US, but that script was flipped on its head today.
As shown below, key international equity ETFs like CWI (all world ex. US), EEM (emerging markets), VPL (Pacific region), and FEZ (Europe) were solidly green through February, but they fell sharply today. China (MCHI) also fell nearly 1% today, while the US (SPY) posted a small gain of 0.05%.
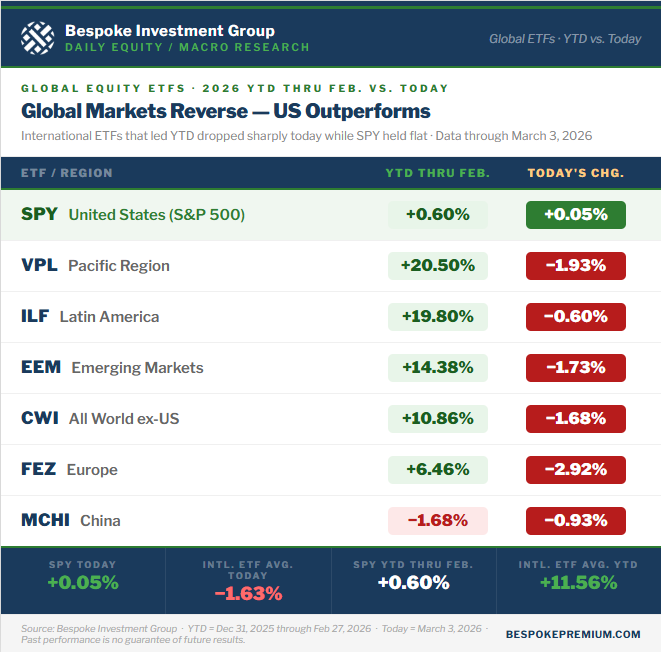
The reason for today’s global equity divergence was a spike in energy prices due to the attack of Iran. With oil and natural gas prices spiking, countries that rely on energy imports got hit hard, while the US — which is energy independent — held strong.
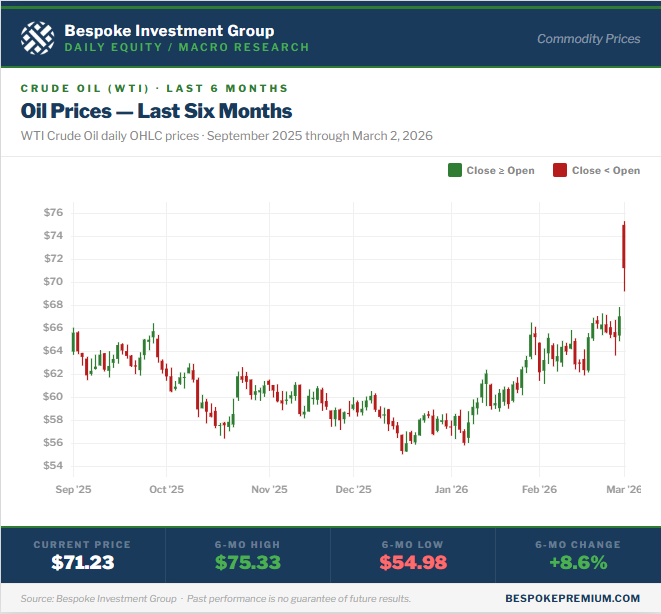
As shown below, oil prices spiked into the mid-$70s at the highs today before pulling back to close just below $72. It was a fresh six-month high for crude.
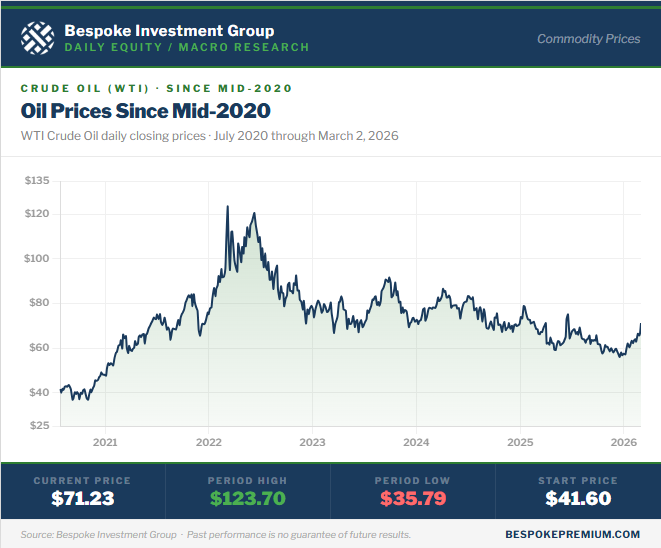
Even after today’s spike, though, oil prices remain stuck in a downtrend dating back to 2022 highs:
Like this research? Join our premium members by starting a trial today! Click below for details on how to sign up:
The Closer – Reversals, LNG and Rates, PMIs – 3/2/26
Log-in here if you’re a member with access to the Closer.
- Today’s morning selloff in stocks appeared to be severe at first, but equities managed to pivot into the green by the close.
- Energy stocks and prices caught a bid on the latest Iran news while US LNG exports continue to swell.
- ISM Manufacturing data indicated continued robust activity in the month of February.
See today’s full post-market Closer and everything else Bespoke publishes by starting a 14-day trial to Bespoke Institutional today!
Daily Sector Snapshot — 3/2/26
The Triple Play Report: 2/26/26
An earnings triple play is a stock that reports earnings and manages to 1) beat analyst EPS estimates, 2) beat analyst sales estimates, and 3) raise forward guidance. You can read more about “triple plays” at Investopedia.com where they’ve given Bespoke credit for popularizing the term. We like triple plays as an indication that a company’s business is firing on all cylinders, with better-than-expected results and an improving outlook. A triple play is indicative of positive “fundamental momentum” instead of pure fundamentals, and there are always plenty of names with both high and low valuations on our quarterly list.
Bespoke’s Triple Play Report covers what each company does, what this quarter’s results say about their growth outlooks, and their histories of delivering triple plays. Bespoke’s Triple Play Report is available at the Bespoke Institutional level only. You can sign up for Bespoke Institutional now and receive a 14-day trial to read today’s Triple Play Report. To sign up, choose either the monthly or annual checkout link below:
Bespoke Institutional – Monthly Payment Plan
Bespoke Institutional – Annual Payment Plan
Bespoke Investment Group, LLC believes all information contained in these reports to be accurate, but we do not guarantee its accuracy. None of the information in these reports or any opinions expressed constitutes a solicitation of the purchase or sale of any securities or commodities. This is not personalized advice. Investors should do their own research and/or work with an investment professional when making portfolio decisions. As always, past performance of any investment is not a guarantee of future results. Bespoke representatives or clients may have positions in securities discussed or mentioned in its published content.