Q1 2025 Earnings Conference Call Recaps: Dollar General (DG)
Bespoke’s Conference Call Recaps use AI to summarize lengthy earnings calls. The commentary below is AI-generated and then edited by Bespoke for quality control. As always, none of these summaries should be construed as recommendations to buy or sell any securities, and investors should do their own research and/or consult with a financial professional before making any investment decisions.
Our latest recap available to Bespoke subscribers covers Dollar General’s (DG) Q1 2025 earnings call.
![]()
Dollar General (DG) is a discount retailer with over 20,000 stores across the US, primarily serving low-to-middle-income households in rural and suburban areas. The company offers everyday necessities, such as groceries, cleaning supplies, health products, and basic apparel, at competitive prices, often positioned below mass retailers. It has become a key barometer of financially constrained consumers and trade-down behavior, especially during economic stress. Dollar General also operates a growing number of pOpshelf locations, which cater to more discretionary purchases like home goods and seasonal items, and continues to expand its delivery and digital capabilities. DG exceeded expectations in Q1, with net sales up 5.3% fueled by same-store sales growth of 2.4% and strong performance in both consumables and discretionary categories. Management emphasized rising trade-in from higher-income shoppers, a 61bps improvement in shrink, and early success from 1,227 completed remodels. Tariffs were a key variable, though DG is opening past playbooks to mitigate the impact. Digital delivery sales jumped over 50% YoY, and the pOpshelf format beat expectations. On better-than-expected results, DG shares rose as much as 16.1% on 6/3…
Continue reading our Conference Call Recap for DG by becoming a Bespoke Institutional subscriber. You can sign up for Bespoke Institutional now and receive a 14-day trial to read our newest Conference Call Recap. To sign up, choose either the monthly or annual checkout link below:
Bespoke’s Morning Lineup – 6/4/25 – Mean Reversion
See what’s driving market performance around the world in today’s Morning Lineup. Bespoke’s Morning Lineup is the best way to start your trading day. Read it now by starting a two-week trial to Bespoke Premium. CLICK HERE to learn more and start your trial.
“If you don’t have time to do it right, when will you have time to do it again?” – John Wooden

Below is a snippet of commentary from today’s Morning Lineup. Start a two-week trial to Bespoke Premium to view the full report.
To view yesterday’s CNBC interview, you can just click on the image below.

Futures were comfortably higher leading up to this morning’s ADP Employment report, but the headline number came in weaker than expected at just +37K versus forecasts for an increase of 110K. This report often varies widely from the Non-Farm Payrolls report, but for investors looking for any sign that the economy is weakening, this gives them something to latch on to. Coming up later, we’ll get the May ISM Services report, which will also likely move markets. Within minutes of the ADP release, President Trump hit the Truth Social account calling on “Too Late” Powell to cut rates.
Despite today’s post-ADP weakness, US equities just recently moved back into positive territory for the year, meaning stocks worldwide are now pretty much higher across the board. But the performance gap remains wide. While Latin American and European equities are sitting on gains of more than 20%, and most other regions of the world are up by double-digit percentages, the US finds itself in the unusual position of looking up to its global peers.
In the short term, though, US stocks have been outperforming. Over the last week, Latin America and Europe are down while the S&P 500 is up nearly 1%. Recent performance looks like it’s been a bit of a mean reversion trade, though, as all seven regional international ETFs shown are between 4% and 7% above their 50-day moving averages (DMA).

Price charts of the regional ETFs over the last six months also illustrate some of the performance disparity on both a YTD basis and over the last week. Over the longer-term, the US is the only one of the seven ETFs shown that hasn’t hit a 52-week high in the last couple of weeks, but whereas Emerging Markets (EEM), Latin America (ILF), and Europe (VGK) have been moving in more of a sideways direction over the last week or two, the S&P 500 just hit a post “Liberation Day” high yesterday.

The Closer – Risk Appetite, Jobs, LMI – 6/3/25
Log-in here if you’re a member with access to the Closer.
Looking for deeper insight into markets? In tonight’s Closer sent to Bespoke Institutional clients, we lead off with some proxies on consumer and institutional appetite (page 1). After extending the discussion on credit spreads into long bond yield drivers (page 2), we then review the weakness in the dollar (page 3). We then dive into the latest job openings data in the form of the JOLTS report (page 3) and Indeed’s data (pages 4 and 5). We finish with a look into the Logistics Managers’ Index (pages 6 and 7).

See today’s full post-market Closer and everything else Bespoke publishes by starting a 14-day trial to Bespoke Institutional today!
Daily Sector Snapshot — 6/3/25
B.I.G. Tips – A Look at 45 Recent IPOs
The IPO market is getting some renewed interest with AI-stock CoreWeave (CRWV) performing well and the upcoming offering of fintech company Circle (CRCL) later this week. While the AI boom has been raging for over two years now, we have yet to see a big uptick in IPOs similar to what we saw during the Dot Com boom of the late 1990s. Most of that is due to successful private companies now preferring to stay ‘private for longer’, but we’d expect at least an eventual uptick in companies going public if AI is going to have staying power.
We looked at all of the stocks that have gone public in the US over the last couple of years and found 45 that are above $250 million in market cap save a few single-drug biotech offerings. We’ve broken them up into four categories: ones that are in uptrends, ones that are in the process of breaking downtrends, ones that are in sideways trends, and ones that are in downtrends. Our goal with this analysis is to give Bespoke subscribers some ideas to research further to see if any pique their interest.
To unlock our latest B.I.G. Tips report taking a look at 45 recent IPOs, login or start a two-week free trial to either Bespoke Premium or Bespoke Institutional.


No More Juice – The Rise and Fall of Orange Juice Futures
Over the past five years, orange juice futures have seen a wild ride, surging to record highs and then crashing just as dramatically. At the heart of it all has been a perfect storm of tightening supply and speculative hype.
Starting in 2020, the orange juice market began heating up. Florida’s orange production was getting hammered by citrus greening disease, which is a long-standing bacterial infection caused by a bug that decimated groves across the state. On top of that, extreme weather events like hurricanes Ian (2022) and Milton (2024) only exacerbated an already weak supply backdrop. As supply dropped off, prices started creeping higher, and that’s when the financial players stepped in.
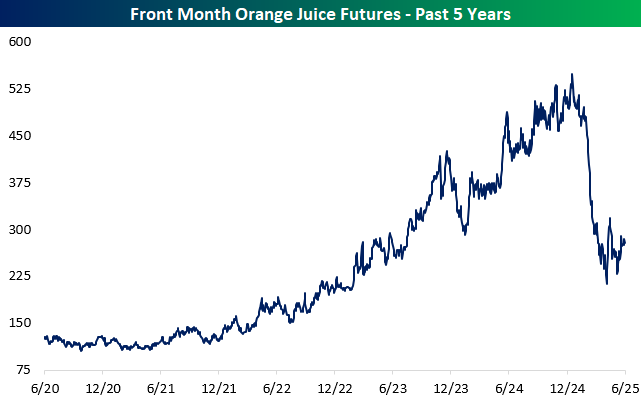
By 2022, hedge funds and other money managers began piling into orange juice futures. Prices, which historically hovered between $1 and $2 per pound, shot up, eventually peaking near $5.50 in December 2024 as OJ became one of the hottest trades in the agricultural commodities space. According to CFTC data, managed money had built up a near-record long position earlier in 2024, totaling about $260 million in speculative longs. These weren’t farmers or juice companies hedging their harvests, but instead mostly speculators betting on prices continuing to rise.
After OJ prices took the stairs up from 2022 to 2024, it took the elevator down to start 2025. Given the build-up in speculative positions, it didn’t take much to spark a rush for the exits when Trump’s tariff threats began earlier this year. Canada and Mexico are by far the two largest importers of US orange juice, and when President Trump began fighting with those two countries on trade at the start of his second term, OJ futures cratered from more than $5.25 in mid-December to less than $2.25 by April. The thin market in the commodity magnified the move, with relatively small volumes leading to outsized price swings. In the entire history of the Orange Juice futures contract, the four-month decline from the December high was the largest on record!

Domestic fundamentals for OJ remain shaky. The USDA forecasts a 25% drop in Valencia orange production this season in the US, with Florida’s output expected to be 38% smaller than last year’s. Greening disease continues to harm groves, and Florida’s citrus acreage keeps shrinking due to both infection and land development.
While the US supply picture looks bleak, the global story shifted in early 2025. As Florida’s production has collapsed nearly 90% since 2005, the US has leaned more heavily on imports, especially from Brazil and Mexico. In 2024, the US brought in over 400,000 metric tons of orange juice, the highest level in nearly a decade. Then, in early 2025, Brazil projected a massive crop rebound of 300 million boxes, up 30% from the previous year. Along with US tariff concerns, Brazil’s expected surge in supply also contributed to OJ’s price drop.
So where do we go from here?
In the short term, orange juice futures have stabilized in the $2.75–$3.25 range. If the new Brazilian supply materializes, it would ease scarcity concerns and likely keep downward pressure on prices, especially with the U.S. relying heavily on imports. The effect could be even stronger if the Brazilian real stays weak, making exports to the US more attractive.
That said, there’s still a plausible bullish scenario. The National Hurricane Center is forecasting another above average season of tropical activity in the Atlantic, and if one of those storms were to hit Florida this year, or if greening disease worsens, supply could be disrupted again in both the US and Brazil, potentially pushing prices back above $4. And if inflationary pressures resurface, agricultural commodities could catch another bid from macro traders.
Ultimately, this market remains highly reactive. It doesn’t take much to move the needle when fundamentals are tight and speculative money is involved. If you’re trading orange juice futures, it’s less about slow and steady fundamentals and more about who’s in the trade, how fast they’re moving, and whether the supply narrative is tightening or loosening. For now, the squeeze is easing—but it wouldn’t take much to bring the juice back.

Chart of the Day – Strong to a Weak Period
Bespoke’s Morning Lineup – 6/3/25 – Rise and Shine
See what’s driving market performance around the world in today’s Morning Lineup. Bespoke’s Morning Lineup is the best way to start your trading day. Read it now by starting a two-week trial to Bespoke Premium. CLICK HERE to learn more and start your trial.
“In 1989, we were at a crossroads to see what kind of society China would have. Now it’s settled: You can get rich, but you can’t open your mouth.” – Adi Ignatius
Below is a snippet of commentary from today’s Morning Lineup. Start a two-week trial to Bespoke Premium to view the full report.
US equity futures were under pressure before the sun came up on the East Coast this morning. As the sun rose, though, so too did prices, and based on where things stand now, the S&P 500 and Nasdaq are on pace to open just modestly lower. In China overnight, the manufacturing PMI for May dropped back below 50 for the first time this year, indicating ongoing weakness as the trade war weighs on the manufacturing sector. In Europe, inflation was below the ECB’s 2% target as May CPI rose at just 1.9% y/y.
In the US, the only reports on the calendar are Factory Orders (expected to fall 3.1% y.y) and JOLTS (7.1 million), and the OECD lowered its 2025 GDP growth forecast for the US down from 2.2% to 1.6. On the earnings front, the only major movers this morning are Dollar General (DG) and Signet (SIG), and both stocks are trading up over 10%. While not related to earnings, shares of Constellation Energy (CEG) are also sharply higher after announcing a multi-year deal to supply Meta (META) with nuclear power.
Today also marks the 36th anniversary of the Chinese military’s crackdown on the pro-democracy protest in Tiananmen Square. Even if it has been ‘forgotten’ by the Chinese internet, who can forget the picture of “Tank Man” defiantly standing in front of a row of Chinese tanks? As Adi Ignatius, who covered the protests for the Wall Street Journal, put it, Tiananmen Square was a crossroads in history where citizens had the opportunity to get very rich as long as they could just keep their mouths shut. Jack Ma knows this all too well.
While the government’s actions in 1989 were a big blow to democracy and saw individual freedoms get crushed, China has seen a major surge in its wealth. In 1989, per capita GDP in China was less than $311. Today, it’s $12,614, representing an increase of 3,950%. Over that same period, US per capita GDP increased by less than 260%.

Comparing per capita GDP in China to the US shows how the gap has narrowed. While US per capita GDP is still 6.5 times the level of China, in 1989, US per capita GDP was more than 70 times China’s! While China has narrowed the gap in a big way, its rate of growth relative to the US has slowed considerably in recent years. In the ten years leading up to Xi Jinping becoming President in 2013, the ratio of US to Chinese per capita GDP shrank from 30.6 to 7.6. Since Xi became President in 2013, the ratio has declined from 7.6 to 6.5.

The slowing growth of China has also been reflected in the performance of Chinese stocks. While the iShares MSCI China ETF (MCHI) has seen some big moves, both up and down over the last 10+ years, its price is essentially unchanged from where it was 14 years ago.

The Closer – Manufacturing Miss, Transportation, Baskets – 6/2/25
Log-in here if you’re a member with access to the Closer.
Looking for deeper insight into markets? In tonight’s Closer sent to Bespoke Institutional clients, we start with a look into the ISM Manufacturing release missing estimates (page 1) followed by a review of transportation cost data (page 2). After recapping the latest construction spending figures (page 3), we then review performance of a handful of baskets including AI, autos, and private equity (page 4). We also check in on individual stock contributions (page 5) and our MAHA baskets (pages 6 and 7).

See today’s full post-market Closer and everything else Bespoke publishes by starting a 14-day trial to Bespoke Institutional today!