February 2019 Headlines
Chart of the Day – March Intra-Month Seasonality
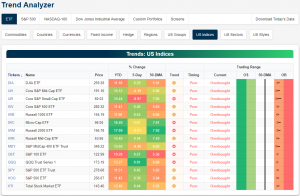
Trend Analyzer – 3/1/19 – Sideways Start
February is already over, and the 2019 rally so far has led the major indices to finally exit their downtrends. For the first time since late November of last year, a majority of the index ETFs are not in downtrends. We begin March with eight of the fourteen index ETFs tracked through our Trend Analyzer trending sideways while the remainder still are trending down. As they all have made progress off of lows, further upside could certainly push the rest of the ETFs into the sideways camp. Though each ETF is still overbought, selling over the past week has brought the ETFs back to down to Earth from near extreme overbought levels.
Performance of these index ETFs over the past five days is as mixed as their trends, ranging from a loss of just under 1% to gains of just under 1%. In spite of strength throughout 2019, small and mid caps have been lagging behind in the past week. Of these, only the Micro-Cap (IWC) and Russell Mid Cap (IWR) have managed to edge out again but even these gains are nothing to write home about. IWC is up 0.07% while IWR is better at 0.34%. The Core S&P Small Cap (IJR) has been the worst of these ETFs losing 0.97% this week. Meanwhile, the Nasdaq (QQQ) has been the best of these ETFs this week.
Morning Lineup – Perfect Ten
The week looks to be ending on a positive note with US futures higher and the Nasdaq on pace for its 10th straight week of gains. In economic data, Personal Income and Spending both missed estimates, but the big report of the day will be ISM Manufacturing at 10 AM (consensus estimate- 55.8 vs 56.6 last month). Read all about overnight events and this morning’s news in today’s Morning Lineup.
Bespoke Morning Lineup – 3/1/19
As long as the Nasdaq doesn’t finish down five points or more today (it’s currently indicated up by 50), this will be the tenth straight positive week for the index. The last time that happened was nearly two decades ago in 1999! Below are all of the ten-week winning streaks for the Nasdaq as well as its performance following the tenth straight up week. Interestingly enough, of the eight prior ten week streaks, six went to eleven or more. As shown, the average performance the week after the 10th straight positive week was a gain of 1.07% (median: 1.58). Even more impressive is the fact that three months later the Nasdaq was up every time for an average gain of over 10%! Looking further out, six-month and one-year returns are a little more muted, but the only time the Nasdaq was down one year later was after the last streak in 1999 when it fell more than 36%!

Start a two-week free trial to Bespoke Premium to see today’s full Morning Lineup report. You’ll receive it in your inbox each morning an hour before the open to get your trading day started.

The Closer — Curve Breaking Out, Oil Exports Surge, Very Strong Housing Data — 2/28/19
Log-in here if you’re a member with access to the Closer.
Looking for deeper insight on markets? In tonight’s Closer sent to Bespoke Institutional clients, we begin with a look at which stocks have been the best performers since the market peaked earlier in the week. We also give an update on the further breakout of the 10 year note that we mentioned yesterday. Next, we show the rapid decline in the US petroleum trade deficit. In spite of negative tones around housing, we then show how Q4 data out of the Census is showing a strong housing market. We finish with a deeper look into today’s GDP numbers which showed a still stagnant share of labor income but a pickup in investment.

See today’s post-market Closer and everything else Bespoke publishes by starting a 14-day free trial to Bespoke Institutional today!
Bespoke’s Sector Snapshot — 2/28/19
We’ve just released our weekly Sector Snapshot report (see a sample here) for Bespoke Premium and Bespoke Institutional members. Please log-in here to view the report if you’re already a member. If you’re not yet a subscriber and would like to see the report, please start a two-week free trial to Bespoke Premium now.
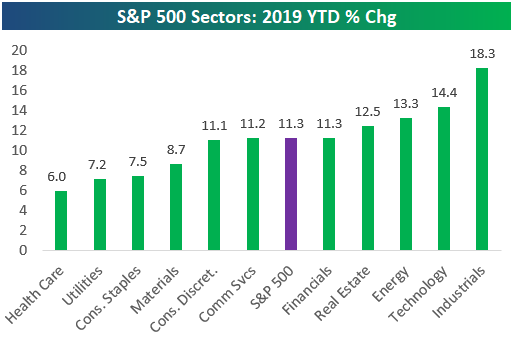
In this week’s Sector Snapshot, we look at year-to-date returns for the S&P 500 and its eleven sectors through the first two months of 2019. We also take a look at extremely high breadth levels that remain in place from last week.
To gain access to the report, please start a two-week free trial to our Bespoke Premium package now. Here’s a breakdown of the products you’ll receive.
B.I.G. Tips – March Seasonality 2019
B.I.G. Tips – Flat Yield Curves
Chart of the Day: Bearish Sentiment Indicates Rough Week But Great Year Ahead
Tax Law Changes Weighing On Housing
Earlier this week, S&P/Case-Shiller home price indices for the month of December were released. We discussed them in detail in our Chart of the Day on Tuesday. We made three key observations.
First, we noted that seasonally adjusted Case-Shiller home prices tend to exhibit some residual seasonally. After re-seasonal adjustment, we can see monthly price changes. That leads to a second observation: home prices have slowed considerably from annual rates north of 6% in mid-2018 to more like 3% today, though no month has seen home prices either decline or rise slower than inflation.
Finally, a third observation: capped deductions on state and local taxes (part of the tax cuts passed at the end of 2017) seem to be having a significant impact on home prices. As shown in the chart below, metro areas with high tax rates have seen home price growth much lower on average than metros with low tax rates. It seems clear that the Tax Cuts and Jobs Act (TCJA) is having a material impact on the price appreciation of homes in areas where homeowners can no longer deduct as much of their state and local taxes.
