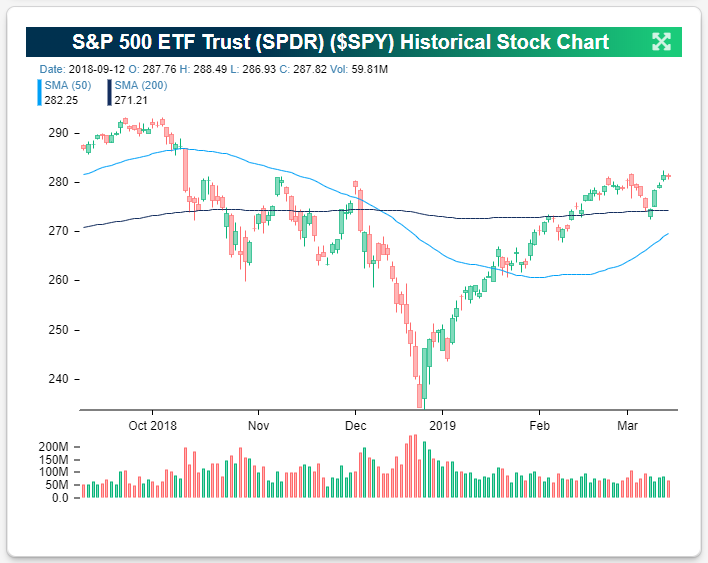
S&P 500 (SPY) Ending Week at Key Resistance Point
The S&P 500 has managed to close above 2,800 this week and make a new 2019 high, but the index is still dealing with resistance between 2,815-2,820. As shown in the charts for SPY below, this is an area that the index has tested (and failed) five times already over the last six months. It would be a fitting end to what has been a strong week for US equities if the S&P could finally break through resistance today. All it will take to push through is a gain of roughly 50 basis points today. Happy Friday trading!
Note that the charts below are pulled directly from the Tools section of our membership area. You can start using all of Bespoke’s helpful trading tools by starting a 2-month free trial to Bespoke Interactive today.

The Closer — Treading Water, Shorts Sinking, Claims Floating, Fund Flow Flailing — 3/14/19
Log-in here if you’re a member with access to the Closer.
Looking for deeper insight on markets? In tonight’s Closer sent to Bespoke Institutional clients, we begin with a note on small cap’s drastic underperformance so far this month. As the VIX reached a 100-day low yesterday and again today, we show the returns of the S&P 500 following other times that the VIX has seen these kinds of movements. Next, we highlight an interesting trend in Initial Jobless Claims so far this cycle as the indicator shows some signs of slowing momentum. Staying on the topic of labor markets, we also show the pickup in Continuing Claims which, like Initial Claims, are turning yellow. We finish with a brief look at investors hesitation to reenter equities based on fund flows into mutual funds and ETFs.

See today’s post-market Closer and everything else Bespoke publishes by starting a 14-day free trial to Bespoke Institutional today!
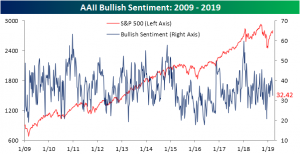
Less Optimism Among Individual Investors
Bullish sentiment as seen through AAII’s weekly survey of individual investors released this morning showed another drop in bullish sentiment. This comes following the first weekly decline that equities have seen so far in 2019. The percentage of investors expressing optimism dropped to 32.42% from 37.39% last week. The week prior to that was a recent high, and the highest since early November, at 41.63%. Given this week’s strong rally so far, it would not be surprising if bullish sentiment picks back up again in next week’s survey.
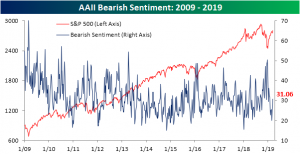
Conversely, bearish sentiment rose to its highest level since the final days of January coming in at 31.06% versus 26.75% last week. Bearish sentiment has come well off of its lows of 20% only a couple of weeks ago. Where it currently sits is much more in line with its historic average of 30.5%.
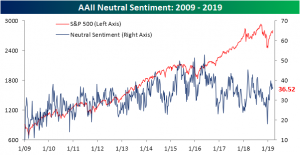
Meanwhile, neutral sentiment (investors not predicting any change in the stock market) moved slightly higher to 36.52% after dropping to 35.87% last week. Unlike bullish and bearish sentiment which have seen a degree of mean reversion, neutral sentiment has remained fairly elevated for most of the new year. Seems to make sense that investors largely report neutral sentiment as Q4 highs continue to be stiff resistance.
Bespoke’s Sector Snapshot — 3/14/19
We’ve just released our weekly Sector Snapshot report (see a sample here) for Bespoke Premium and Bespoke Institutional members. Please log-in here to view the report if you’re already a member. If you’re not yet a subscriber and would like to see the report, please start a two-week free trial to Bespoke Premium now.
In this week’s Sector Snapshot, we update breadth and valuation levels for the S&P’s major sectors. We take a look at Tech’s move back into the #1 slot in terms of YTD performance and discuss why we think the Financial sector is looking more bullish.
To gain access to the report, please start a two-week free trial to our Bespoke Premium package now. Here’s a breakdown of the products you’ll receive.
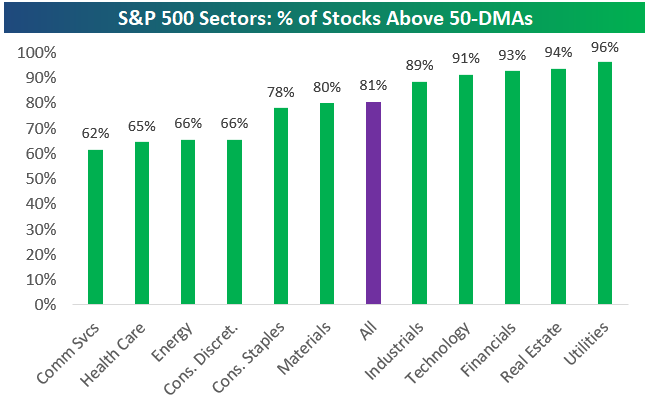
Chart of the Day: Utilities Sector Valuation Gets Charged
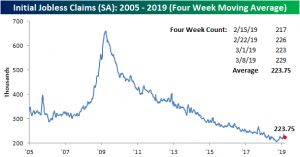
Initial Jobless Claims Up Again
Initial Jobless Claims came in 4K above expectations at 229K on a seasonally adjusted basis; up from last week’s 223K. This is near the upper end of the range jobless claims have been in for the past few months. It has also now been two months since claims last hit a new low of 200K. On the other hand, this week marks the 210th week that claims have come in below 300K. So while perhaps the strength of the labor market could be taking a breather, by all means, it still appears healthy.

For the third week in a row, the four-week moving average of the seasonally adjusted data has declined; falling to 223.75K from 226.25K last week. It has also now been three weeks since claims last hit a 52-week high. Though more 52-week highs are certainly not out of the realm of possibilities in the near future, this improvement seems to point to these highs from the beginning of February being more consistent with random spikes that have been observed in the past rather than a new trend. An additional note now looking back at February jobs data as a whole, with all of the data for the month in—namely last week’s abysmal Nonfarm Payrolls report showing only a gain of 20K—the labor market has seemed to calm down in the tail end of the month, and conditions seem to have improved slightly from the rough first couple of weeks in February.
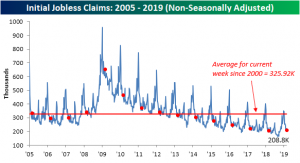
On a non-seasonally adjusted basis, claims fell this week consistent with seasonal tendencies. Declining 11.8K to 208.8K this week, the non-seasonally adjusted number came in far below the average of 325.9K for the current week of the year since 2000. Also while it is near cycle lows, the same week last year actually saw a lower number of 204.9K. Since the start of the year, there already has been five times that the non-seasonally adjusted claims number has come in worse than the prior year. That compares to only twice that it had happened in 2018 and seven times in 2017. So while still very healthy, going forward labor markets are certainly showing signs of losing momentum.
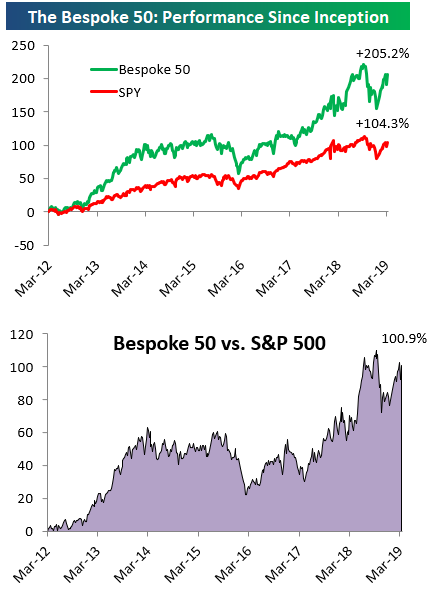
the Bespoke 50 — 3/14/19
Every Thursday, Bespoke publishes its “Bespoke 50” list of top growth stocks in the Russell 3,000. Our “Bespoke 50” portfolio is made up of the 50 stocks that fit a proprietary growth screen that we created a number of years ago. Since inception in early 2012, the “Bespoke 50” has beaten the S&P 500 by 100.9 percentage points. Through today, the “Bespoke 50” is up 205.2% since inception versus the S&P 500’s gain of 104.3%. Always remember, though, that past performance is no guarantee of future returns.
To view our “Bespoke 50” list of top growth stocks, click the button below and start a trial to either Bespoke Premium or Bespoke Institutional.
Morning Lineup – YTD Lows for the VIX
After a few quiet days outside of Boeing and Brexit to kick off the week, the flow of news is a bit more active this morning. Positive sentiment in equity futures has quickly worn off this morning as headlines indicate that the US and China have put off a planned meeting between President Trump and President XI later this month. The meeting now won’t occur until April at least. Sticking points like the treatment of intellectual property remain unresolved. The delay shouldn’t be entirely surprising given the President’s comments just yesterday that he was in no rush to sign a deal.
In economic data, Import and Export Prices rose more than expected, as was also the case with Jobless Claims. One stock to note, though, is GE. While the company lowered guidance earlier (no surprise there), it has actually erased earlier losses and is now positive.
Please click the link below to read today’s Bespoke Morning Lineup.
Bespoke Morning Lineup – 3/14/19
It shouldn’t come as much of a surprise given the market’s strength of late, but sometimes you need a chart to make it hit home. Volatility has once again sunken like a stone this year as the VIX dropped below 14 again this week and just this morning traded down to its lowest level since October 5th.

Start a two-week free trial to Bespoke Premium to see today’s full Morning Lineup report. You’ll receive it in your inbox each morning an hour before the open to get your trading day started.

The Closer — Market Gains Continue, Earnings Update, BRIC Strength — 3/13/19
Log-in here if you’re a member with access to the Closer.
Looking for deeper insight on markets? In tonight’s Closer sent to Bespoke Institutional clients, we discuss a number of reasons why the BRIC countries look bullish, including nice upside momentum versus the rest of the world. We also discuss bullish US equity market internals, recent earnings strength, and positive intraday market action.

See today’s post-market Closer and everything else Bespoke publishes by starting a 14-day free trial to Bespoke Institutional today!