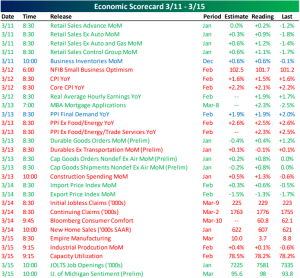
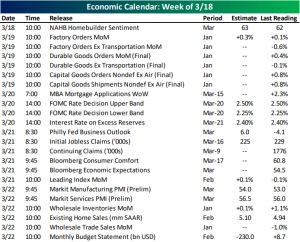
This Week’s Economic Indicators – 3/18/19
Last week was fairly busy in economic data with 31 releases spaced throughout the week; most of which came in weaker. Monday’s Retail Sales report for January offered some relief (but also confusion) from the awful December print. While January’s readings showed growth, the already bad readings from December were revised even lower. CPI data on Tuesday showed lower increases than January and came in lower than expected with the headline and core measures rising only 1.5% and 2.1%, respectively. Further in inflation data, on Tuesday Core PPI also missed estimates, though, it was in line with expectations. Friday was a rough day for industrial data as Industrial Production missed estimates, and Empire Manufacturing fell even as expectations called for an increase.
Turning to this week, it will be slightly less busy with only 23 releases compared to last week’s 31. Leading off was NAHB Homebuilder Sentiment which missed expectations coming in unchanged from last month. After Factory Orders tomorrow, there will be an FOMC rate decision on Wednesday, though, no one is expecting a change in rates. Thursday and Friday will have some big releases with the Philly Fed’s Business Outlook, Leading Indicators, preliminary Markit Manufacturing and Service PMIs, and the Budget Statement.
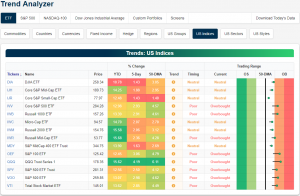
Trend Analyzer – 3/18/19 – Push Towards Overbought
Coming off of last week’s strong gains, the major index ETFs are mostly overbought headed into the new week with eight firmly overbought while the remaining six are still neutral. Those that are overbought are predominantly large caps, though, the Dow (DIA) is actually still neutral and tied with the Core S&P Small Cap ETF (IJR) for the least gains last week at only 1.43%. No doubt this comes as a result of the wild fluctuations in Boeing (BA). While no other small-cap performed as poorly as IJR last week, small and mid-caps have underperformed recently. Despite weaker gains in the past few weeks, since the start of 2019 this group has still treated investors well. While on this topic, the Nasdaq (QQQ), which rose 4.19% last week, has also become one of the best performers year to date. The rapid increase over the past week also leaves the ETF the most extended above its 50-DMA and the most overbought.
On a sector level, the tech-heavy Nasdaq’s rapid rise last week can be credited to the Technology Sector’s (XLK) strength in the past week as the ETF rose 4.56%, making it the most overbought and the furthest above the 50-DMA. Outside of Industrials (XLI) again due to Boeing, every sector has seen a significant push towards overbought levels in the past week. Namely, the Health Care Sector (XLV) has risen from right at the 50-DMA to just under one standard deviation above today.

Morning Lineup – Upward Drift Continues
Not a lot in the way of macro headlines this morning, but US equity futures are modestly higher, although continued weakness in Boeing (BA) is pressuring the DJIA. Chinese equities kicked off the week with another rally of over 2%, sending the CSI 300 to its highest close of the current rally. In the ongoing China-US trade saga, a potential summit between Trump and Xi is looking like it will be pushed back to June.
Please click the link below to read today’s Bespoke Morning Lineup.
Bespoke Morning Lineup – 3/18/19
February trade data for Singapore had good news for optimists on global activity. While both leading indicators and broad gauges of global trade activity have been in pretty persistent decline of late, we note that exports for Singapore (both from its domestic economy, and via broader measures like re-exports and container volumes, both of which are highly sensitive to global trade activity) have not suffered all that much. Certainly, exports are down, and re-exports are off their peak, but container through-put for the biggest Eurasian trade hub has remained very robust, something that would be impossible if total global trade was collapsing.

Start a two-week free trial to Bespoke Premium to see today’s full Morning Lineup report. You’ll receive it in your inbox each morning an hour before the open to get your trading day started.

The Bespoke Report – Break Out the Monocle
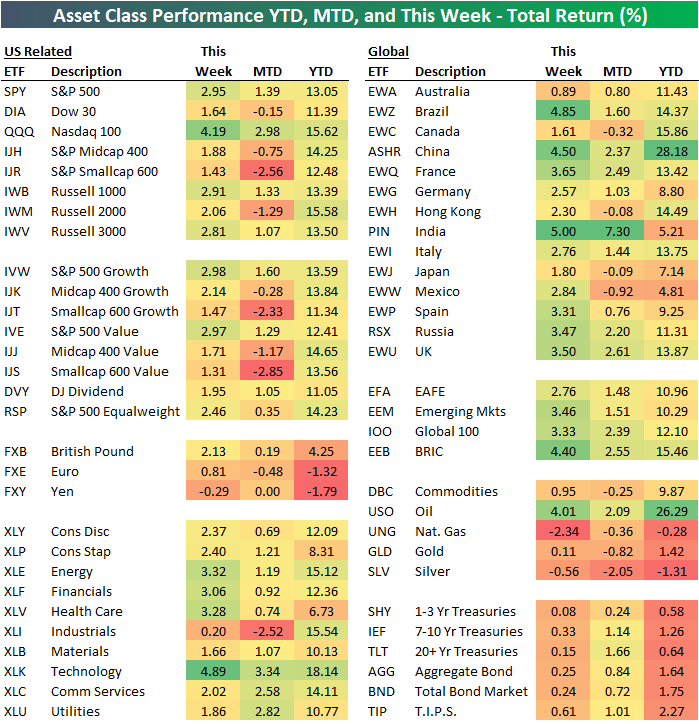
Below is an updated look at our ETF Asset Class Performance Matrix, which shows the total returns of key ETFs across assets classes on both a YTD, MTD basis as well as over the last week. How strong were global equity markets this week? Well of all the equity-related ETFs in the matrix, not a single one finished the week in the red. Even Industrials (XLI), which were dragged down by Boeing (BA), managed to eke out a gain of 0.2%. Among US indices, the Nasdaq 100 blew away the field rallying over 4%, but every other US index ETF was up over 1.4%. International markets were even stronger with India (PIN), Brazil (EWZ), and China (ASHR) all rallying more than 4%. Rounding out the four names from BRIC, Russia (RSX) even rallied 3.5%. In terms of YTD leaders, China and Crude oil are neck and neck for the top spot with gains of 25%+.
Along with a recap of all of this week’s economic data and major market events, we also provide an updated take on our market view. We cover everything you need to know as an investor in this week’s Bespoke Report newsletter. To read the Bespoke Report and access everything else Bespoke’s research platform has to offer, start a two-week free trial to one of our three membership levels. You won’t be disappointed!

The Closer: End of Week Charts — 3/15/19
Looking for deeper insight on global markets and economics? In tonight’s Closer sent to Bespoke clients, we recap weekly price action in major asset classes, update economic surprise index data for major economies, chart the weekly Commitment of Traders report from the CFTC, and provide our normal nightly update on ETF performance, volume and price movers, and the Bespoke Market Timing Model. We also take a look at the trend in various developed market FX markets.

The Closer is one of our most popular reports, and you can sign up for a free trial below to see it!
See tonight’s Closer by starting a two-week free trial to Bespoke Institutional now!
The Most Loved Stocks in the S&P 500
Earlier this week we provided a full update on analyst sentiment across sectors and individual stocks in our Closer report. Below are a few charts and tables that we’ve pulled from the big report in case you’re interested.
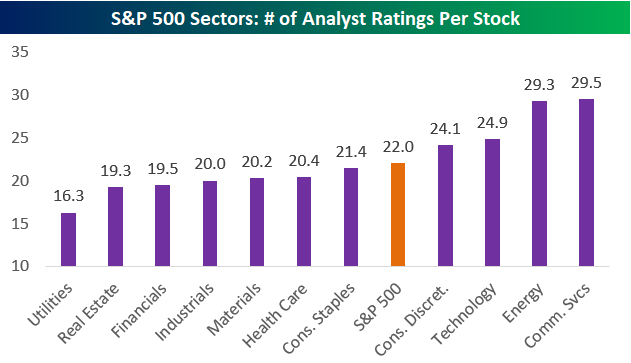
As shown below, there are 22 analyst ratings per stock in the S&P 500 on average. But Energy and Communication Services have more than 29 ratings per stock! It’s hard to find an edge with nearly 30 analysts covering a name.
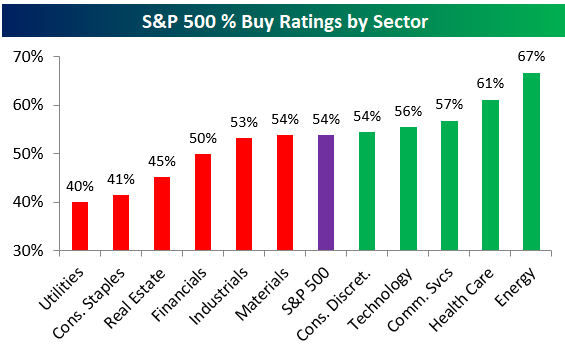
Notably, the Energy sector also has the highest percentage of analyst Buy ratings, which is surprising given that Energy has been the weakest sector of the market since the S&P peaked last September. It looks like analysts think the sell-off for Energy has caused valuations to become more attractive.
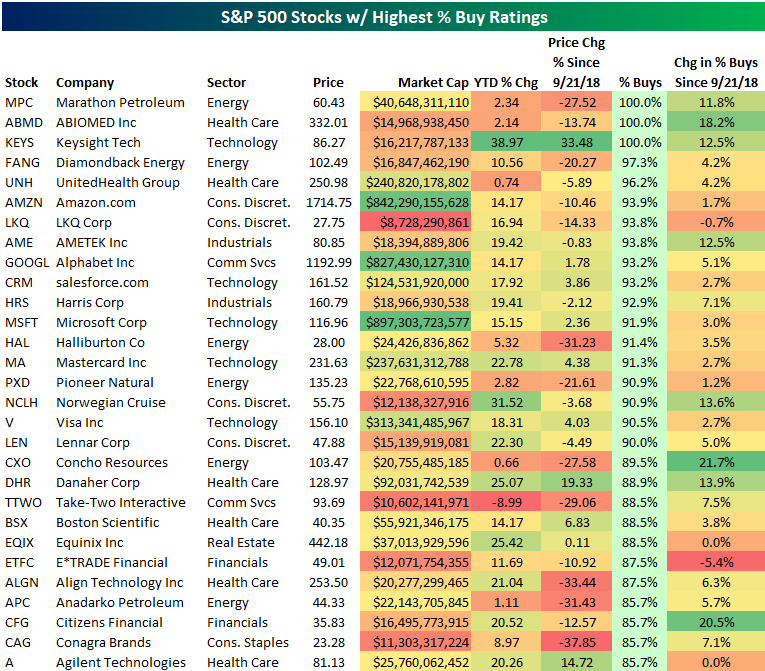
Below is a table listing the S&P 500 stocks with the highest percentage of Buy ratings right now. There are 3 stocks in the index that have 100% Buy ratings — Marathon Petroleum (MPC), ABIOMED (ABMD), and Keysight Tech (KEYS). Both MPC and ABMD are basically flat this year, but KEYS is up 39% YTD. Even after the gains, though, analysts still love KEYS.
Other notables on the list of most loved stocks include mega-caps like Amazon.com (AMZN) with 93.9% Buy ratings, Alphabet (GOOGL) with 93.2% Buy ratings, and Microsoft (MSFT) with 91.9% Buy ratings. Diamondback Energy (FANG) is the most loved Energy sector stock, while AMETEK (AME) is the most loved Industrials stock.
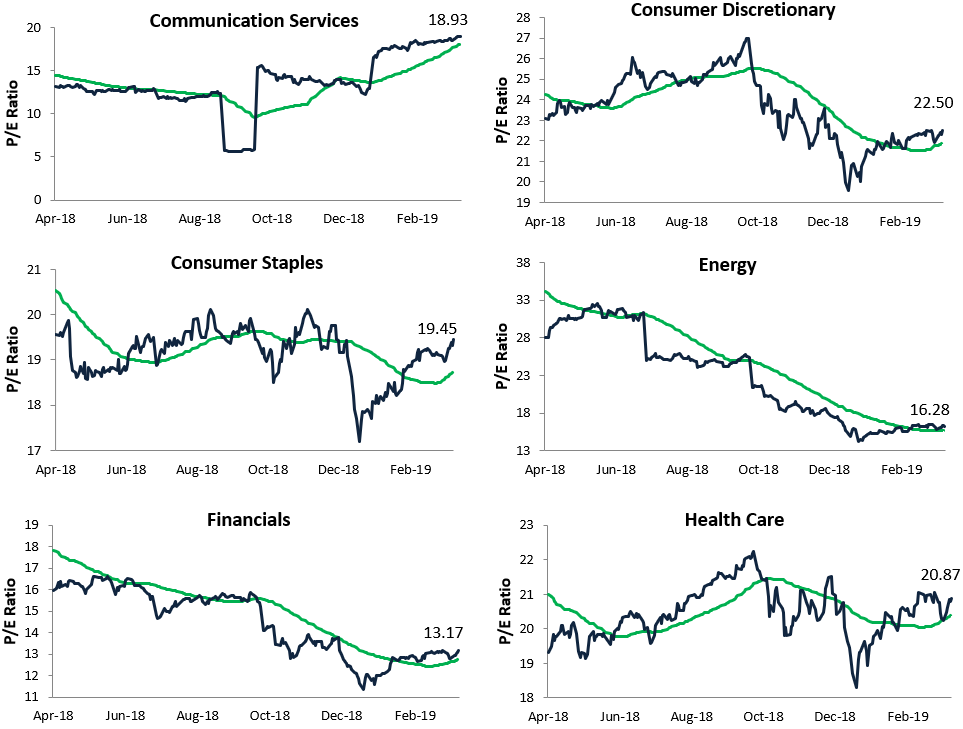
S&P 500 Sector Trailing 12-Month P/E Ratios
The S&P 500’s trailing 12-month P/E ratio got down into the low 15s at the bottom in late December, but we’ve seen huge P/E expansion as the market has rallied back. As of this afternoon, the S&P’s trailing 12-month P/E sits at 18.61. Even still, that’s well below readings in the 20s that were seen for a number of weeks in 2018.

Below we show one-year P/E ratio charts for major S&P 500 sectors. Since the December lows, we’ve seen P/E expansion in every sector, but the one that stands out the most is Utilities.
We went into detail on extended valuations for the Utilities sector in yesterday’s Chart of the Day for members, but you can see the spike up to 19.80 in the one-year chart for Utilities below. At 19.80, only Technology, Health Care, and Consumer Discretionary have higher trailing 12-month P/E ratios than Utilities right now.

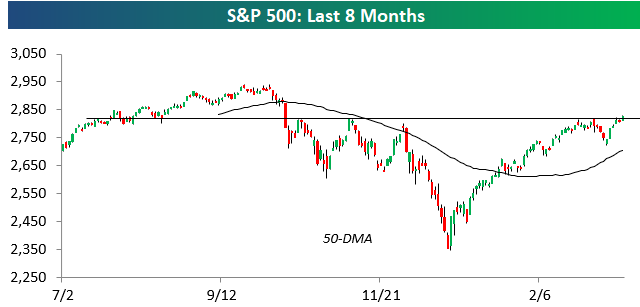
Key Test for S&P 500 Coming Down to the Wire
This morning prior to the open, we noted that the S&P needed to gain roughly 50 basis points today to eclipse key resistance in the 2,815-2,820 range. As of early afternoon trading, the bulls have indeed pushed the index above this resistance level. But with the S&P trending slightly lower so far in afternoon trading, it’s going to come down to the wire. With 90 minutes left in the trading day, the S&P is currently trading at 2,824 — up 55 basis points. Today is certainly a day where investors would like to see last hour strength!
Morning Lineup – Strong End to a Strong Week
Global equities are finishing the week on a positive note and capping off what has been a very strong week. Chinese equities regained their footing after two days of 1% declines, and Europe is up across the board. Will this be the day that the S&P 500 can finally really break out of its range in the low 2,800s?
Please click the link below to read today’s Bespoke Morning Lineup.
Bespoke Morning Lineup – 3/15/19
With equities rallying around the globe, you would think that interest rates would be rising as risk looks to be coming off the sidelines. Not this week. US 10-year yields are on pace to finish the week right where they started, and the yield curve is below 20 basis points for the fourth straight day, which is a streak that hasn’t been seen at all in this cycle.

Start a two-week free trial to Bespoke Premium to see today’s full Morning Lineup report. You’ll receive it in your inbox each morning an hour before the open to get your trading day started.
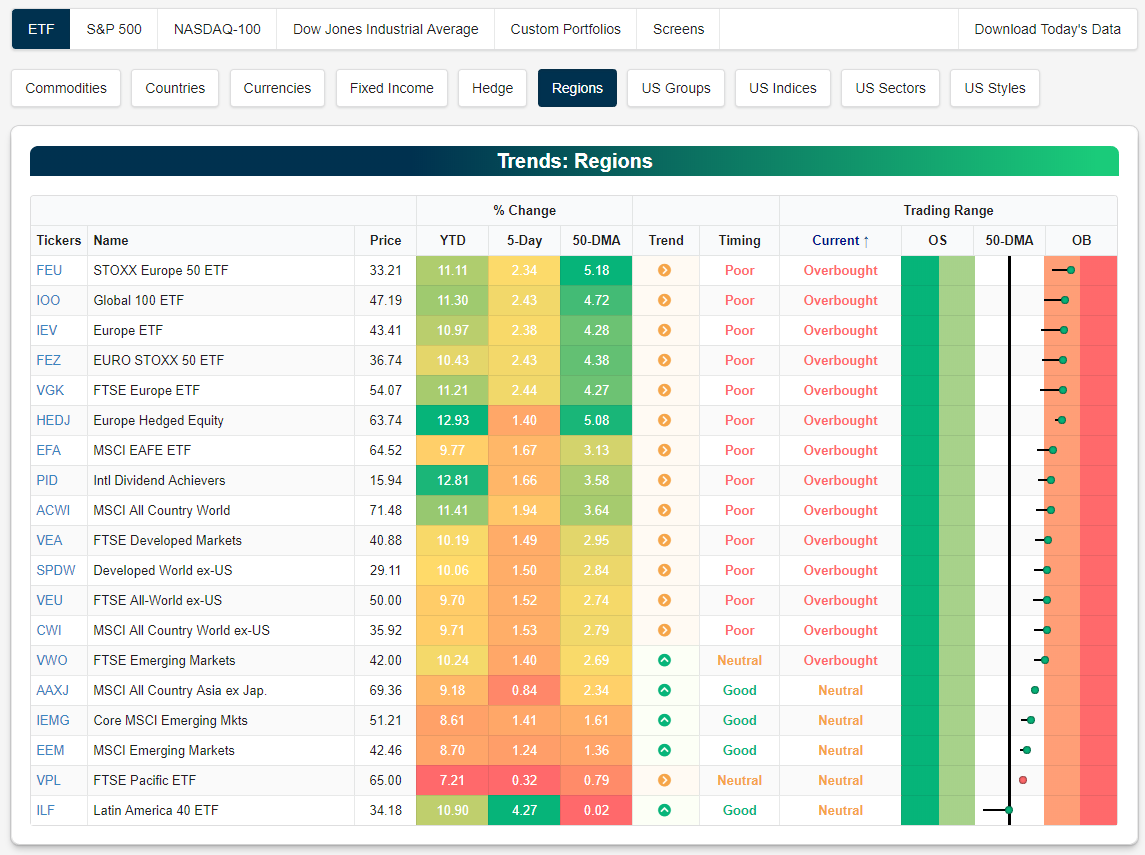
All Regional Equity ETFs Back Above 50-DMAs
Below is a snapshot of regional ETFs from our Trend Analyzer tool. We’re highlighting this snapshot this morning because every single ETF in this group has moved back above its 50-day moving average, indicating broad participation from equity markets around the world.
The Euro STOXX 50 ETF (FEU) is now the most overbought of the group at nearly two standard deviations above its 50-day moving average. The Global 100 ETF (IOO) is second-most overbought, followed by the Europe ETF (IEV).
Note that the snapshot below is pulled directly from the Tools section of our membership area. You can start using all of Bespoke’s helpful trading tools by starting a 2-month free trial to Bespoke Interactive today.