The Closer — Cyclicals Surge, Autos & Industry, Median Pay, Fedspeak — 4/16/19
Log-in here if you’re a member with access to the Closer.
Looking for deeper insight on markets? In tonight’s Closer sent to Bespoke Institutional clients, we take a look into the industries that we consider cyclical which have been outperforming the S&P 500 recently. This could bode well for global manufacturing finding a bottom as well as the durability of the current rally. Of these cyclical industries, we highlight autos, more specifically OEMs and parts retailers, showing how much they make up of the global indices. Turning to macro data, we evaluate today’s industrial production data which saw the March release miss estimates. We also review the quarterly estimate of weekly income for the first quarter, released by the BLS today. We finish with an updated look at our Fedspeak Monitor Index, which has flipped from dovish to hawkish and now is back to dovish once again.

See today’s post-market Closer and everything else Bespoke publishes by starting a 14-day free trial to Bespoke Institutional today!
Gold Breaks
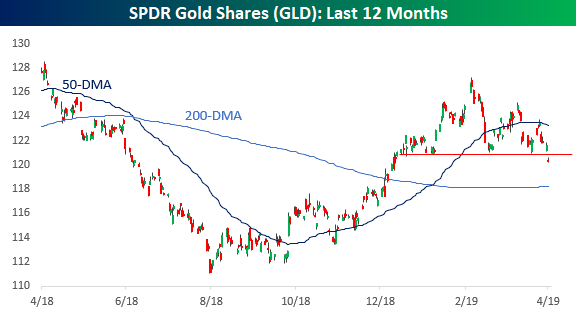
After a strong start to the year, gold has been having a tough time since mid-April, and after breaking support at around the $121 level today, the SPDR Gold Shares ETF (GLD) has done more than a roundtrip since the start of the year. With support at this year’s lows now broken, the technical picture doesn’t appear to be too positive for GLD.
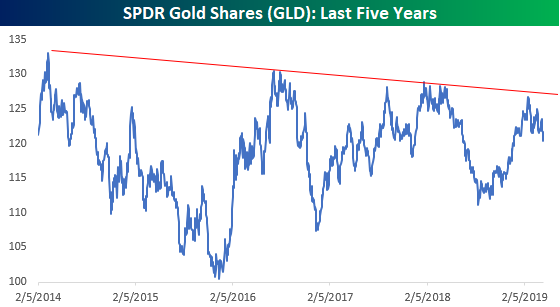
Zooming a bit further out than just the last year, the five year chart for GLD doesn’t look much better. From this vantage point, the rally to kick off 2019 marked just one more in a series of lower highs.
From a ten-year window, GLD is still down sharply from its peak above $180 back in 2011. The encouraging aspect of this chart, though, is that this year’s rally does appear to have broken the downtrend that has been in place since that peak. With that in mind, bulls on GLD could look at this recent pullback as a test and kiss-back of the downtrend line at around the $118 level and therefore is not as big of a negative as the break of support in the first chart would suggest. With GLD trading just above $120 now, that will be a key level to watch going forward. Any break significantly below $118 would spell trouble. Start a two-week free trial to Bespoke Institutional to unlock the full Bespoke interactive research portal.

Bespoke Stock Scores — 4/16/19
Sector Charts – 4/16/19 – Consumer Discretionary
The Consumer Discretionary sector has been on a tear this year with the second best YTD gains (19.75%) behind only the Tech sector. This is a sector that is comprised of many names that are huge everyday brands in the life of the American consumer, so the fact that they are doing well suggests that the consumer remains strong.
Beginning with a quick glance at auto parts retailers, Autozone (AZO), Genuine Parts (GPC), and O’Reilly Automotive (ORLY) have all held onto solid uptrends for the past year, even through the volatility late in 2018. In 2019, the angle of these uptrends has increased considerably, and they have now reached extremely overbought levels with 15%+ YTD gains. AZO has gained even more at 26.99%.
Chipotle (CMG), McDonald’s (MCD), and Yum! Brands (YUM) have also seen similarly solid runs. While MCD has been a bit more volatile given its pullback earlier this year, all three stocks have reached 52-week highs lately. CMG has been truly explosive rising 64.96% this year alone! Even at its current levels, though, the stock has not yet reached extreme overbought levels. Of the three, Yum! Brands (YUM) has perhaps been the most steady in its uptrend over the past year.
The major home improvement stores also boast attractive chart patterns. Home Depot (HD) has yet to reach a 52 week high, but the stock has been in a solid uptrend so far this year and now isn’t far off. Major competitor Lowe’s (LOW) has a near identical chart though seems to be a bit further ahead of HD as it hit a 52-week high on Monday. Tractor Supply’s (TSCO) chart may not look as similar to LOW and HD, but it is yet another name with a solid uptrend over the past year, especially since the start of 2019.
Whereas the highlight of most of the sector is the uptrends, Hasbro (HAS) has been a bit of an outlier with its downtrend. But that downtrend may soon be in the rearview mirror as the stock is attempting to break its string of lower highs. The past few day’s trading has brought the stock well above the downtrend line and the 50-DMA. Since the start of the year, HAS has also not made a new low. The next point of resistance to watch would be the 200-DMA, which put a halt to the rally in February. The charts below were all taken from our Chart Scanner tool, and if you start a two-week free trial to Bespoke Premium now, you will receive instant access to this great tool and much more.
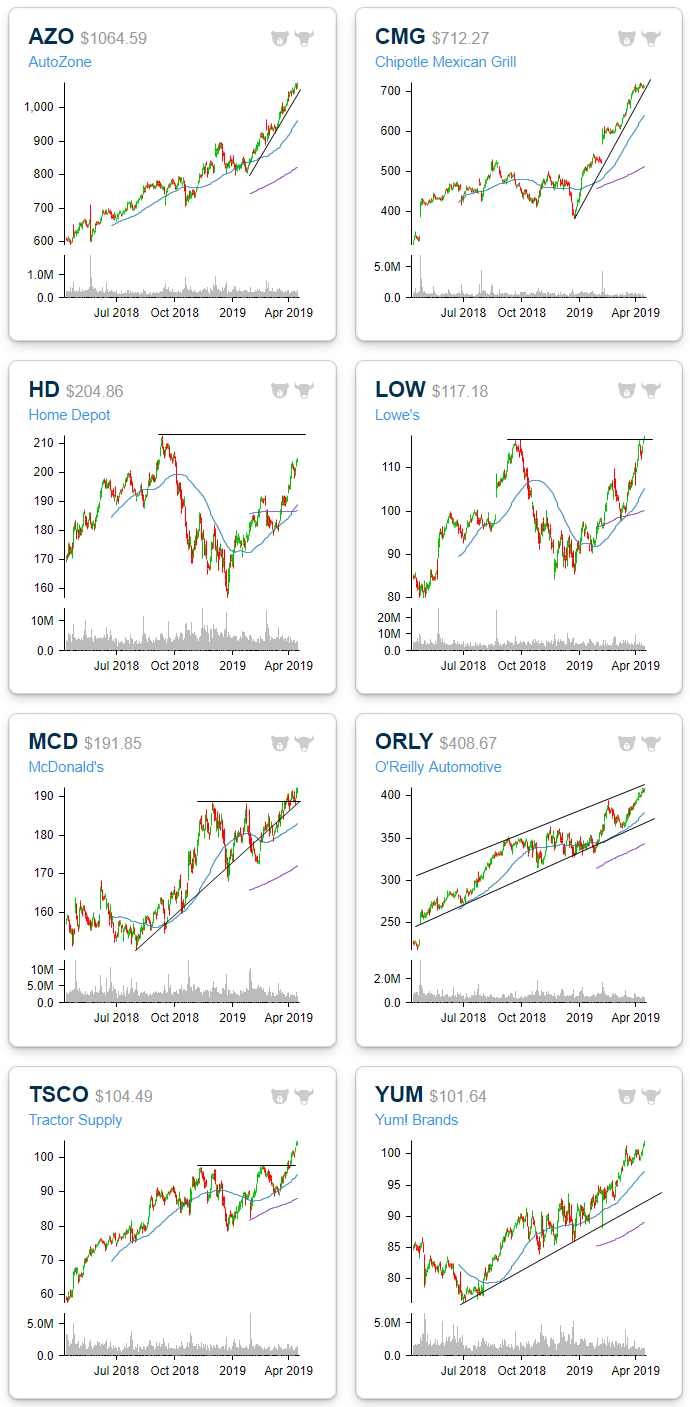
Chart of the Day: Health Care Needs a Compass
Morning Lineup – Earnings Coming in Strong
We said yesterday that the pace of earnings doesn’t pick up until today, and so far so good. Of the ten companies that have reported earnings this morning, nine have exceeded EPS forecasts and one reported results that were inline with expectations. No misses! While the revenue beat rate this morning hasn’t been nearly as strong (60%), it hasn’t been bad either. Those positive results coupled with a big rally in Asia overnight has US futures looking higher and the S&P 500 on pace for a new YTD high with all-time highs not too far away.
We’ve just published today’s Morning Lineup featuring all the news and market indicators you need to know ahead of the trading day. To view the full Morning Lineup, start a two-week free trial to Bespoke Premium.

Here’s a snippet from today’s report:
Equities in China had a good session with the Shanghai Composite rising over 2%, and on a closing basis, this was the highest close since March 2018. Interestingly enough, though, there have been five days since the start of April where the Shanghai Composite traded higher on an intraday basis, so it’s not quite a breakout from its recent consolidation phase.

Start a two-week free trial to Bespoke Premium to see today’s full Morning Lineup report. You’ll receive it in your inbox each morning an hour before the open to get your trading day started.
The Closer — Breadth, Dealers Don’t Buy, Mexican Labor, Canada Surveys, TICS — 4/15/19
Log-in here if you’re a member with access to the Closer.
Looking for deeper insight on markets? In tonight’s Closer sent to Bespoke Institutional clients, we check up on breadth and overbought levels by looking at the percentage of S&P 500 stock reaching new 52 week highs vs lows, distance from the 200-DMA, and RSI. We run the same analysis for the European Stoxx 600. Switching to interest rate markets, we counter concerns that dealer demand has been weak in UST auctions. Pivoting to economic data, we look South and North of the border, examining weakening Mexican labor and secondary industries as well as today’s Bank of Canada quarterly business surveys. We finish with a look at how international investors have turned a cheek to US equities as seen through today’s TIC flows.
See today’s post-market Closer and everything else Bespoke publishes by starting a 14-day free trial to Bespoke Institutional today!
Weak Manufacturing Data in the New York Region
Although the week kicked off with a better than expected Empire Manufacturing report for the month of April, the report itself wasn’t particularly positive. In this morning’s release, the headline General Business Conditions Index came in at a level 10.1 versus last month’s reading of 3.7 and expectations for a reading of 8.0. While General Business conditions improved slightly, expectations declined sharply falling from just under 30 to 12.4.
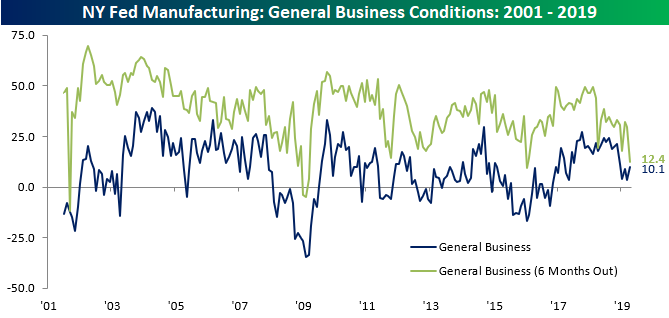
The disparity in sentiment between current conditions and expectations wasn’t just on display in the headline reading either. The table below breaks out the levels of the current conditions and expectations for each of the report’s nine subcomponents. With respect to Current Conditions, five sub-indices saw m/m improvements this month compared to four that saw declines. When it comes to expectations, though, just two components saw m/m increases while six declined.
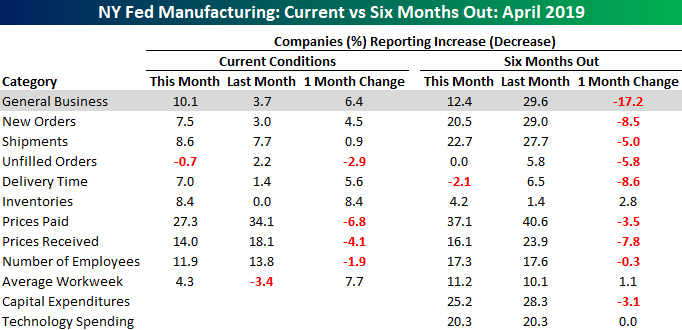
With rising sentiment about the present and falling sentiment looking out six months, we really saw a collapse in the spread between the General Conditions readings for the future and the present. People tend to naturally be more optimistic about the future than the present, but in this month’s survey, the spread between the two indices is practically non-existent. In fact, at the current level of 2.3, there have only been two other months since the report began back in 2001 where the spread was narrower, and there has never been a month where expectations were worse. One aspect of the chart below that we would also point out is that in two of the three prior instances where the spread got close to or below current levels, the economy was either in or on the verge of a recession. The exception was exactly a year ago in April 2018 when the spread fell to 1.40, but the fact that manufacturers are seeing little to no improvement over the next six months doesn’t provide a good starting point for economic activity in the region. Start a two-week free trial to Bespoke Institutional to unlock the full Bespoke interactive research portal.

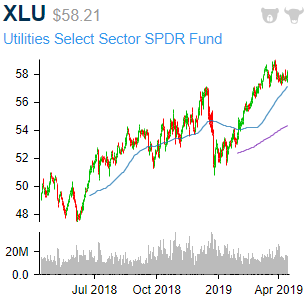
Sector Charts – 4/15/19 – Utilities
So far in 2019, the Utilities sector has underperformed the other sectors with the exception of Health Care. As of now, it is hovering around a 10% YTD gain; several percentage points less than the other sectors, but still very impressive for a defensive sector. As shown in the chart below, the sector reached a 52-week high in late March but has yet to move back up to these levels.
Looking at the individual stocks within the sector, most of the companies have held solid uptrends for the past year. For the most part, the sector’s individual names have very similar chart patterns to XLU, pulling back in solid uptrends and finding support near the 50-DMA. There are a handful of more unique charts though.
Two names in the sector that have made more headlines than any others in the past year have been PG&E (PCG) and Edison International (EIX) given their accountability in the cause of last year’s devastating California wildfires. While risks are still at play, the stocks have found a bottom and have been in an uptrend since late 2018. News out late last week of potential relief of the companies liabilities led the two to surge, bringing them back to interesting levels. EIX has come all the way back up to levels prior to the wildfires and PCG is back into the range from the first major collapse in the stock. While the charts are unarguably messy, the two no longer seem to be the falling knives that they were not long ago.
Others in the sector have also been on solid runs so far in 2019 like Consolidated Edison (ED) and Public Service Enterprise (PEG). More recently, these two have in fact stalled out a bit after getting fairly overbought. But in the case of ED, it is has found strong support near its prior highs. While it has yet to make a strong push back to highs from around this time last month, it is at the upper end of the range the stock has been at in the past three weeks. Additionally, last quarter the stock reported an earnings Triple Play, the only Utilities stock to do so of the 100 most recent Triple Plays. In other words, the underlying company is still strong even if the stock price has taken a breather. Similarly, PEG has traded in a tight range between $58 and $60 since early March. After consistently working its way off the bottom of this range since the start of April, in today’s trading, the stock has finally broken out of this range moving above $60.
While ED and PEG have been sideways, Southern (SO) and Sempra (SRE) are breaking out to new highs in the past few sessions; continuing along in their tremendous uptrends this year. The two are now up 21.02% and 20.95% YTD, respectively. There is only one stock (AES) that has done better in the sector YTD. Both of these stocks’ explosive runs began after they overtook resistance at their 2018 highs. SRE had actually been flat for most of the year in 2018. Both SO and SRE are in fact overbought at current levels, but not to an extreme degree.
Taken from our Chart Scanner tool, we show the charts of these stocks below.

Start a two-week free trial to Bespoke Premium to access our interactive Chart Scanner, Earnings Triple Plays, and much more.
Dogs of the Dow 2019
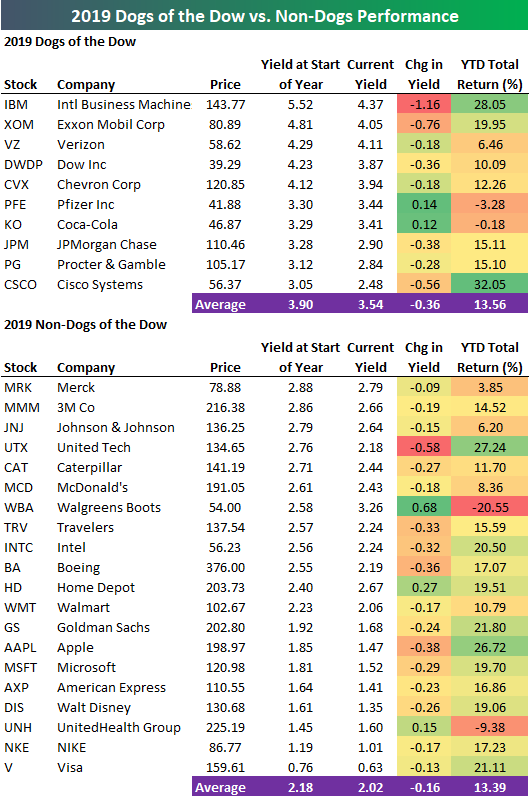
Below is a look at the performance of the Dogs of the Dow strategy so far in 2019. This hands-off, buy-and-hold strategy simply buys the 10 highest yielding Dow Jones Industrial Average stocks at the start of each year.
As shown, the 10 Dogs of the Dow stocks are up 13.56% on a total return basis so far this year. The 20 non-Dogs are up 13.39%, so the performance difference between the two groups is just 17 basis points.
Two Tech stocks that are part of this year’s Dogs are up the most, with IBM up 28.05% and Cisco (CSCO) up 32.05%. IBM started the year yielding 5.52%, but its yield is now down to 4.37% after a significant share price gain. CSCO started the year with a yield of 3.05% that is down to 2.48% as of today.
Only two Dogs are down so far this year. Pfizer (PFE) is down the most at -3.28%, while Coca-Cola (KO) is just barely in the red at -0.18%.
Of the 20 non-Dogs, United Tech (UTX) is up the most at +27.24%, while Apple (AAPL) is up the 2nd most at +26.72%. Walgreens Boots (WBA) — the most recently added Dow member — is down the most at -20.55%. UnitedHealth (UNH) is the only other non-Dog that’s in the red for the year with a decline of 9.38%.
Start a two-week free trial to Bespoke Institutional to unlock the full Bespoke interactive research portal.