The Closer — Iron Ore, PPI, Chinese Buyers Step Up — 5/9/19
Log-in here if you’re a member with access to the Closer.
Looking for deeper insight on markets? In tonight’s Closer sent to Bespoke Institutional clients, we begin with a showcase of the only industrial metal to surge so far this year: iron ore. We go over some events that have acted as a catalyst for the metal. We also take a look at steel prices and what effect that has had on PPI data that was released today. Also in macro data, we review the US Trade Balance highlighting surging Chinese demand.

See today’s post-market Closer and everything else Bespoke publishes by starting a 14-day free trial to Bespoke Institutional today!
Bespoke’s Sector Snapshot — Tech Cools
We’ve just released our weekly Sector Snapshot report (see a sample here) for Bespoke Premium and Bespoke Institutional members. Please log-in here to view the report if you’re already a member. If you’re not yet a subscriber and would like to see the report, please start a two-week free trial to Bespoke Premium now.
In this week’s Sector Snapshot, we note weakening market internals and a much-needed rollover for the Technology sector.
To gain access to the report, please start a two-week free trial to our Bespoke Premium package now. Here’s a breakdown of the products you’ll receive.

Sentiment Not Reflecting Declines
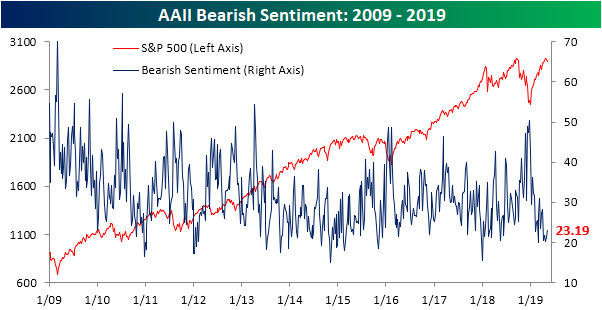
Declines over the past week have been some of the sharpest of 2019, but in spite of this price action, investor sentiment—as measured by the AAII’s weekly investor sentiment survey—has yet to blink. In fact, 43.12% of survey respondents reported bullish sentiment up from 39.02% last week. While still within its normal range by historic standards (within one standard deviation of the historical average of 38.23%), that is the highest degree of bullish sentiment since October 4th of last year, just before the market rolled over. Start a two-week free trial to Bespoke Institutional to access our interactive economic indicators monitor and much more.

Again, counter to what might have been expected, investors have yet to broadly turn more negative on the market as bulls continue to outweigh bears with the bull-bear spread at its widest since late February. But that doesn’t mean bearish sentiment did not pick up at all this week. In fact, it rose to 23.19% from 21.34% last week. This is still well below where it has been for the better portion of the past few years, currently sitting just over 7% below the historical average.
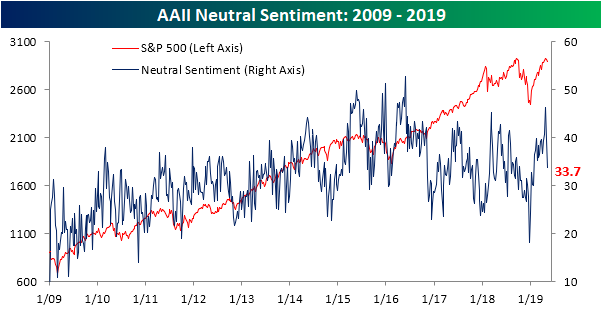
Bulls and bears came entirely from the neutral camp this week as the percentage of investors reporting neutral sentiment continues to collapse, falling to 33.7%. Only two weeks ago neutral sentiment came in at a multi-year high of 46.31%, far above what has historically been observed. That 12.61% drop is the largest two-week decline in neutral sentiment since April 2004 when it fell only slightly more (12.68%) in a two-week span.
A Semi-Serious Decline
One sector that has been hit especially hard this week has been semiconductors. On top of the escalating trade tensions with China of which the sector is highly exposed, weak commentary from Intel (INTC) hasn’t helped. While off its lows of the day, the S&P 500 Semiconductor and Semiconductor Equipment group is still down more than the broader market with a decline of over 1.5% as of the early afternoon. If that weakness holds into the close, it will mark the fourth straight day of 1%+ declines. To put that kind of streak into perspective, since the lows of the financial crisis, there have only been three other four-day stretches where the group showed declines of a similar magnitude and the last time the group had a longer streak was 15 years ago in April 2004! The most recent of the three prior four-day streaks of 1%+ declines was back in August 2015.
As far as the semiconductor group’s price chart is concerned, the picture isn’t any prettier. For now, today’s drop has pushed the sector below its 50-DMA for the first time since January. In the process, the group also sliced right through what was potential support at levels that acted as support in the late summer/ early fall of 2018. Start a two-week free trial to Bespoke Institutional to access our interactive economic indicators monitor and much more.

Initial Jobless Claims Remain Higher
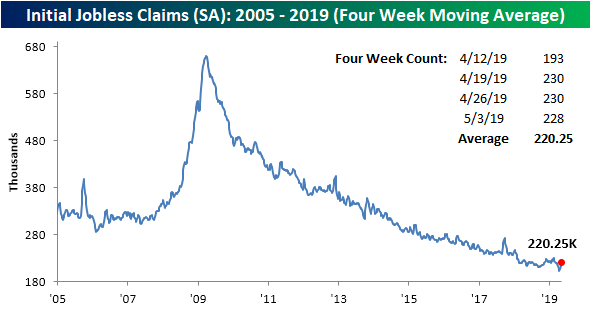
After coming in at 230K two weeks in a row, seasonally adjusted Initial Jobless Claims fell this week down to 228K. While off of the highest level in recent weeks, this small 2K decline leaves claims still near the upper end of where they have recently been. This comes after two straight weeks in early April where the indicator came in at its lowest level in 50 years. Though it has not made new lows, this was the 69th week with claims below 250K and the 218th week below 300K, so claims still appear healthy.
Start a two-week free trial to Bespoke Premium to access our interactive economic indicators monitor and much more.

With the first week of April, when claims came in at a 50-year low of 196K (which has since been revised up to 204K), rolling off of the four-week moving average, the less volatile look at claims has risen to 220.25K from 212.5K last week. This uptick is pretty predictable given the addition of higher readings over the past few weeks. Looking towards next week, it is very plausible that another uptick will be seen as the last of the April lows again rolls off the average. While the moving average has also yet to make a new low since its 50-year lows last month, like the seasonally adjusted number, it still remains at solid levels and is not flashing signs of significant moves higher.
Non-seasonally adjusted (NSA) claims were pretty flat this week with a decline of only 1.3K to 203.5K. While this is still a very healthy reading well below the average for the current week of the year since 2000 (303.5K), there has been one trend in the NSA data to make note of. This week marked the eighth time this year that the NSA number saw a year-over-year increase. That is the highest number of weeks with a YoY increase for a year since 2016 when there were ten throughout the whole year. This week also makes 2019 tied with 2013 for the second highest number of such increases in a year since the crisis. Again, 2013 saw eight over the span of all 52 weeks. Given that it is only May, the last time claims rose as many times by this point in the year was 2009. Fortunately, things are still better than in 2009 as every single week up through the end of October saw a YoY increase that year. In other words, the high frequency of increases versus one year ago in the NSA number, while it could still be much worse, is a bit of a concern as it could be showing last year as a potential bottom for claims. But the fact that deterioration has not been rapid is reassuring.
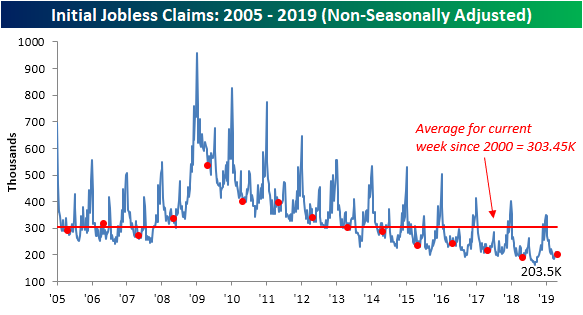
Chart of the Day: Worst Back-To-Back Earnings Ever
The Bespoke 50 Top Growth Stocks
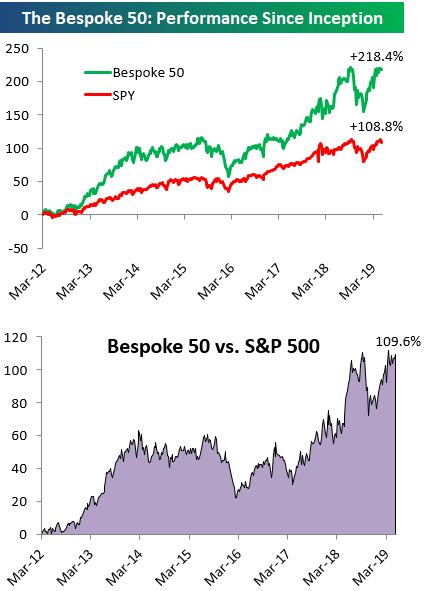
Every Thursday, Bespoke publishes its “Bespoke 50” list of top growth stocks in the Russell 3,000. Our “Bespoke 50” portfolio is made up of the 50 stocks that fit a proprietary growth screen that we created a number of years ago. Since inception in early 2012, the “Bespoke 50” has beaten the S&P 500 by 109.6 percentage points. Through today, the “Bespoke 50” is up 218.4% since inception versus the S&P 500’s gain of 108.8%. Always remember, though, that past performance is no guarantee of future returns.
To view our “Bespoke 50” list of top growth stocks, please start a two-week free trial to either Bespoke Premium or Bespoke Institutional.
B.I.G. Tips — Bullish and Bearish Stock Charts
Morning Lineup – Semi-Concern
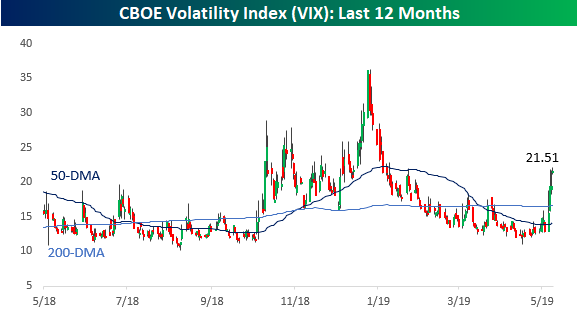
The usual headlines with regards to China are circulating this morning, and there’s more where that came from for the next two days as a Chinese delegation arrives in Washington today. Further complicating things, North Korea launched its second missile test in less than a week overnight which just happened to coincide with a visit from a US envoy to South Korea. Geopolitics are no doubt starting to heat up, and so is the VIX as it poised to close above 20 for the first time since early January!
Outside of geopolitics, there’s also a fair amount of US economic data today after a number of days this week with few or no reports. PPI for April was inline with expectations at the headline level (0.2% m/m) but weaker than expected at the core level (0.1% vs 0.2%). Jobless claims, meanwhile, came in higher than expected at 228K versus estimates for a reading of 220K. On the earnings front, we saw a little bit of a switch this morning as the pace of revenue beats is actually ahead of the pace of EPS beats since yesterday’s close. Of the over 150 companies that have reported since Wednesday’s close, just 56% have exceeded EPS forecasts by 59% have beat top-line forecasts. It would have been preferable to see the switch take place as a result of an improvement in the revenues beat rate rather than a big drop in the EPS beat rate.
We’ve just published today’s Morning Lineup featuring all the news and market indicators you need to know ahead of the trading day. To view the full Morning Lineup, start a two-week free trial to Bespoke Premium.

As shown below, the VIX has seen quite a surge in the last week. Last Friday, it wasn’t even a teenager and today it’s over the legal drinking age. My how they grow up!
Start a two-week free trial to Bespoke Premium to see today’s full Morning Lineup report. You’ll receive it in your inbox each morning an hour before the open to get your trading day started.
The Closer — Price Action, Sector Performance, Carbon Intensity, Fund Flows — 5/8/19
Log-in here if you’re a member with access to the Closer.
Looking for deeper insight on markets? In tonight’s Closer sent to Bespoke Institutional clients, we review the S&P 500’s price action over the past few sessions, highlighting the large amount of buying from open to close. We also take a look at a few cyclical sector’s recent performance versus defensive counterparts. With little in the way of major economic data, we then turn our attention to the relationship between carbon emissions and economic growth. We finish tonight’s report with a look at ICI Fund Flows continued outflows from equities and EIA data showing a large drawdown in crude inventories.
See today’s post-market Closer and everything else Bespoke publishes by starting a 14-day free trial to Bespoke Institutional today!