The Closer: End of Week Charts — 7/12/19
Looking for deeper insight on global markets and economics? In tonight’s Closer sent to Bespoke clients, we recap weekly price action in major asset classes, update economic surprise index data for major economies, chart the weekly Commitment of Traders report from the CFTC, and provide our normal nightly update on ETF performance, volume and price movers, and the Bespoke Market Timing Model. We also take a look at the trend in various developed market FX markets.

The Closer is one of our most popular reports, and you can sign up for a free trial below to see it!
See tonight’s Closer by starting a two-week free trial to Bespoke Institutional now!
B.I.G. Tips – Netflix (NFLX) Price Reaction to Earnings
Earnings Off-Season Stats
Earnings season encompasses a period of roughly six weeks every three months when the large majority of publicly traded companies report their quarterly numbers. The unofficial start to earnings season used to occur when Alcoa (AA) — a former Dow 30 stock — posted its quarterly numbers, as it was always the first big blue chip to report. In 2017, however, Alcoa (after spinning off part of the company) pushed back its quarterly earnings report date by a couple of weeks, so now we consider the unofficial start to earnings season to be when the first of the big Wall Street firms reports each quarter. This quarter, the start to earnings season will be on Monday, July 15th when Citigroup (C) reports. Click here to see our list of the most volatile stocks on earnings.
Wal-Mart’s (WMT) quarterly earnings report marks the unofficial end to earnings season. The Q1 2019 earnings reporting period ended when WMT reported back on May 16th.
Below we wanted to check up on how things went during the most recent earnings offseason. While the number of reports per day drops dramatically during the earnings offseason, there’s still a slow trickle of reports.
Bespoke subscribers have access to our Earnings Explorer tool that keeps investors on top of the important macro and micro trends related to earnings. Users can easily pull up historical quarterly reports for every US stock going back to 2001, and there’s a healthy amount of summary analysis as well. Below is a snapshot of the tool where we have pulled up all of the stocks that have reported since last earnings season ended on May 16th.
A total of 276 companies have reported earnings since May 16th. Sixty-eight percent of these companies reported better than expected EPS numbers, while 62% reported better than expected sales. In terms of guidance, only 8% of companies raised guidance while 13% lowered guidance. This means there was a guidance spread of -5 during the most recent earnings offseason.
In terms of price reaction to earnings, the average stock that has reported since May 16th has fallen 0.56% on its first trading day following its report. This negative price action from individual stocks in response to earnings is a divergence from the S&P 500’s gain of more than 4% during this offseason.
At the bottom of the snapshot, we show the stocks that performed best on their earnings reaction days this offseason. (Users of the tool see an interactive list of all 276 stocks that have reported along with their price action.) As shown, OMN was the best performing stock on earnings this offseason with a one-day gain of 54.36% on July 3rd. CDMO, CIEN, and DY all gained more than 25% on their earnings reaction days as well. If you haven’t used it yet, we urge you to try out our Earnings Explorer now. You can access it with a two-week free trial to Bespoke Institutional.

Earnings Season vs Earnings Off Season
Earnings season is upon us. Historically, we used Alcoa (AA) reporting as the unofficial start of earnings season, but since that company broke into two tickers we’ve switched to the first report among the large money center banks. On Monday, that will be Citi (C). We gauge the report for Wal-Mart (WMT) as the unofficial end of earnings season. Since WMT’s most recent report, the S&P 500 is up about 4.3%. What does that tell us about forthcoming performance during earnings season?
As shown in the chart below, not much. Since 2001, stocks tend to perform best over earnings season when they’re either down modestly or up modestly in the prior off season. Very large or very small off season changes in stock prices tend to lead to the worst earnings season performance, while modest gains or losses in the off season lead to the biggest average gains.
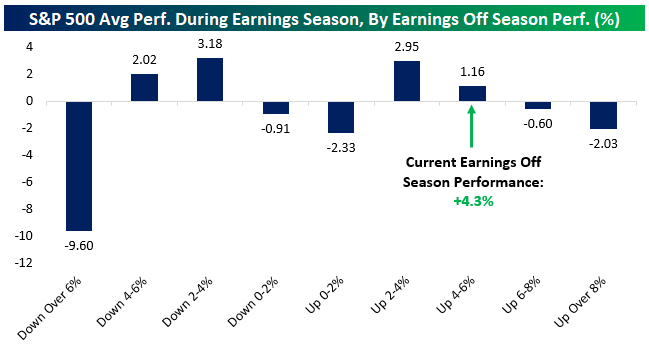
It’s worth saying that if we don’t break up the performance into bins as we do in the chart above, the relationship between off season performance and earnings season performance is almost literally zero. While the 4.3% performance into earnings season this year suggests modest gains across earnings season, the broader data set doesn’t tell us much about where the stock market is set to go over the next six weeks. Start a two-week free trial to Bespoke Institutional for access to our full suite of reports dealing with seasonality, historical performance, and earnings results.

Breakouts to 52-Week Highs
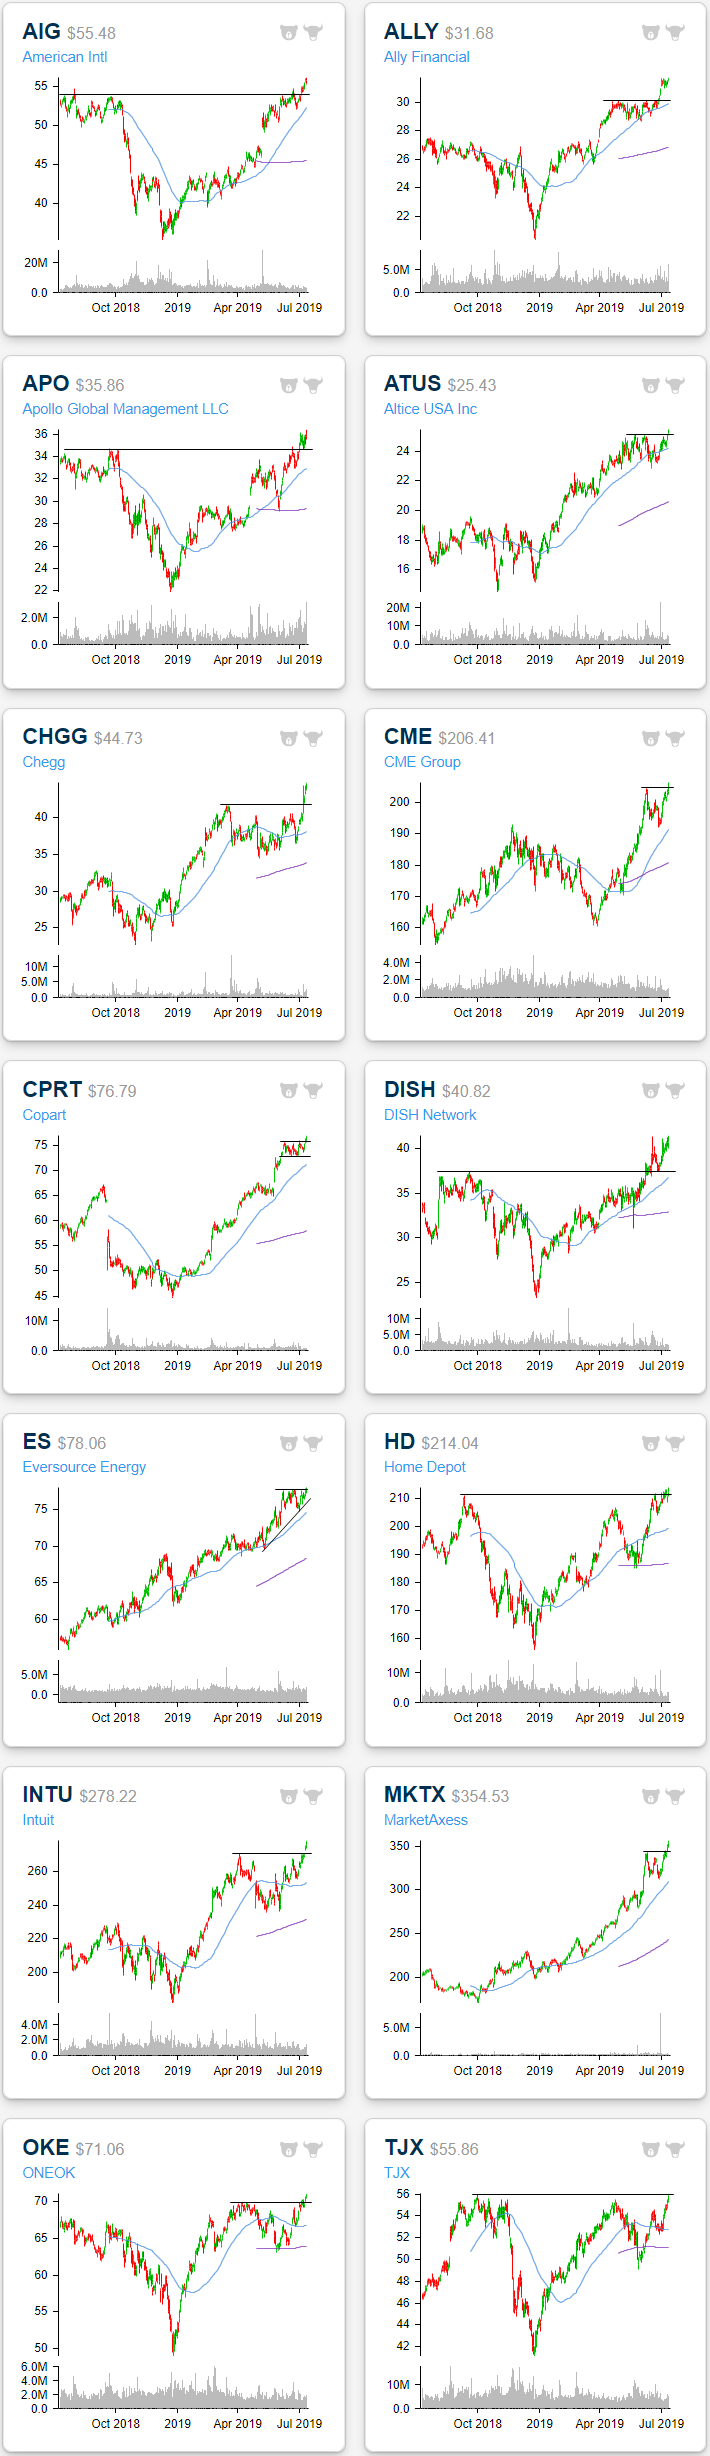
At yesterday’s close, there were 271 stocks and ETFs that made a new 52-week high. We publish a list of new 52-week highs every day in our Chart Scanner tool, and looking through yesterday’s list, just about all of these names have been in strong uptrends in 2019 and are currently sitting at overbought or extremely overbought levels. The run up to 52-week highs for some of these names have come as a result of breaking longer-term resistance of a month up to over a year. Below are a handful of charts of these types of “breakout” stocks.
For some, the recent breakout was above longer-term resistance, as is the case for American International (AIG), Apollo Global Management (APO), and Dish Network (DISH). Two major US retailers, Home Depot (HD) and Target (TGT), also belong to this group. DISH is slightly different than these others in that it broke out above long term resistance a bit further back (in late June), but more recently came back to retest this former resistance as support. After a bounce off of these levels, the stock has rallied to reach another 52-week high.
The breakout for others comes after only a few months of consolidation. This is the case for Ally Financial (ALLY), Altice (ATUS), Chegg (CHGG), Copart (CPRT), and ONEOK (OKE). Similarly, stocks like CME Group (CME), Eversource (ES), Intuit (INTU), and MarketAxess (MKTX) all recently saw pullbacks after getting extended in their 2019 uptrends. Yesterday’s press back to 52-week highs has reconfirmed these uptrends. Start a two-week free trial to Bespoke Institutional to access our interactive Chart Scanner and much more.
Country Stock Markets See Downside Mean Reversion
Yesterday we highlighted the year-to-date performance of stock markets for 75 countries around the world. Below is a snapshot of how 23 of the largest countries have been performing more recently relative to their normal trading ranges. While Brazil (EWZ) is up 6% and the US (SPY) is up slightly over the last 5 trading days, most countries are actually in the red. Given how extended a lot of countries were last week at this time, the action we’ve seen since then can be categorized as simple downside mean reversion.
While nearly all of these country ETFs are above their 50-day moving averages, there are three countries that have moved below — South Korea (EWY), Mexico (EWW), and India (PIN). India has shown the most weakness over the last week with a decline of more than 3%, leaving it 1% below its 50-DMA.
As mentioned earlier, Brazil (EWZ) has seen a huge move higher gaining 6% over the last week. The ETF is now 12% above its 50-day moving average, but remarkably, it’s still not even two standard deviations above its 50-DMA because of the big volatility the ETF typically experiences. Start a two-week free trial to one of Bespoke’s three premium subscription services for in-depth market analysis and actionable ideas on a daily basis.

Bespoke’s Morning Lineup – End of the Nightmare?
Is this the end of the long national nightmare? This morning’s release of the June PPI came in slightly higher than expected on both the headline and core readings, and that has sent US Treasury yields slightly higher moving the yield curve (10-year vs 3-month) out of inverted territory (for now). Just when everyone had written off inflation forever, CPI and PPI both came in higher than expected.
Read today’s Morning Lineup to get caught up on news and stock-specific events ahead of the trading day and a further discussion of overnight events in Asia and Europe.
Bespoke Morning Lineup – 7/12/19

As mentioned above, the yield curve has briefly moved out of inverted territory for the first time in 35 trading days. There’s still an entire trading day left to go, but if this trend holds, it’s the story of the day.

Start a two-week free trial to Bespoke Premium to see today’s full Morning Lineup report. You’ll receive it in your inbox each morning an hour before the open to get your trading day started.
The Closer – Sloppy Auction, Strong Spending, CPI Surge, Receipts Rock – 7/11/19
Log-in here if you’re a member with access to the Closer.
Looking for deeper insight on markets? In tonight’s Closer sent to Bespoke Institutional clients, we go over several factors that played into a brutal day for the bond market leading to a huge bear steepening at the long end of the curve. Namely, one of these factors was a very bad 30-year bond reopening which we look at the internals of. Next, we take a look at the strength of the consumer including the divergence between Bloomberg and other consumer sentiment indicators. After recapping today’s inflation data, we then give an updated look at the federal budget deficit.

See today’s post-market Closer and everything else Bespoke publishes by starting a 14-day free trial to Bespoke Institutional today!
Bespoke’s Sector Snapshot — 7/11/19
2019 Country Stock Market Returns
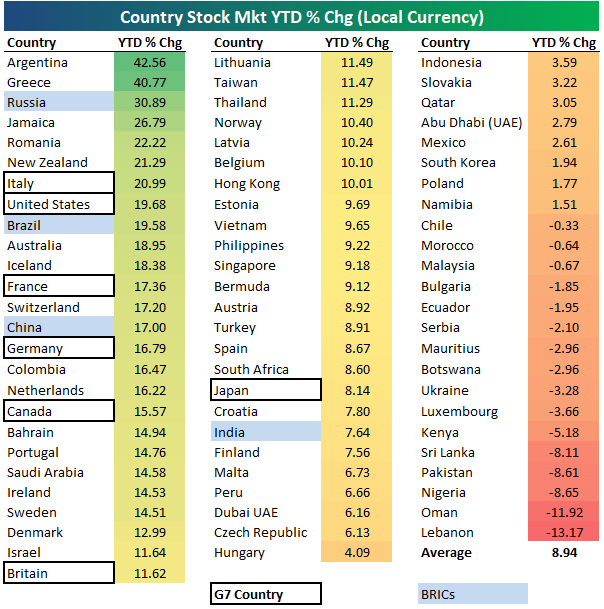
Below is a look at the year-to-date returns (in local currency) of stock markets for 75 countries around the world. The average country has posted a gain of 8.94% year-to-date, and 59 of the 75 countries (79%) are in the green. Argentina and Greece have posted the biggest YTD gains at this point with moves of 40%+. Russia ranks third with a gain of 30.89%, followed by Jamaica (+26.79%), Romania (+22.22%), and New Zealand (21.29%).
The United States has been the 8th biggest winner this year with a gain of 19.68%. Notice that six of the seven G7 countries are roughly in the top third, which means developed countries have been doing very well this year. Japan is the biggest laggard of the G7 countries, but it’s hard to be too disappointed with its YTD gain of 8.14%.
Three of the four BRIC countries rank in the top fourteen, led by Russia at +30.89%. Brazil ranks second of the BRICs with a YTD gain of 19.58%, while China is up 17%. India ranks last of the BRICs at +7.64%.
Lebanon and Oman have been the two worst-performing countries this year with declines of just over 10%. Nigeria, Pakistan, and Sri Lanka are all down more than 8%, while Kenya is down just over 5%. The remaining countries in the red are only down slightly. Start a two-week free trial to one of Bespoke’s three premium subscription services for in-depth market analysis and actionable ideas on a daily basis.