The Closer – Semis, Machinery, Banks Breaking Out, New Home Sales, EIA – 7/24/19
Log-in here if you’re a member with access to the Closer.
Looking for deeper insight on markets? In tonight’s Closer sent to Bespoke Institutional clients, we kick things off with a look at semiconductors as SMH has broken out to a new all-time high. We also look at the movements in the 3m10y yield curve while cyclical machinery and bank stocks begin to breakout. Turning to economic data, we review today’s New Home Sales release. We also show what staffing provider Robert Half’s (RHI) earnings report indicated on the labor market. We finish tonight with our weekly look at ICI fund flows—showing another week of equity outflows—and EIA data showing a massive drop in production.

See today’s post-market Closer and everything else Bespoke publishes by starting a 14-day free trial to Bespoke Institutional today!
Big Day for Triple Plays
Since last night’s close, there have been five triple plays. A triple play is when a company reports quarterly earnings with EPS and sales above analyst estimates and raised guidance. Typically this is a healthy sign for a company’s fundamentals with price reacting accordingly. You can use our Earnings Explorer and 100 Most Recent Triple Plays tools to keep track of recent strong earners.
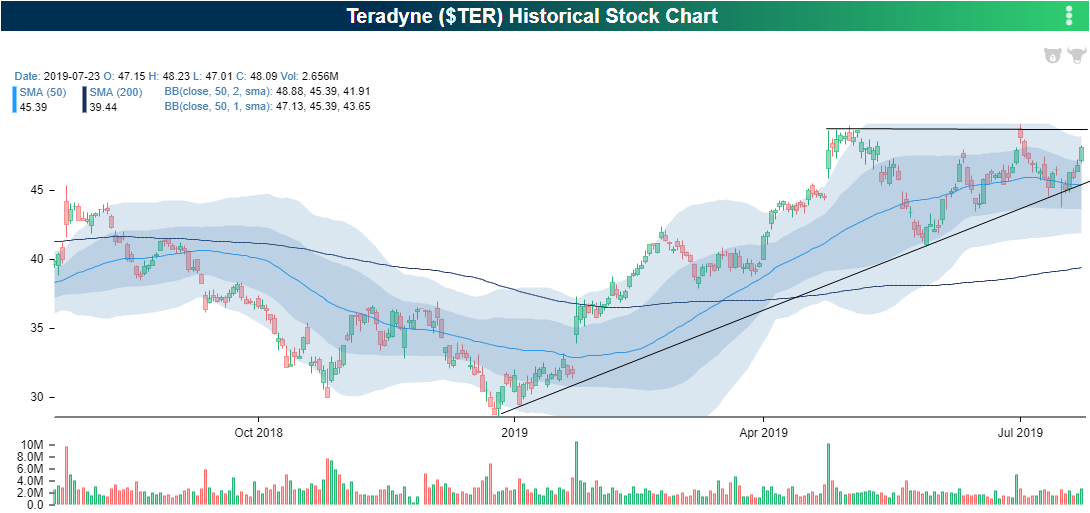
Of the five that reported in the past day, Teradyne (TER) has seen the best response, up over 20% on the day as of this writing. TER has been forming an ascending triangle with this recent move leading to a breakout. TER has also been a strong company on earnings with both EPS and sales beats for every quarter since 2013. Last night’s 4 cent EPS beat and $27.3 mm revenue beat marked the ninth triple play in that time. On average, each of these triple plays was responded to with a 2.8% gain, but today’s performance has left this average in the dust. Additionally, the company commented that the growth of 5G was a key factor in the strong quarter, similar to the first triple plays of this earnings season.
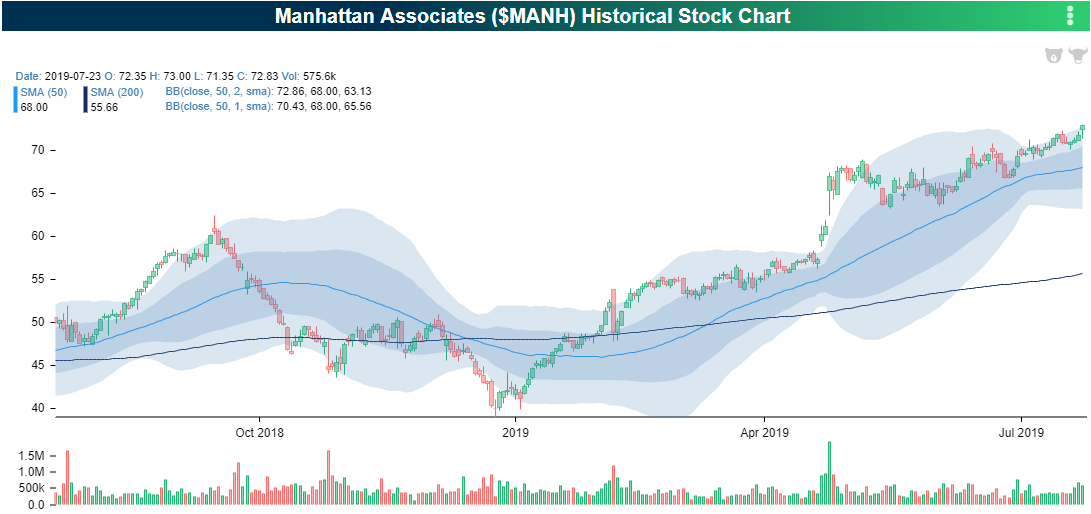
Also out last night, reporting its second straight triple play was Manhattan Associates (MANH). MANH has consistently reported strong quarters with the last EPS miss being back in 2009. Additionally, it is no stranger to triple plays with ten prior occurrences. EPS for the most recent quarter came in at $0.42 versus estimates of $0.35 while revenues were at $154.3 million, $8.3 million above estimates. Ahead of this report, the software and services company reached a 52-week high; also bringing it to extremely overbought levels. In reaction today, the stock has continued to move deeper into overbought territory with a 19% gain.
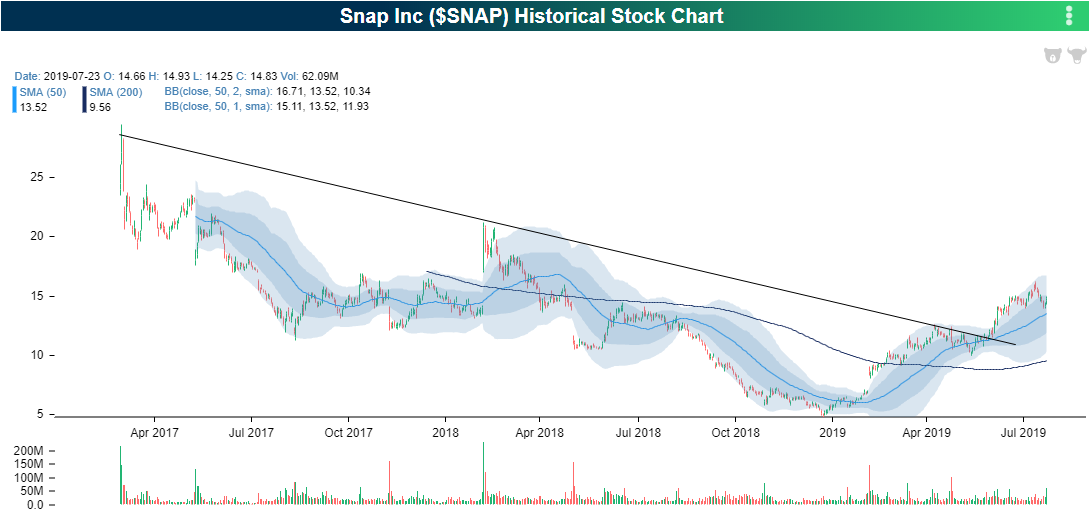
Ahead of Facebook’s (FB) quarter out later today, another social media giant, Snapchat (SNAP), reported last night. Though EPS was still negative (-$0.06), it was also the second smallest loss to date and the second largest revenue per quarter at $388.02 million. SNAP has been in a downtrend since its IPO but earlier this year the stock managed to break out of this downtrend. The 16% gain today has brought the stock further away from this downtrend. Of the ten quarterly reports for SNAP, today is only the third time that the stock has experienced a positive full-day change.
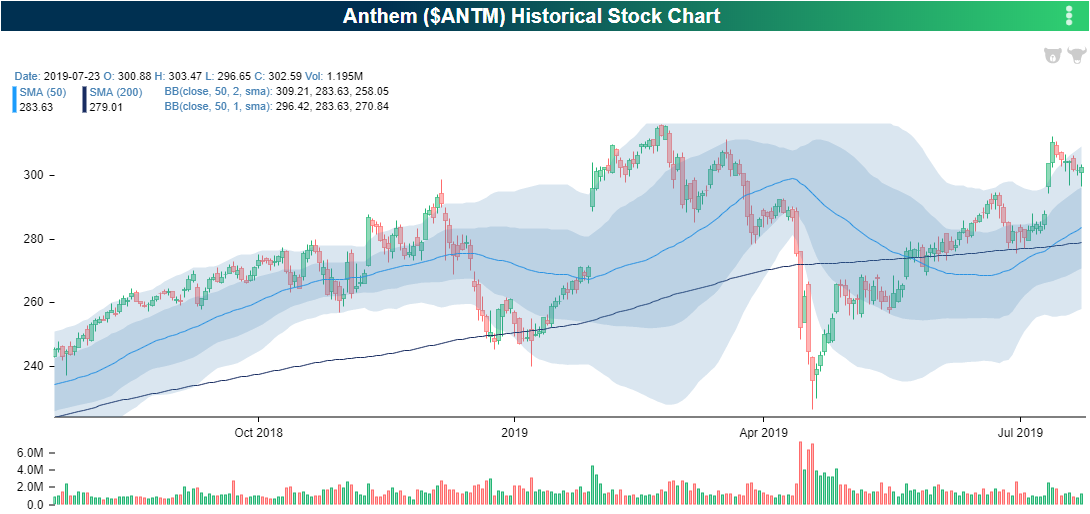
This morning, Anthem (ANTM) also reported a triple play. Its third triple play in a row, ANTM also has not missed EPS since 2016. Perhaps the most impressive streak for ANTM in regards to earnings is in the past seven quarters, the stock has seen a full day gain each time. Despite the triple play today, this streak is looking like it will come to an end. As of this writing, the stock is down 4.18% in today’s trading. Granted, it is also well off of the day’s lows that stopped just short of the 200-DMA. But if the stock was to have seen a positive reaction today, it could have run back up to resistance around the $315 level.
Finally, Teledyne (TDY) saw a solid EPS beat and revenues slightly above estimates. TDY has never missed EPS estimates in its 59 quarter history, although it has only beaten sales 59% of the time. The last two times the stock reported a triple play it saw a full day decline of 1.19% and 0.6%. Today it has bucked this trend with a 5.61% gain. Like MANH, this move higher has brought the stock to elevated levels as it has sat in a steady uptrend this year. Access all of the day’s earnings triple plays with a Bespoke Premium membership. Click here to start a two-week free trial.

Greece 10 Year Yields Fall Below 10 Year UST
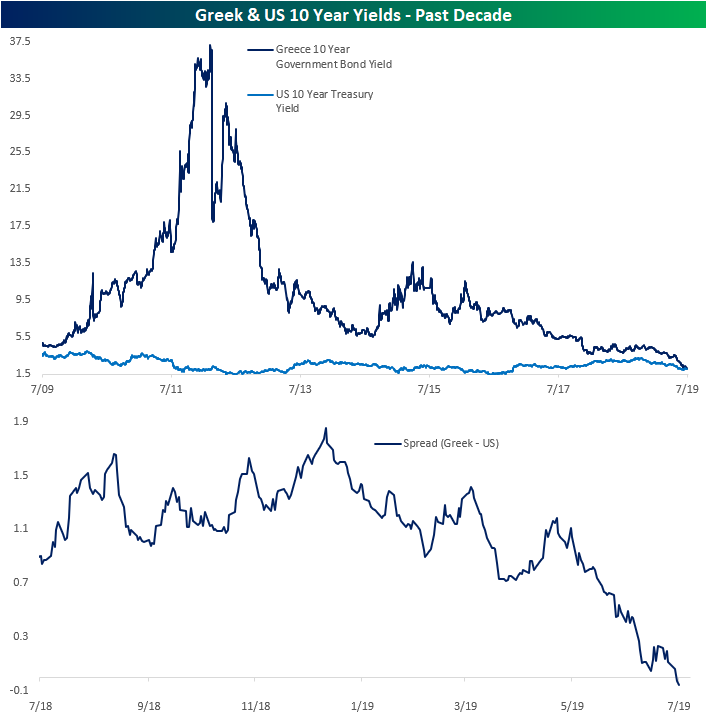
Earlier this month, some headlines noted that Greece’s 10-year government bond yields fell below that of US Treasuries of the same maturity. This came on hopes of ECB easing as well as a victory of the New Democracy party in the most recent election. Today, Greek government bond yields have fallen further to fresh lows with the 10-year yield now a hair under 2% while the US 10 year yields 2.05%. This is the first time since Q4 of 2007 that Greek 10-year debt has had a lower yield than the same maturity in the US. Where they currently stand is a far cry from earlier in the decade when Greek yields surged when the country was dealing with bankruptcy.
But there is one caveat to this comparison. These yields are in local currency. Even though the yields may appear to be relatively similar, controlling for currency differences, Greece’s bond would yield more. If the Greek 10 year (EUR denominated) was swapped to USD it would actually have a much higher yield than the US treasury yield (USD denominated). To be specific, swapping cashflows from EUR to USD shows the Greek 10 year currently yields 4.75% in USD equivalent, more than 250 bps over the 10y UST yield.
The biggest reason for the difference in yields across the two currencies is that the benchmark/policy rates are different. The ECB’s current policy rate is set at -0.4% whereas in the US that rate is significantly higher at 2.4%. Relative to their respective benchmarks, the Greek yield is actually higher, especially compared to other Eurozone countries; some of which even have negative yields at the ten-year maturity. In the table below, we show these rates for the 23 countries in our Global Macro Dashboard also adding in Greece. In other words, while the fact that the lower yield on Greek 10-year debt doesn’t seem to make sense at face value, the comparison in yields is not necessarily like-for-like. Start a two-week free trial to Bespoke Institutional to access our Global Macro Dashboard and much more.

Chart of the Day: Higher Opens, Flat Intraday
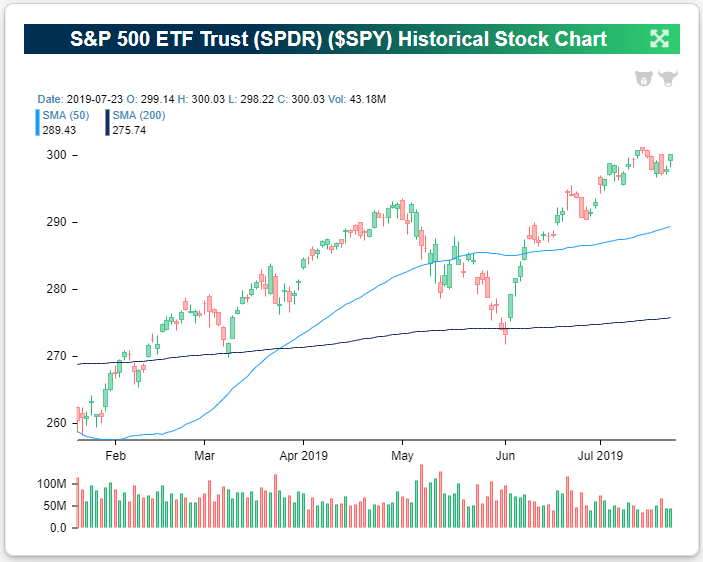
In today’s Chart of the Day, we update a chart we have referenced often over the years. It shows the performance of the S&P 500 ETF (SPY) since it began trading in 1993 broken up by after-hours trading and intraday trading. The after-hours strategy measures the performance of SPY had you brought the ETF at its closing price every day and sold it at the next trading day’s open. The intraday strategy measures the performance of SPY had you bought the ETF at the open every day and sold it at the close that same day.
See whether the after-hours or intraday strategy has performed better by continuing this Chart of the Day by logging in (if you’re already a member) or starting a two-week free trial to any of our research membership levels.
Fixed Income Weekly – 7/24/19
Searching for ways to better understand the fixed income space or looking for actionable ideas in this asset class? Bespoke’s Fixed Income Weekly provides an update on rates and credit every Wednesday. We start off with a fresh piece of analysis driven by what’s in the headlines or driving the market in a given week. We then provide charts of how US Treasury futures and rates are trading, before moving on to a summary of recent fixed income ETF performance, short-term interest rates including money market funds, and a trade idea. We summarize changes and recent developments for a variety of yield curves (UST, bund, Eurodollar, US breakeven inflation and Bespoke’s Global Yield Curve) before finishing with a review of recent UST yield curve changes, spread changes for major credit products and international bonds, and 1 year return profiles for a cross section of the fixed income world.
In this week’s report we review front end inversions around the world that haven’t led to a widening in credit spreads.

Our Fixed Income Weekly helps investors stay on top of fixed income markets and gain new perspective on the developments in interest rates. You can sign up for a Bespoke research trial below to see this week’s report and everything else Bespoke publishes free for the next two weeks!
Click here and start a 14-day free trial to Bespoke Institutional to see our newest Fixed Income Weekly now!
B.I.G. Tips – CAT Sales Continue to Slow
Bespoke’s Global Macro Dashboard — 7/24/19
Bespoke’s Global Macro Dashboard is a high-level summary of 22 major economies from around the world. For each country, we provide charts of local equity market prices, relative performance versus global equities, price to earnings ratios, dividend yields, economic growth, unemployment, retail sales and industrial production growth, inflation, money supply, spot FX performance versus the dollar, policy rate, and ten year local government bond yield interest rates. The report is intended as a tool for both reference and idea generation. It’s clients’ first stop for basic background info on how a given economy is performing, and what issues are driving the narrative for that economy. The dashboard helps you get up to speed on and keep track of the basics for the most important economies around the world, informing starting points for further research and risk management. It’s published weekly every Wednesday at the Bespoke Institutional membership level.
You can access our Global Macro Dashboard by starting a 14-day free trial to Bespoke Institutional now!

Trend Analyzer – 7/24/19 – Micro-Caps (IWC) Enter A Downtrend
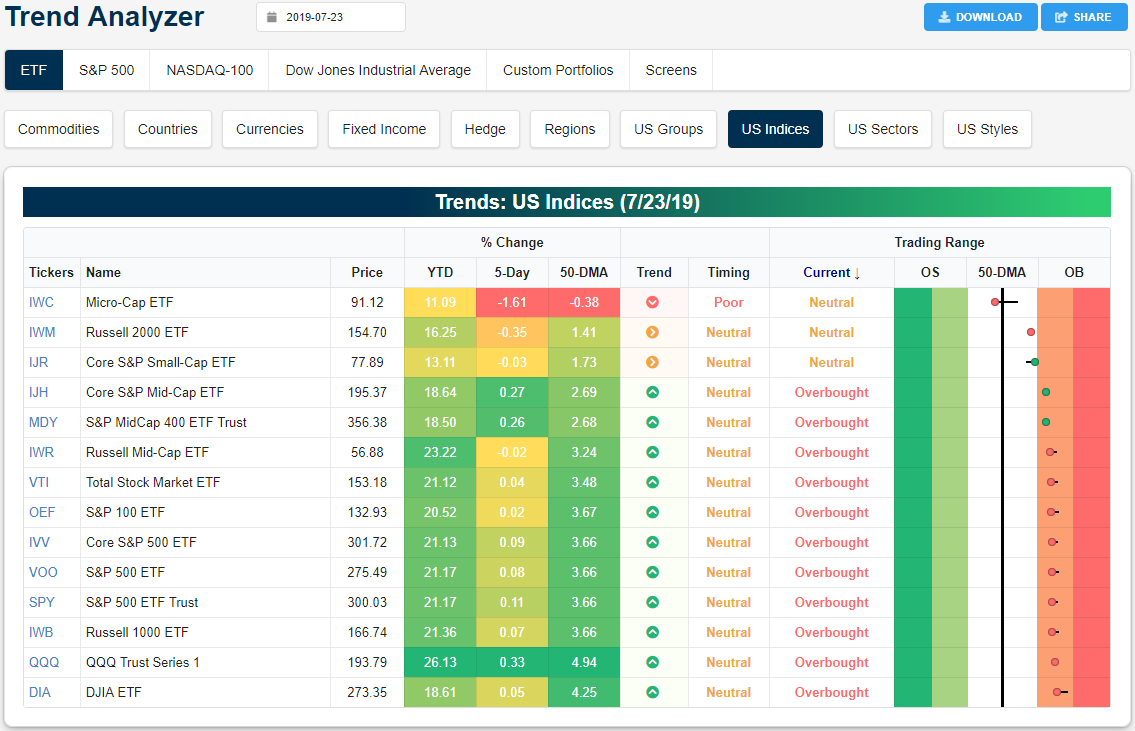
Most of the major index ETFs are relatively unchanged within their recent trading ranges over the last week. Mid-caps have pressed higher on some of the strongest gains over the past week, leading them to rejoin large-caps in overbought territory. Meanwhile, small-caps like the Core S&P Small-Cap (IJR) and Russell 2000 (IWM) continue to lag behind and are still only at neutral levels. While IWM and IJR have not done great, the Micro-Cap (IWC) has lagged by a much larger margin. Now with the smallest YTD gain of the major index ETFs, IWC has dropped through the 50-DMA on a 1.61% decline in the past week. No other major index ETF currently trades below the 50-DMA or has seen nearly as large of a decline, and IWM, IJR, and the Russell Mid-Cap (IWR) are the only others down versus last week. More importantly, our Trend Analyzer is now showing that IWC is in a downtrend.
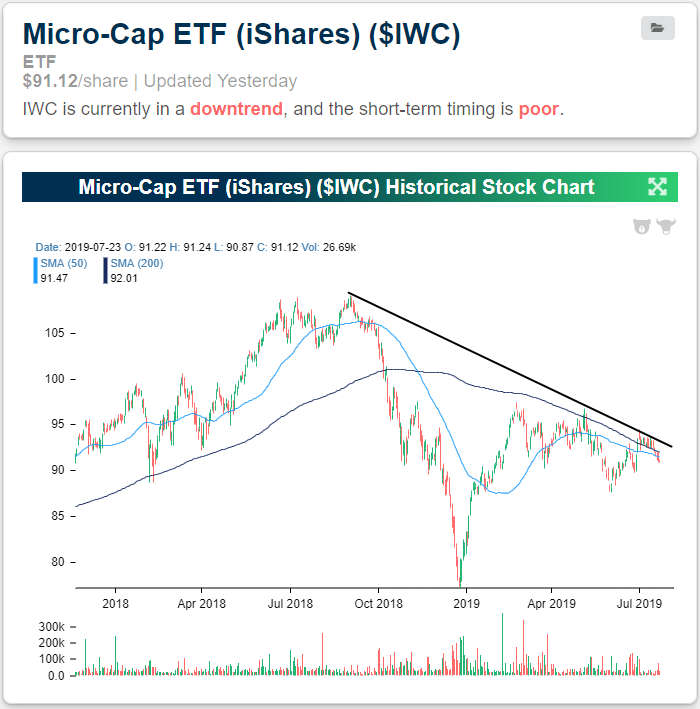
Peering at the chart for IWC, that downtrend has become more apparent. After reaching its highs almost one year ago, IWC fell sharply down to its December lows. After a significant rally in the beginning of the year, it ran into resistance around late 2018 highs and has been stuck in consolidation ever since. Earlier this month, IWC managed to close and hold above the 200-DMA for the longest span of time since last year, but it never made a considerable move higher. In the past two weeks, it has begun to turn lower running into resistance at its downtrend line; reaffirming a longer-term downtrend. Start a two-week free trial to Bespoke Institutional to access our interactive economic indicators monitor and much more.
Bespoke’s Morning Lineup – Mixed Earnings, Weak Europe PMI Data
Earnings results were once again strong in Europe overnight, with reporting companies generally gaining. Weak economic data has stocks trading higher as markets assume it means larger amounts of ECB easing, while this morning’s US earnings numbers are more mixed than we’ve seen lately. The mixed earnings in the US and news after the close yesterday of a DoJ investigation into the large technology companies have futures in the US indicating a moderate decline at the open. Rates are down, commodities are mixed, and credit is green.
Read today’s Morning Lineup to get caught up on news and stock-specific events ahead of the trading day including a discussion of earnings results from the US and Europe overnight and the latest Manufacturing PMI for July. You may want to hold your nose.
Bespoke Morning Lineup – 7/24/19

Start a two-week free trial to Bespoke Premium to see today’s full Morning Lineup report. You’ll receive it in your inbox each morning an hour before the open to get your trading day started.
New 52-Week Closing High for Semiconductor ETF (SMH)
As a leading group for the broad market, it was bullish to see the Semiconductor ETF (SMH) make a new 52-week closing high yesterday. And with Texas Instruments (TXN) expected to open higher by more than 5% this morning following strong earnings after the close yesterday, SMH is looking to trade up another 1% when it opens today. Start a two-week free trial to Bespoke Institutional to access The Closer and the rest of Bespoke’s suite of Institutional products.
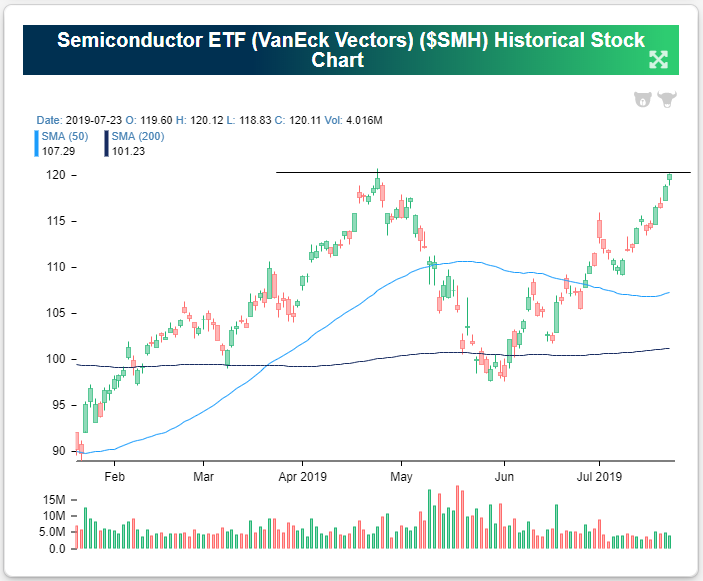
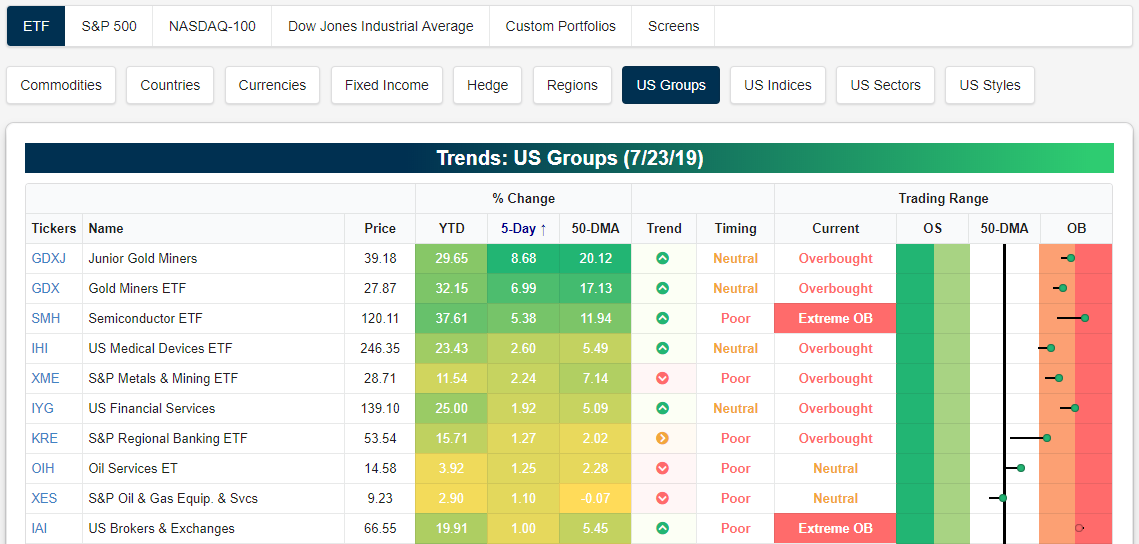
While the gold miner ETFs (GDXJ and GDX) are up the most of any group over the last week, the Semiconductor ETF (SMH) is right on their heels with a 5-day gain of 5.38%. As shown in the snapshot of group ETFs from our Trend Analyzer below, SMH is also trading in extreme overbought territory and is 11.94% above its 50-day moving average. Given that today’s open higher will leave SMH even more extended, we would be careful entering any new longs in the space until some downside mean reversion occurs.
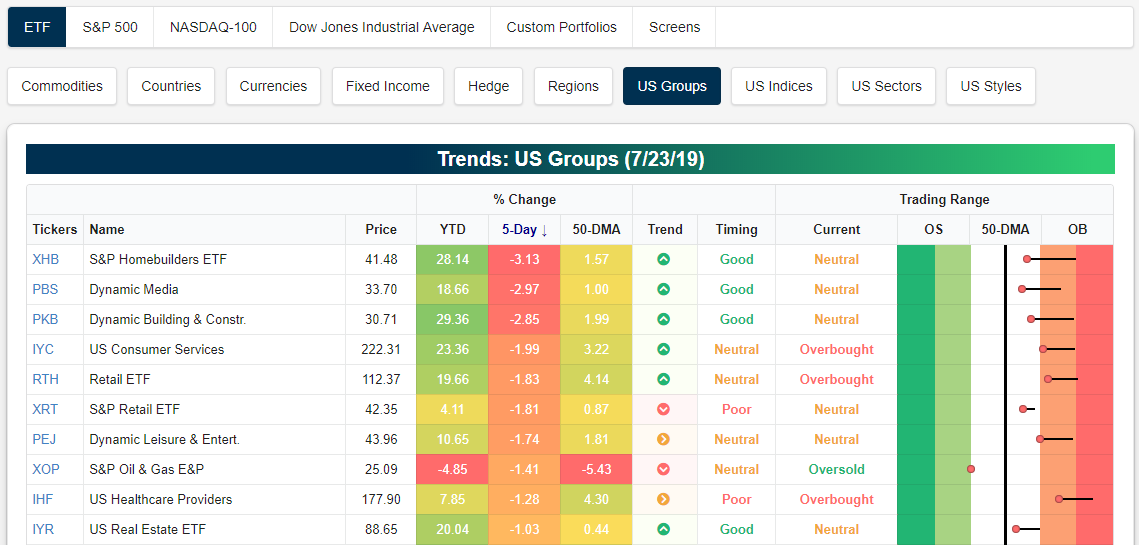
There has definitely been quite a bit of group divergence over the last couple of weeks. As shown below, the homebuilder ETF (XHB) has gotten hit hard over the last week with a decline of 3.13% even though it’s still above its 50-DMA. Media (PBS) and Building and Construction (PKB) ETFs have also fallen more than 2%.
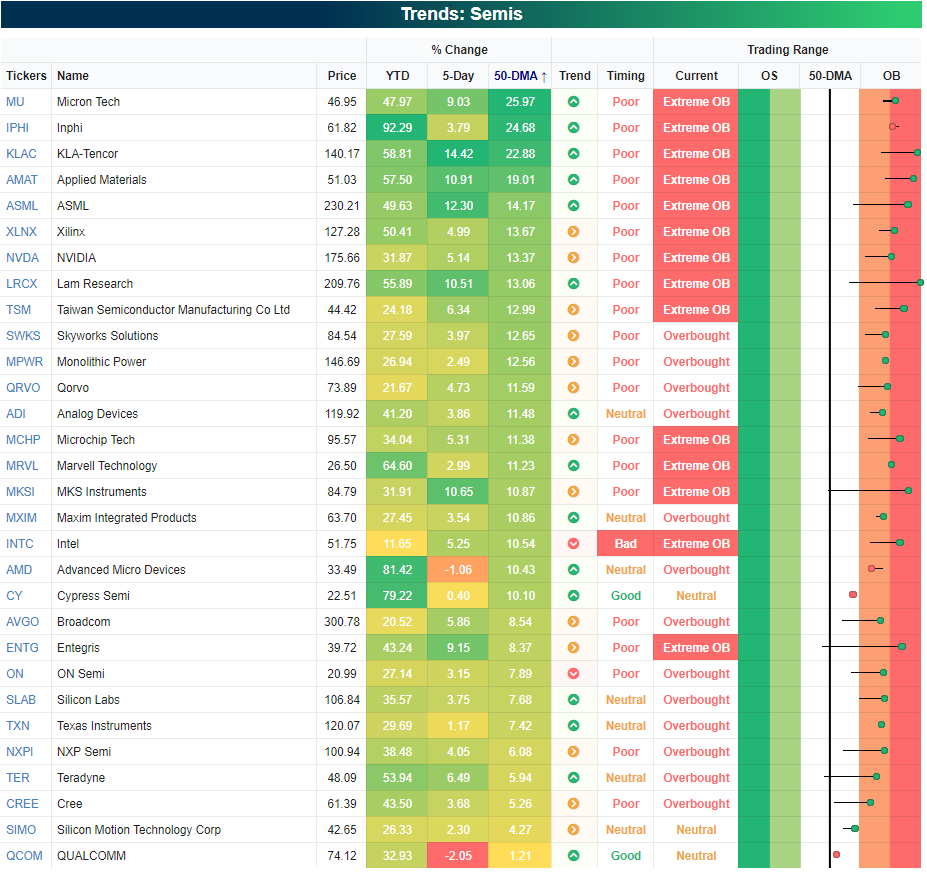
As mentioned earlier, the Semiconductor ETF (SMH) has gotten extended into extreme overbought territory. Below is a look at how extended the individual stocks are that make up the semiconductor group. As shown, all but three stocks in the group are trading overbought, while 14 are in extreme territory (>2 standard deviations above their 50-DMAs). KLA-Tencor (KLAC) and Lam Research (LRCX) are the most overbought at three standard deviations above their 50-DMAs. The least extended semiconductor stock right now is QUALCOMM (QCOM), but even it is still trading 1% above its 50-day. CLICK HERE to view our newest webinar for a full tutorial on how to use our research pages, investment tools, and custom portfolios. If you like what you see, start a two-week free trial to Bespoke Institutional.