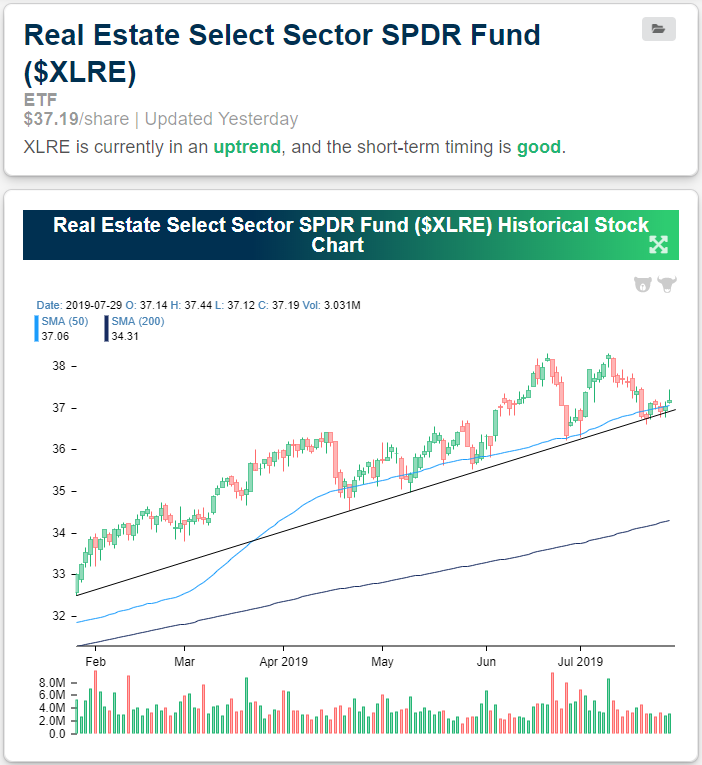
Real Estate Dip
Real Estate (XLRE) has been the second-best performing sector today behind Energy (XLE). While earnings do play a role in these gains, technicals and interest rates have also been a major factor. All year, XLRE has been in a strong and steady uptrend. After getting a bit extended earlier this month, the sector saw some mean reversion back to the 50-DMA which also coincides with the sector’s uptrend line. The 50-DMA has acted as solid support in this year’s run higher with this most recent pullback being no exception.
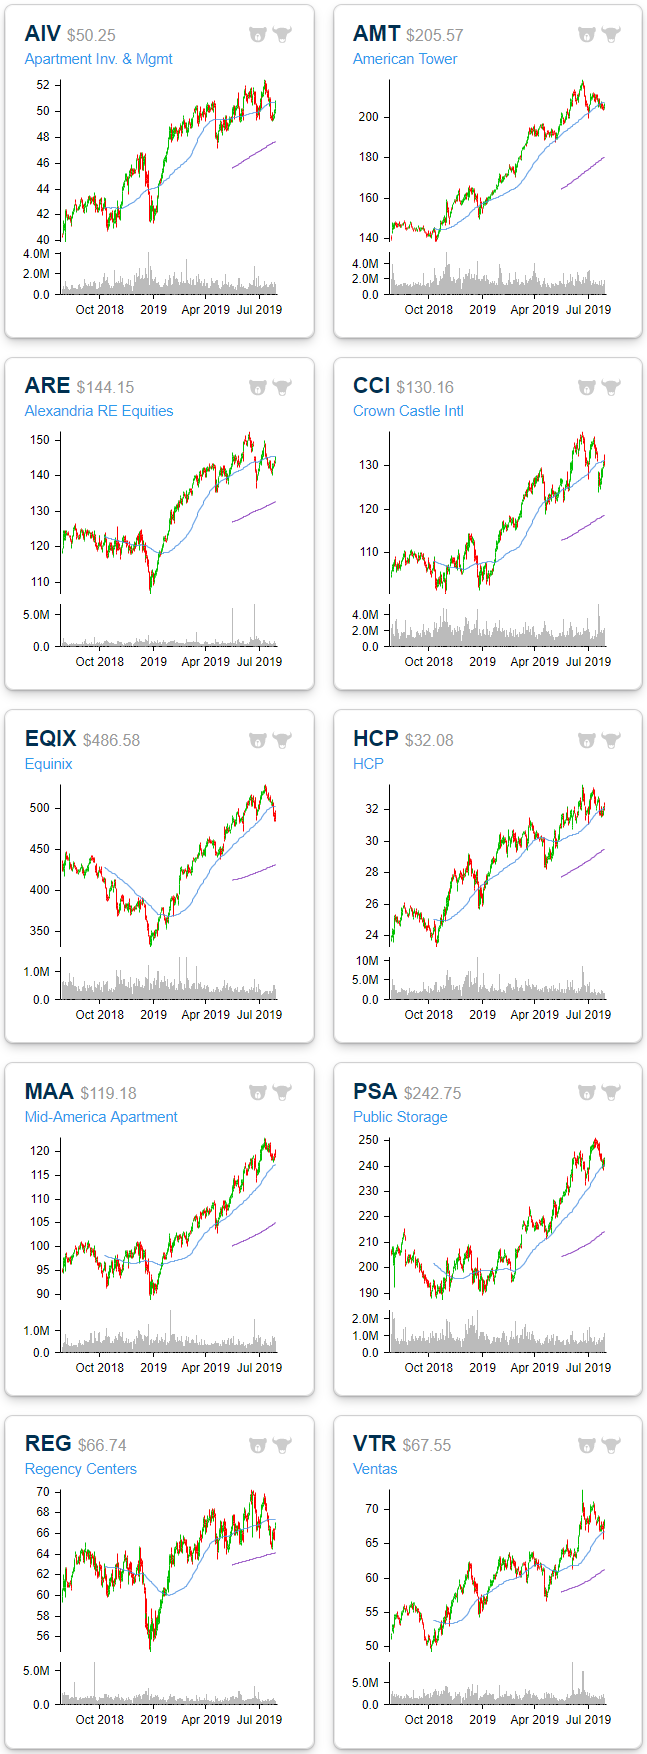
Some of the individual S&P 500 stocks within this sector have similar chart patterns to the broader sector. Below we highlight some of these that are both in uptrends and have good timing scores in our Trend Analyzer. Some like American Tower (AMT), HCP (HCP), and Mid-America Apartment (MAA) have only pulled back to the 50-DMA like the sector ETF (XLRE). But others such as Apartment Inv. & Management (AIV), Equinix (EQIX), and Regency Centers (REG) saw more dramatic mean reversion within their trading ranges. A number of these names are also due to report earnings this week including AIV, AMT, EQIX, HCP, PSA, MAA, and REG, so be aware of that. Start a two-week free trial to Bespoke Institutional to access our interactive Security Analysis tool, Chart Scanner, and much more.
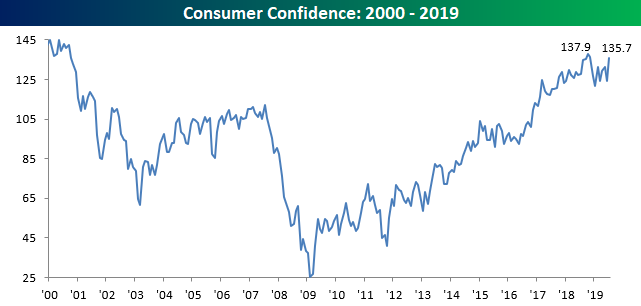
Consumer Confidence: What a Difference a Month Makes!
In the span of just one month, the picture regarding Consumer Confidence has changed immensely. You may recall that in last month’s report, the headline index came in at a 52-week low of 121.5 in what was just the fourth 52-week low for the headline reading since the expansion began. Well, this month the picture changed considerably. Not only was last month’s headline reading revised higher (to 124.3), but the headline reading for July came in MUCH stronger than expected. While economists were forecasting a reading for July of 125.0, the actual reading came in at 135.7, or just slightly more than two points above the cycle high of 137.9 from October 2018. That beat in the actual reading relative to expectations was also the 9th strongest reading relative to expectations in more than 20 years! Our Economic Indicator Database allows users to look at historical economic releases and track how the market reacted to each report. Start a two-week free trial to Bespoke Institutional to try it out now.
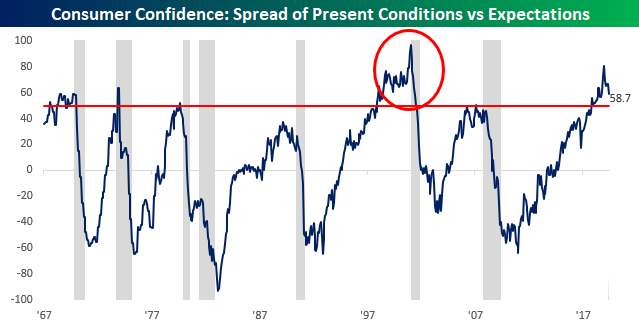
Not only was this month’s headline reading strong, but strength was also divided between Present Conditions and Expectations. What was especially encouraging was the fact that the expectations component saw a much larger gain than current conditions, and that helped to narrow the extremely wide spread between the two.
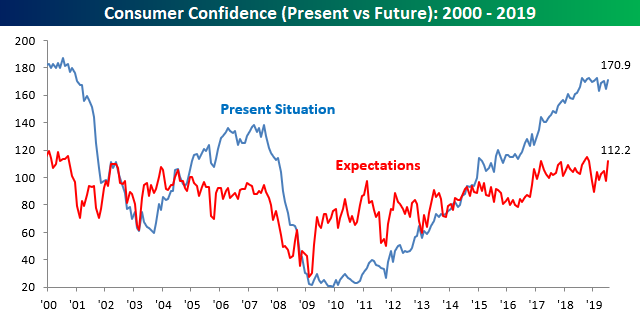
As we have discussed frequently in the past, when the spread between Present Conditions and Expectations gets as wide as it is now and starts to narrow again, it usually means a recession isn’t far behind. One caveat here, though, is that in the past the narrowing of the spread has been due to the Present Conditions index falling faster than the Expectations index. In the current period, the narrowing is occurring due to an increase in the Expectations Index.
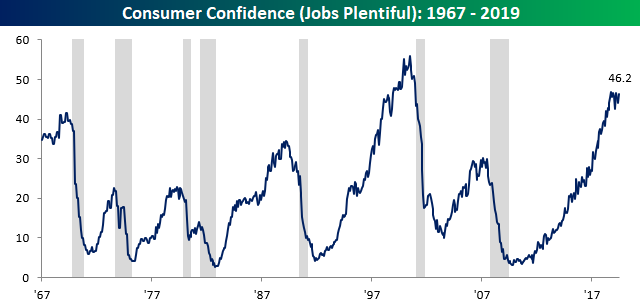
So why are consumers suddenly more confident in expectations? One fact behind the increase is that the jobs market has been strong. Jobless claims remain near cycle lows and as shown in the chart below, the Jobs Plentiful Index in the Consumer Confidence report rebounded to 46.2% this month. While that is not quite a new high for the cycle (46.8), it has rebounded nicely and erased nearly all of its losses from the November 2018 high of 46.8 to the March 2019 low of 42.5. As long as consumers feel that jobs are easy to get, confidence should remain high.
Back to Back Inside Days for Semiconductors
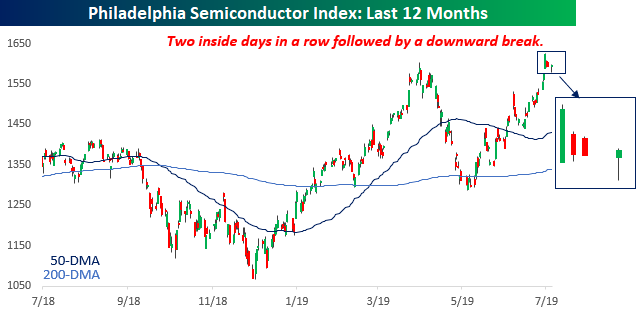
After hitting an all-time high last Wednesday, the Philadelphia Semiconductor Index (SOX) saw a pretty rare occurrence of back to back inside days on Thursday and Friday. For those unfamiliar with the term, an inside day occurs when the intraday daily price range of a security is completely ‘inside’ the range of the prior day i.e., the day’s intraday high is lower than the prior day’s intraday high and the intraday low is higher than the prior day’s intraday low. For more information on the term, you can check out a discussion of it on Investopedia.
In yesterday’s trading, the SOX broke the pattern of inside days as the intraday low was lower than the intraday low from the prior Friday. What was especially noteworthy about last week’s inside days is that they were back to back and followed a day where the SOX traded to a 52-week high. In the entire history of the SOX daying back to 1994, there have only been four other times where there has been a similar setup. According to technicians, an inside day is generally considered to be a pause in a continuation pattern, in that the market typically follows the direction it was moving before the inside day. As most chart-watchers are well aware, however, just because a technical pattern suggests the price of a security will move in one direction doesn’t mean it always does.
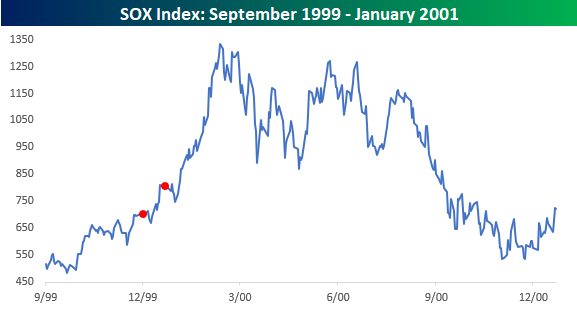
In order to put the technical pattern to the test, in the charts below we have shown each of the prior four occurrences of back to back inside days in the SOX index that followed a day where the index hit a 52-week high. Given that the SOX rallied to a 52-week high before the back to back inside days, technicals would suggest that the SOX would resume its rally following these inside days. Before going any further, though, we would stress that with a sample size of just four, we wouldn’t read too much into the results.
The first two occurrences of back to back inside days following a 52-week high for the SOX occurred within three weeks of each other in December 1999 (12/29/99) and January 2000 (1/19/00). Here you can read into what happened next as both bullish and bearish. For the bulls out there, the SOX rallied more than 60% in the six months that followed the first occurrence and was even up much more than that four months later. From the high in March 2000, though, it was all downhill from there as the dot-com bubble popped and the Nasdaq cratered. One year later, the SOX was lower than it was at the time of each of the first two occurrences by 18% and 11%, respectively.
The next time the SOX saw back to back inside days following a 52-week high was in July 2005, and here the SOX’s performance was just as mixed. After the inside days, the SOX saw a short-term peak shortly thereafter, but it more than rebounded in the six months that followed. Once again, though, a year later, the SOX was 12% lower than it was at the time of the original inside days.

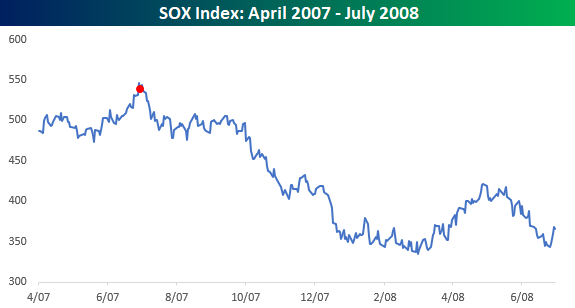
Finally, the most recent occurrence prior to last week’s came in July 2007. In this period, the market never saw a higher closing print than its 52-week high from before the back to back inside days. A week later, the SOX was down 6%, and one year later it was down 33%. In fact, it wasn’t until January 2014, more than six years later, that the SOX ever closed above that level again.
Again, four occurrences isn’t exactly a large sample size, but from a broader picture, we also looked at the performance of the SOX following all back to back inside days and found that its performance was notably better following occurrences where the market was down leading up to them rather than up. That would suggest that for back to back inside days at least, the pattern is more of a reversal than a continuation pattern. Start a two-week free trial to Bespoke Institutional to stay on top of all the latest market trends using our research and investor tools.
Bespoke Stock Scores — 7/30/19
B.I.G. Tips – Big Beat in Consumer Confidence
Chart of the Day: Apple (AAPL) Q2 Earnings
Bespoke’s Morning Lineup – Sweating Out Some Mixed Earnings Data
US futures were up until Europe opened but have since plunged and show the S&P set to gap down 42 bps after Presidential tweets discussing ’problems’ with China. Expectations for the current round of trade talks are low. Earnings are weak in Europe, mixed in the US this morning, and data has generally been weaker than forecast over the last 12 hours of market news.
Continue reading in today’s Morning Lineup.
Bespoke Morning Lineup – 7/30/19

Start a two-week free trial to Bespoke Premium to see today’s full Morning Lineup report. You’ll receive it in your inbox each morning an hour before the open to get your trading day started.
Mid and Small Caps Slowly Catching Up
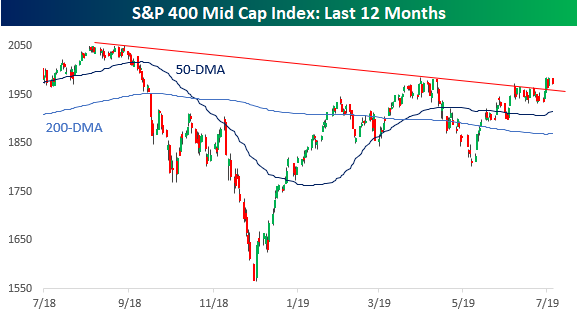
While small and mid-caps have been notable laggards behind large caps, which have hit multiple new highs in the last several days, rather than continuing to drift lower they are showing some signs of playing catch up. While it isn’t even testing new highs or even above its April highs, the S&P 400 Mid Cap Index has managed to break its downtrend in the last few days and is currently less than 4% from its 52-week high. Hey, it’s a start!
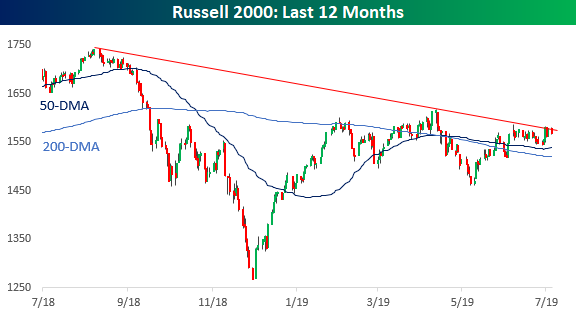
Small caps, however, are another story. The Russell 2000 has been trying over the last few days to break its downtrend but has come up just short. While all it will take is another couple of days to break that downtrend, 52-week, or all-time highs, however, are still a ways off; 10% to be exact. Start a two-week free trial to Bespoke Institutional to stay on top of all the latest trends using our Chart Scanner tool.
The Closer – 7/29/19 – Telecom, 5 Fed Lows, Brexit Woes
Log-in here if you’re a member with access to the Closer.
Looking for deeper insight on markets? In tonight’s Closer sent to Bespoke Institutional clients, we dive into telecoms; taking a look at price action on both a short and longer-term technicals. Next, with the Dallas Fed’s release this morning, we show a complete view of our Five Fed Manufacturing Index. We finish with a look at market reactions to recent Brexit developments including the steep drop in GBP and the underperformance of UK equities.

See today’s post-market Closer and everything else Bespoke publishes by starting a 14-day free trial to Bespoke Institutional today!