Bespoke Market Calendar — August 2019
Please click the image below to view our August 2019 market calendar. This calendar includes the S&P 500’s average percentage change and average intraday chart pattern for each trading day during the upcoming month. It also includes market holidays and options expiration dates plus the dates of key economic indicator releases. Start a two-week free trial to one of Bespoke’s three premium research levels.

Bespoke’s Consumer Pulse Report — August 2019
Bespoke’s Consumer Pulse Report is an analysis of a huge consumer survey that we run each month. Our goal with this survey is to track trends across the economic and financial landscape in the US. Using the results from our proprietary monthly survey, we dissect and analyze all of the data and publish the Consumer Pulse Report, which we sell access to on a subscription basis. Sign up for a 30-day free trial to our Bespoke Consumer Pulse subscription service. With a trial, you’ll get coverage of consumer electronics, social media, streaming media, retail, autos, and much more. The report also has numerous proprietary US economic data points that are extremely timely and useful for investors.
We’ve just released our most recent monthly report to Pulse subscribers, and it’s definitely worth the read if you’re curious about the health of the consumer in the current market environment. Start a 30-day free trial for a full breakdown of all of our proprietary Pulse economic indicators.

Fixed Income Weekly – 7/31/19
Searching for ways to better understand the fixed income space or looking for actionable ideas in this asset class? Bespoke’s Fixed Income Weekly provides an update on rates and credit every Wednesday. We start off with a fresh piece of analysis driven by what’s in the headlines or driving the market in a given week. We then provide charts of how US Treasury futures and rates are trading, before moving on to a summary of recent fixed income ETF performance, short-term interest rates including money market funds, and a trade idea. We summarize changes and recent developments for a variety of yield curves (UST, bund, Eurodollar, US breakeven inflation and Bespoke’s Global Yield Curve) before finishing with a review of recent UST yield curve changes, spread changes for major credit products and international bonds, and 1 year return profiles for a cross section of the fixed income world.
In this week’s report we discuss falling real yields around the world economy.

Our Fixed Income Weekly helps investors stay on top of fixed income markets and gain new perspective on the developments in interest rates. You can sign up for a Bespoke research trial below to see this week’s report and everything else Bespoke publishes free for the next two weeks!
Click here and start a 14-day free trial to Bespoke Institutional to see our newest Fixed Income Weekly now!
Bespoke’s Global Macro Dashboard — 7/31/19
Bespoke’s Global Macro Dashboard is a high-level summary of 22 major economies from around the world. For each country, we provide charts of local equity market prices, relative performance versus global equities, price to earnings ratios, dividend yields, economic growth, unemployment, retail sales and industrial production growth, inflation, money supply, spot FX performance versus the dollar, policy rate, and ten year local government bond yield interest rates. The report is intended as a tool for both reference and idea generation. It’s clients’ first stop for basic background info on how a given economy is performing, and what issues are driving the narrative for that economy. The dashboard helps you get up to speed on and keep track of the basics for the most important economies around the world, informing starting points for further research and risk management. It’s published weekly every Wednesday at the Bespoke Institutional membership level.
You can access our Global Macro Dashboard by starting a 14-day free trial to Bespoke Institutional now!

B.I.G. Tips – Chicago P “U” I
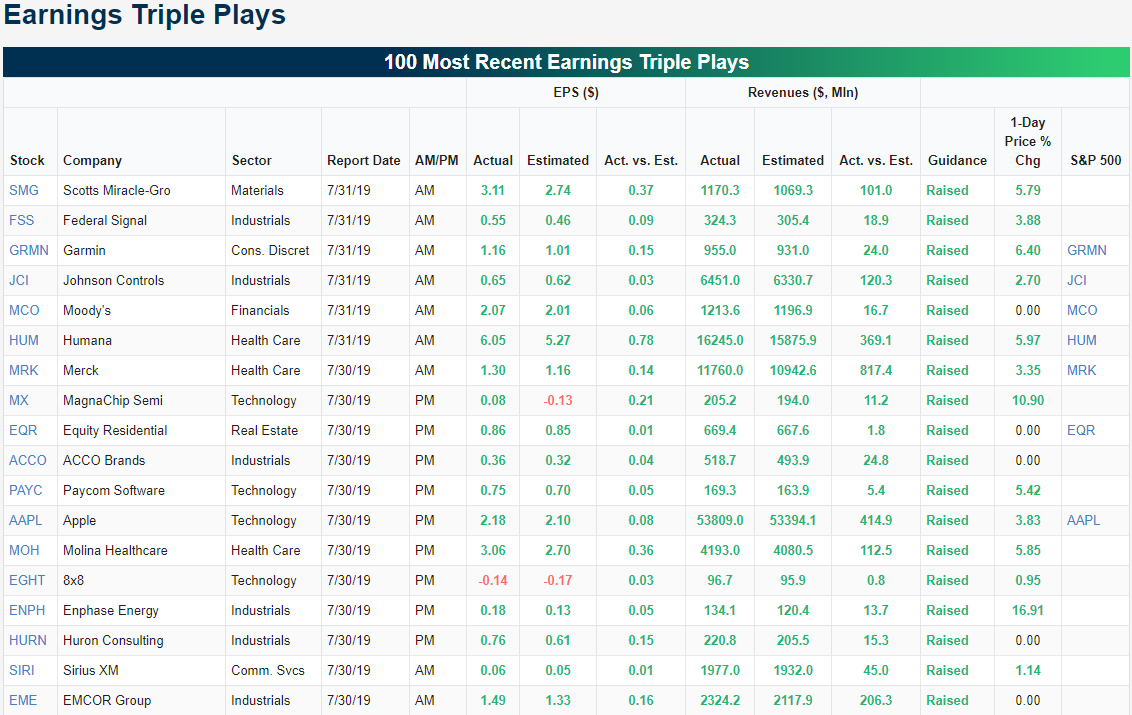
Triple Plays Galore
When a company reports earnings with EPS and sales above analyst estimates while also raising guidance, we label it a triple play. This can be considered a signal of a strong fundamental and growth picture for a company. Now in the heart of earnings season (with tomorrow being the busiest day of reports this quarter), there have been 15 triple plays just since last night’s close. That is the most for any day so far this earnings season. Some notable names that reported triple plays include Apple (AAPL), Humana (HUM), and Paycom (PAYC). Apple (AAPL) has been no stranger to triple plays recently as last night’s report marked its second straight triple play. In the past ten reports (including yesterday’s) it has seen a triple play half the time. Similarly, for Humana (HUM) this quarter marked the third straight year with a triple play on its Q2 report. Paycom (PAYC) also adds onto a long list of triple plays with last night’s report. Since its first report in May of 2014, PAYC has now seen 11 triple plays. Most of these triple plays are trading higher headed into the open with Enphase Energy (ENPH) up the most, over 26%. Start a two-week free trial to Bespoke Institutional to access our Earnings Explorer, Triple Plays Tool, and much more.
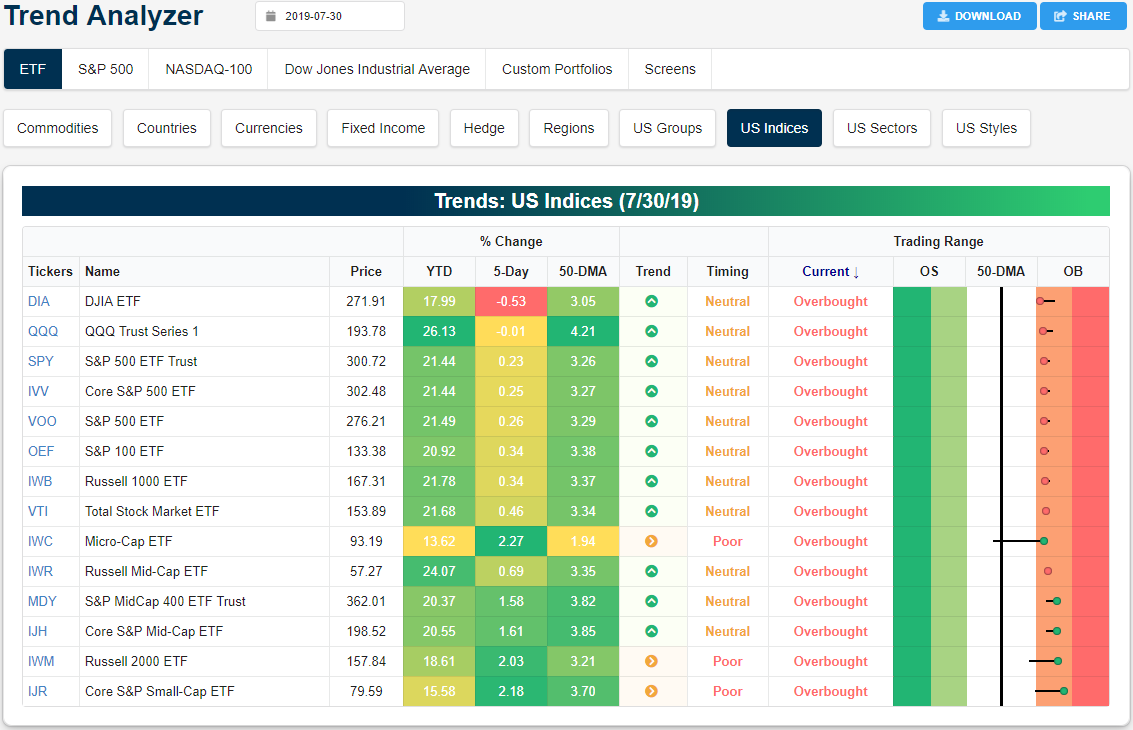
Trend Analyzer – 7/31/19 – Everything Overbought
With yesterday’s gains further adding onto the past week’s surge from below the 50-DMA, the Micro-Cap ETF (IWC) is now overbought for the first time since the first week of May. As IWC makes this move, there is no longer a single major index ETF that is not overbought. We have been making note of small and mid-caps outperformance over the past week, and as the Dow (DIA) and Nasdaq (QQQ) both sit lower over the past five days, this trend has only been exacerbated. In the past week, small caps have risen over 2% while mid-caps have likewise tacked on an over 1.5% gain. This stronger performance has also helped to change the trends of mid-caps to once again show uptrends.
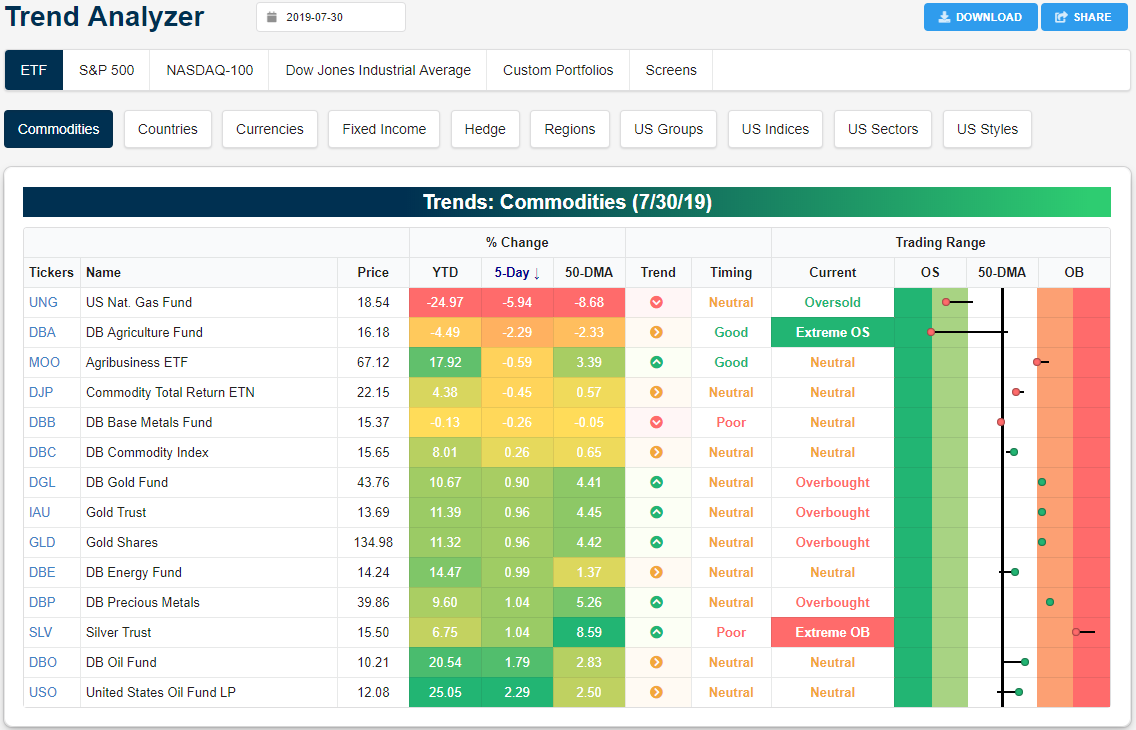
While every major index ETF is now overbought, the trends for commodities are looking a bit different. Natural Gas (UNG) has taken a beating this year, losing almost 25% year-to-date. This week alone it has fallen 5.94% and is now several percentage points below its 50-day moving average. Likewise, while it has been in a long-term downtrend for some time, recent losses have also brought the DB Agriculture Fund (DBA) into extreme oversold territory. Only a week ago DBA was above its 50-DMA. Meanwhile, precious metals remain overbought with solid gains both YTD and over the past five days. After its significant rally in the past weeks, Silver (SLV) in particular has become the most extended as it is currently at extreme overbought levels. But it has also been moving lower within this trading range. The best performing commodity in the past week has been oil. The DB Oil Fund (DBO) and US Oil Fund LP (USO) have both outperformed with gains of 1.79% and 2.29%, respectively. One week ago, these two ETFs were only at their50-DMA so these gains over the past week have not yet brought them into overbought territory. Start a two-week free trial to Bespoke Institutional to access our interactive Trend Analyzer and much more.
Bespoke’s Morning Lineup — Apple (AAPL) Triple Play; Fed on Tap
US futures are slightly higher this morning, and the gains are being led by Apple (AAPL), which is set to gap up more than 4% following earnings last night. For Apple (AAPL), it was the company’s 4th Q2 earnings triple play in a row, meaning the company has beaten EPS estimates, beaten sales estimates, and raised guidance on its Q2 report for four consecutive years. If the stock opens where it’s trading now, it will be the 4th year in a row that AAPL has gapped higher by 4%+ on Q2 earnings as well.
We’ve got in-depth coverage of every important earnings report since yesterday’s close in today’s Morning Lineup. We also cover all of the economic indicators worth watching and provide commentary of all that’s moving and shaking across the globe. Our Morning Lineup is a must-read every day if you’re a serious investor, so if you don’t currently have access, start a two-week free trial to Bespoke Premium. You’ll get the Morning Lineup in your inbox daily with a Bespoke Premium membership plus much, much more.

The Closer – Real Yields Low, Equity Internals, Income & Spending, Case-Shiller – 7/30/19
Log-in here if you’re a member with access to the Closer.
Looking for deeper insight on markets? In tonight’s Closer sent to Bespoke Institutional clients, we begin with a look at just how low real yields have gotten around the world and the divergence between the relative performance of Industrials versus Utilities and the 10-year yield. We then dive into today’s release of personal income and spending data. We also review some other minor releases like pending home sales and consumer confidence. We finish with a look at recent trends in home prices.

See today’s post-market Closer and everything else Bespoke publishes by starting a 14-day free trial to Bespoke Institutional today!
B.I.G. Tips – Fed Days July 2019
You may not realize it, but it has been 3,878 days (10.5+ years) since the FOMC last cut rates. As shown below, this is the second longest streak on record behind the 4,115 days that passed between cuts in the Discount Rate back in 1954.

We just published a B.I.G. Tips report for Premium research subscribers looking at the S&P 500’s performance in the weeks and months following rate cuts after long periods without one. In the report, we also look at how the S&P 500 typically performs on Fed Days specifically and which sectors typically do best and worst.
To read this report, start a two-week free trial to Bespoke Premium!