President Takes Matters into His Own Hands
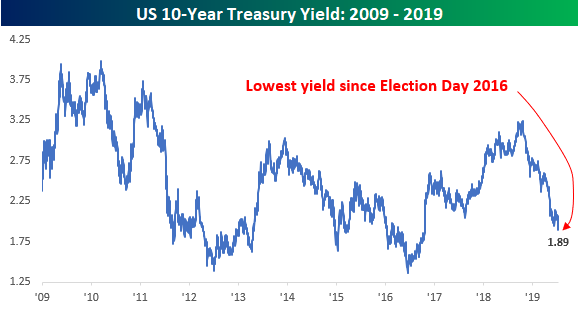
The President has been frustrated with the Federal Reserve’s prior rate hikes and now the lack of a more substantial cut in rates. Just the other day, Trump was quoted as saying, “Obama had zero interest rates, we have ‘normalized’ rates. While the Fed hasn’t helped the President’s cause, he has seemingly taken matters into his own hands with his policy towards China. Each time he ratchets up the rhetoric against China, it tends to put additional downward pressure on interest rates, and following Thursday’s tweets, the yield on the 10-year plummetted below 1.9%.
Ironically enough, the last time the 10-year yield was this low was on Election Day 2016. While short-term borrowing costs are up as the FOMC has hiked rates during Trump’s time in office, the yield on the 10-year isn’t much different. Under the eight years of President Obama, the yield on the 10-year averaged 2.47%, while under Trump the average yield has been 2.57%.
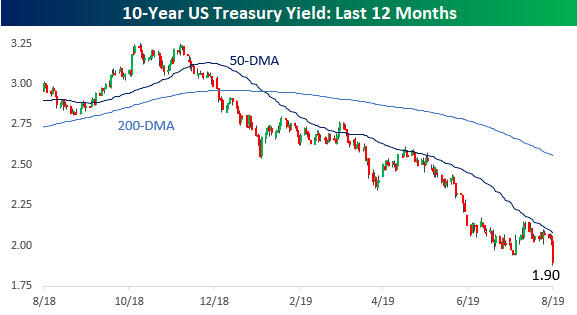
The chart below shows a shorter-term look at the 10-year yield over the last year and it has practically been in free-fall the entire time. Ever since late 2018, every time the yield has attempted to make a move above its 50-DMA, it has reversed lower, with the most recent leg lower in May coinciding with another series of tweets concerning tariffs on Chinese goods.
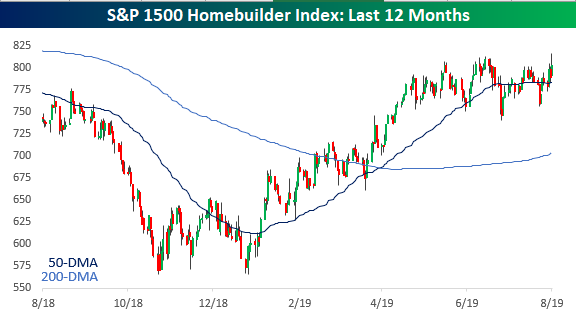
While not a lot of stocks have benefitted from the President’s policy tweets on Chinese tariffs, the impact of lower interest rates has been cheered on by the homebuilders as they have practically been a completely inverse image of the move in rates. Just yesterday, the group hit a new high before pulling back a bit, but lower long-term interest rates mean lower mortgage payments, and that helps to make housing more affordable for millions of millennials looking for a place of their own. Start a two-week free trial to Bespoke Premium to receive our best equity research on a daily basis.
The Closer – Who Does This Serve? – 8/1/19
Log-in here if you’re a member with access to the Closer.
Looking for deeper insight on markets? In tonight’s Closer sent to Bespoke Institutional clients, we begin with our commentary on the situation surrounding the President’s announcement of further tariffs as well as an analysis on the volatile reaction across asset classes. We finish with a look at some macro data including today’s release of US Markit PMI, Bloomberg Consumer Comfort, and Construction Spending.

See today’s post-market Closer and everything else Bespoke publishes by starting a 14-day free trial to Bespoke Institutional today!
Not Even Triple Plays Are Safe
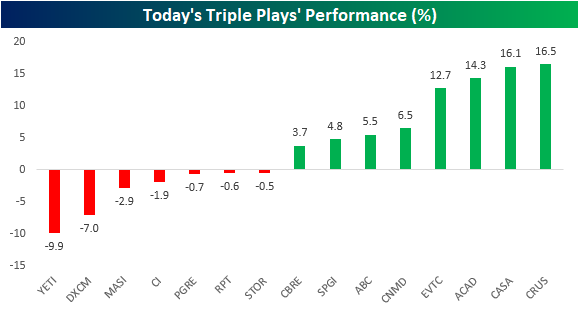
Today is one of the busiest days this earnings season with 258 total reports, and the triple plays have continued to come in at a healthy clip. Since yesterday’s close, there were another 15 companies that reported triple plays. Of these stocks, most have been Health Care (6), Real Estate (4), and Technology (3). Some of today’s notables include S&P 500 members AmerisourceBergen (ABC), CB Richard Ellis (CBRE), CIGNA (CI), and S&P Global (SPGI).
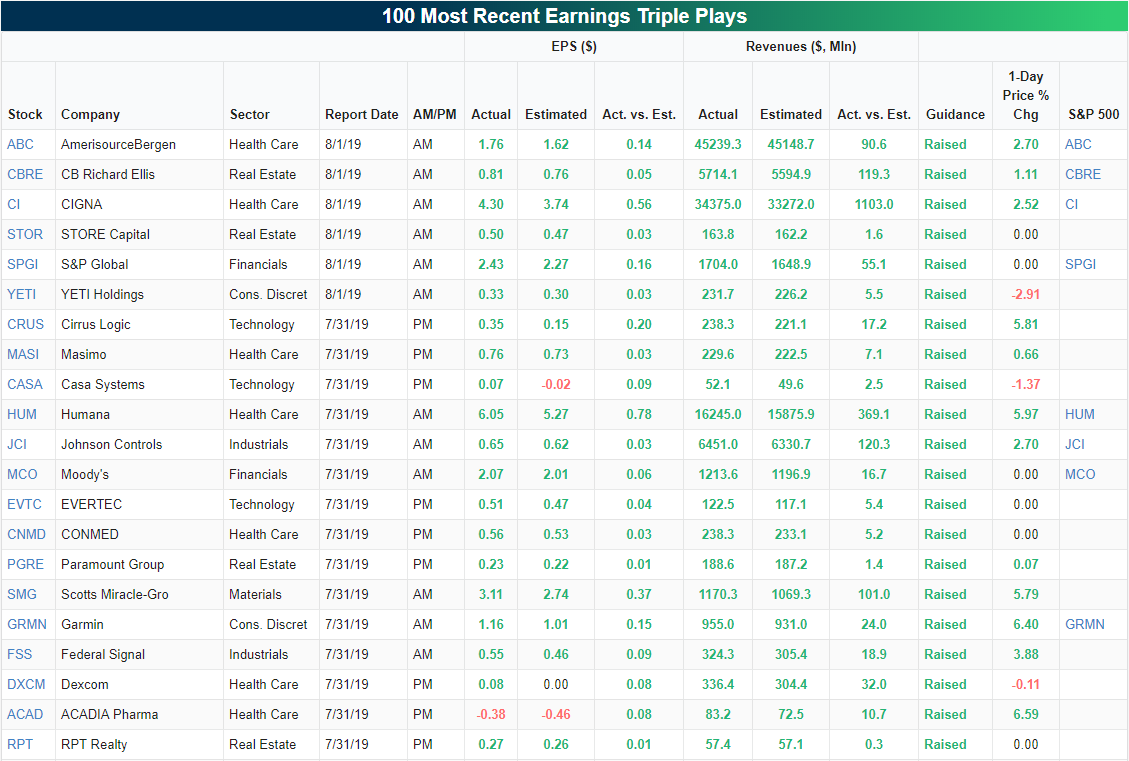
Of the four S&P 500 triple plays, only CI is trading lower today. CI is not alone in a negative reaction to its triple-play though. As the market is tumbling for the second day in a row, a third of the triple plays from the past day are witnessing declines. That is a bit unusual considering of the 50 triple plays so far this earnings season, the average earnings day reaction has been a gain of 7.5%.
YETI (YETI) has taken it on the chin the worst today. This was the company’s third triple play in its four quarters of earnings history. At the day’s lows, YETI was down over 14% before paring some of these losses. The stock is still the worst performer of today’s triple plays. Tipping between gains and losses today, STORE Capital (STOR) could potentially end an 8 consecutive quarter run of positive earnings reaction days if it finishes today in the red. On the other hand, EVERTEC (EVTC), ACADIA Pharma (ACAD), Casa Systems (CASA), and Cirrus (CRUS) are all up double digits. For CASA, this is only the second time that it has even seen a positive reaction to earnings. Before this report, the stock averaged a 11.06% decline following its quarterly reports. Start a two-week free trial to Bespoke Institutional to access our Earnings Explorer and much more.
Bespoke’s Sector Snapshot — 8/1/19
B.I.G. Tips – July Employment Report Preview
Now that the most anticipated Federal Reserve rate cut in history has come and gone, traders have immediately set their sites on the next meeting in September and whether or not there will be another cut in rates at that meeting. A key driver of whether or not rates get cut again is economic data like tomorrow’s Non Farm Payrolls report for July. Remember that last month’s report, which was sandwiched between July 4th and a weekend came in much stronger than expected setting off a market decline on fears the FOMC would not be as dovish as many investors had hoped. It’s also important to remember, though, that expectations for FOMC policy oscillated wildly in the weeks that followed as traders extrapolated every data point out to infinity. In other words, whatever the narrative is that comes out of Friday’s meeting, don’t expect it to last for long.
Heading into tomorrow’s report, economists are expecting an increase in payrolls of 165K, which would be a decline of nearly 60K from June’s stronger than expected reading. In the private sector, economists are also expecting an increase of 165K, which represents a decline of 26K from June. The unemployment rate is expected to drop back down to 3.6%, average hourly earnings are expected to grow at a rate of just 0.2%, while average weekly hours are expected to be unchanged at 34.4.

Ahead of the report, we just published our eleven-page preview of the July jobs report. This report contains a ton of analysis related to how the equity market has historically reacted to the monthly jobs report, as well as how secondary employment-related indicators we track looked in July. We also include a breakdown of how the initial reading for July typically comes in relative to expectations and how that ranks versus other months.
For anyone with more than a passing interest in how equities are impacted by economic data, this July employment report preview is a must-read. To see the report, sign up for a monthly Bespoke Premium membership now!
B.I.G. Tips – Death by Amazon – 8/1/19
Our “Death By Amazon” index was created many years ago to provide investors with a list of retailers we view as vulnerable to competition from e-commerce. In 2016, we also created our “Amazon Survivors” index which is made up of companies that look more capable of dealing with the threat from online shopping. To see how the two indices have been performing lately and view the full list of stocks that make up the indices, please read our newest report on the subject available to Bespoke Premium and Bespoke Institutional members.
To unlock our “Death By Amazon” and “Amazon Survivors” indices, login or start a two-week free trial to either Bespoke Premium or Bespoke Institutional.

Bulls Finally Back Above Average
So far, earnings season has been solid with above-average beat rates, guidance spread, and positive price reaction. This has certainly played a factor in improved sentiment in this week’s AAII survey. Bullish sentiment jumped 6.7% to 38.4%. Though it is still within a normal range, the percentage of investors reporting as bullish is now the highest since early May when it rose to over 43%. While earnings have likely positively impacted sentiment, we must also note that due to the timing of the survey, yesterday’s FOMC decision is likely to weigh little on this week’s results.

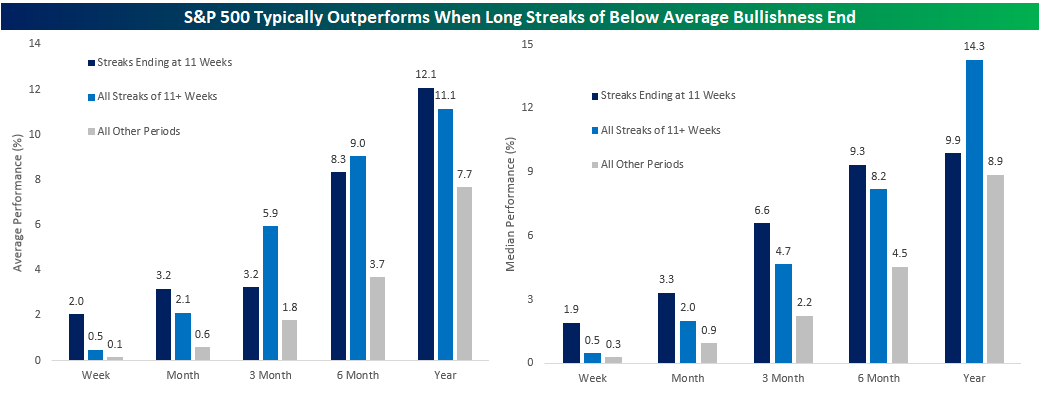
This week’s increase also ended a streak of eleven consecutive weeks that bullish sentiment remained below the historical average of 38.16%. As we mentioned last week, this sort of streak may sound like a negative, but there has been plenty of historical precedents. Since the beginning of the survey, there have been 18 other streaks that have gone 11 weeks or more, four of which have ended right at 11 weeks just like the most recent one. While any extended streak of below-average bullish sentiment has typically lead to outperformance, those that have ended at the eleventh week have actually done even better.
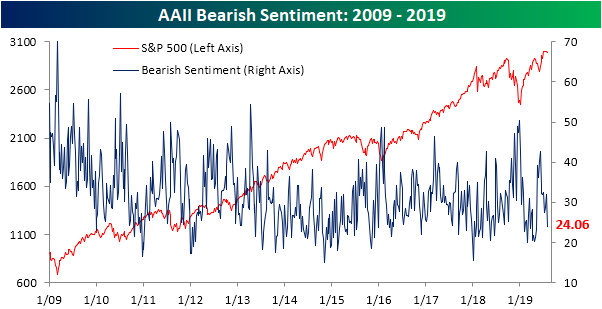
With the increase in bullish sentiment, bearish sentiment has fallen back to the lower end of its range, settling at 24.06%. This was the largest drop in the number of investors reporting as bears since June as the market rebounded from May declines. Speaking of those May declines, the last time bearish sentiment was this low was in the first week of May.
While both bears and bulls saw significant changes, neutral sentiment held firm only moving a bit more than 1%. At 37.5%, neutral sentiment continues to sit in the upper end of the past few year’s range and above the historical average of 31.52%. While bullish sentiment’s streak above its historical average may have come to a close, this week coincidentally marked the eleventh consecutive week of above-average neutral sentiment. The streak is even more impressive when taking into account the fact that the percentage of investors reporting as neutral has been elevated all year with 26 of the 30 weeks in 2019 seeing above-average neutral sentiment. Start a two-week free trial to Bespoke Institutional to access our interactive economic indicators monitor and much more.
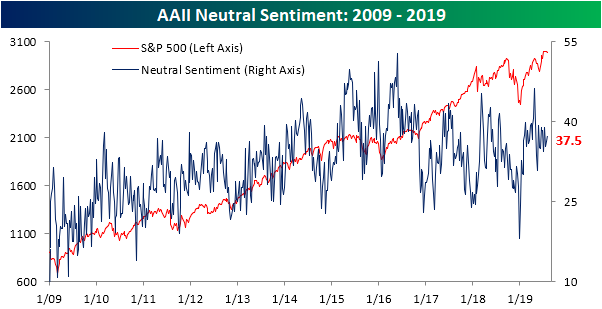
Chart of the Day: July 2019 Decile Analysis
ISM Manufacturing Near a Three Year Low
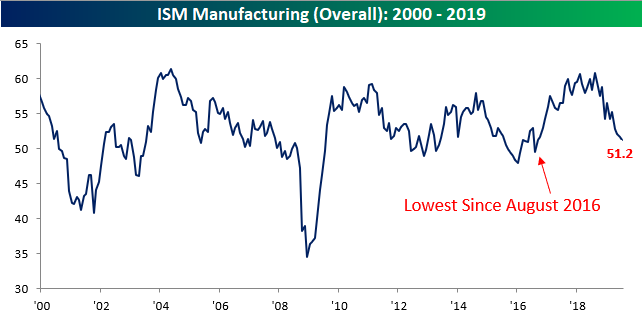
The pace of growth in the manufacturing sector continued to show signs of a slowdown in July as the ISM Manufacturing Index came in at a level of 51.2 versus expectations for a reading of 52.0. The last time we saw readings this weak in the ISM Manufacturing Index was nearly three years ago back in August 2016. Not only did this month’s reading come in below expectations, but it was also the fourth straight monthly decline which is the longest such streak since the eight-month stretch ending in January 2016. Talk about a rut!
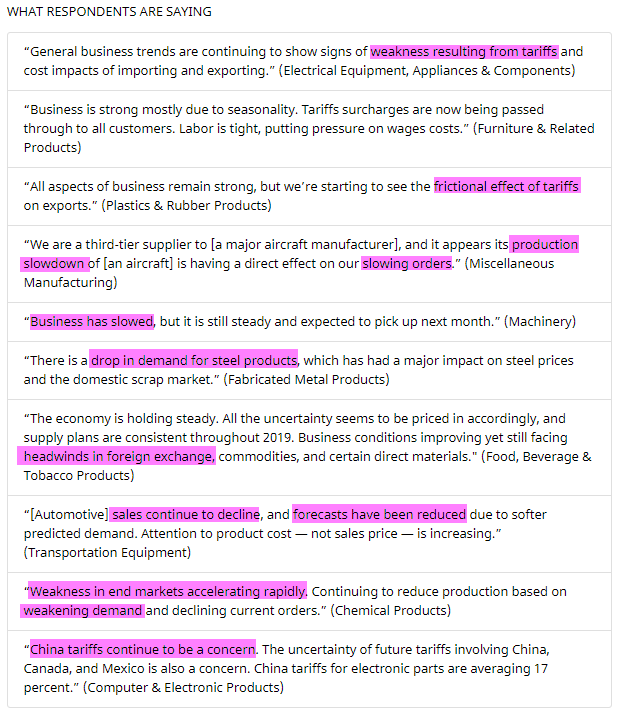
As you might expect given the ISM Manufacturing Index’s move towards 50 (the dividing line between growth and contraction), the commentary from respondents in this month’s report is sounding increasingly cautious. The frequency of terms like weakness, slowdown, and other terms like these have been on the rise in recent months.
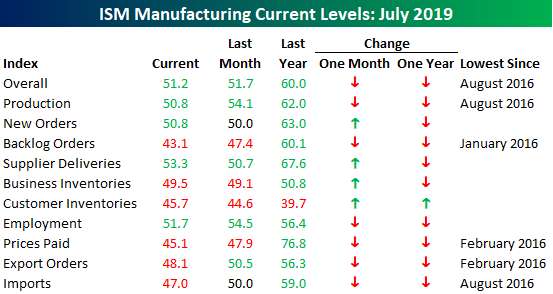
In looking at the breadth of the ISM Manufacturing Index’s sub-indices, things were biased towards the downside as six components saw m/m declines and just four saw increases. On a y/y basis, things were even worse as Customer Inventories was the only one higher versus a year ago. Just as the headline index saw its lowest reading since August 2016, a number of the sub-indices are also at their weakest levels since 2016. Both Production and Imports haven’t been this weak since August 2016, Prices Paid and Export Orders haven’t been this weak since February 2016, and Backlog Orders dropped to its lowest level since January 2016. In order to not close on a down note, we would note that New Orders managed to show a slight increase rising from 50.0 to 50.8. Start a two-week free trial to Bespoke Premium to receive our best equity research on a daily basis.
Claims Still Low But Not A New Low
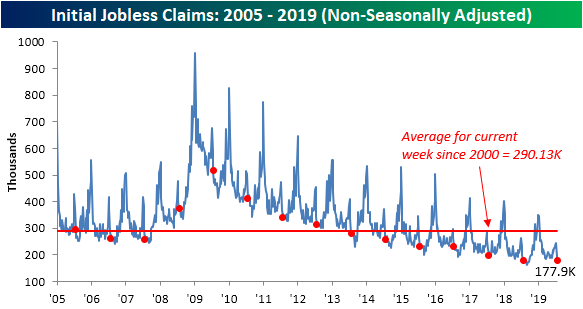
Seasonally adjusted jobless claims rose after dropping last week to the lowest level in three months (which was revised up to 207K). With a reading of 215K, claims came in slightly above estimates of 214K. While claims are currently at the lower end of the past year’s range, other than a few spikes higher and lower, there has been no significant consistent trend higher or lower over the past 12 months (gray shaded chart below). That does not mean the data has not been healthy though as claims have remained at or below 250K and 300K for record streaks of 95 and 230 weeks, respectively.

While it may not be evident in the weekly seasonally adjusted numbers, the four-week moving average has been continuing to trend lower. This week marked the fourth straight week with a decline in the moving average falling from 213.25K last week to 211.5K. This decline was largely a result of a recent high of 222K coming off of the average. This average is also now at its lowest level since mid-April’s multi-decade low and would need to fall another 10K to take out this low to help confirm the trend lower is still alive and well.
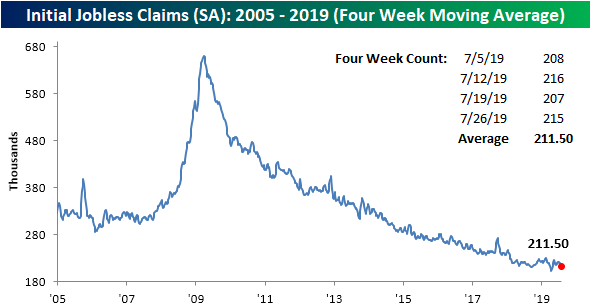
This time of year typically has favorable seasonality for jobless claims as a large drop is usually observed after a short term peak a few weeks prior. This year is following this pattern to a tee as NSA claims dropped to 177.9K from 196.4K last week and the recent peak of 243.6K the week before that. Seasonality aside, 177.9K is still the lowest print for non-seasonally adjusted claims for any week in ten months. At its current levels, NSA claims are also at the lowest level for the current week of the year for this cycle, but this year did see a much smaller degree of change year-over-year than previous years; a 2K decline versus declines of 20.9K and 18.9K for the comparable week in the past two years.
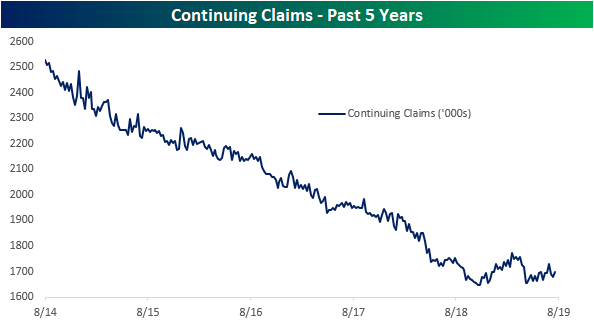
While claims are still at healthy levels, the trend lower has not been as strong as it has been in prior years. Initial claims data has hinted at this but continuing claims are perhaps a more obvious example. Back in October of last year, continuing claims fell to a multi-decade low of 1649K. Since then though, there has not been a new low despite coming close in April and May. Since the spring, claims has been slowly grinding higher once again with another uptick to 1699K this week. So overall, while labor market data still is healthy and low by historical standards, the rate of improvement has subsided a bit. Start a two-week free trial to Bespoke Institutional to access our interactive economic indicators monitor and much more.