The Closer – Equities Plunge, WeWork S1’d, EIA Data, Fund Flows Carnage- 8/14/19
Log-in here if you’re a member with access to the Closer.
Looking for deeper insight on markets? In tonight’s Closer sent to Bespoke Institutional clients, we compare the price action of the S&P 500 so far in 2019 to what things looked like in 1998. We then show what performance looks like following other moves of down 1% one day, then up 1%, and finally down 2% the next day. After that, we evaluate WeWork’s fundamentals before turning to weekly EIA and ICI Fund Flow data.

See today’s post-market Closer and everything else Bespoke publishes by starting a 14-day free trial to Bespoke Institutional today!
Chart of the Day: Bonds Extended; Curve Inversions
Fixed Income Weekly – 8/14/19
Searching for ways to better understand the fixed income space or looking for actionable ideas in this asset class? Bespoke’s Fixed Income Weekly provides an update on rates and credit every Wednesday. We start off with a fresh piece of analysis driven by what’s in the headlines or driving the market in a given week. We then provide charts of how US Treasury futures and rates are trading, before moving on to a summary of recent fixed income ETF performance, short-term interest rates including money market funds, and a trade idea. We summarize changes and recent developments for a variety of yield curves (UST, bund, Eurodollar, US breakeven inflation and Bespoke’s Global Yield Curve) before finishing with a review of recent UST yield curve changes, spread changes for major credit products and international bonds, and 1 year return profiles for a cross section of the fixed income world.
In this week’s report we discuss the rabid buying of fixed income assets we’ve seen of late.

Our Fixed Income Weekly helps investors stay on top of fixed income markets and gain new perspective on the developments in interest rates. You can sign up for a Bespoke research trial below to see this week’s report and everything else Bespoke publishes free for the next two weeks!
Click here and start a 14-day free trial to Bespoke Institutional to see our newest Fixed Income Weekly now!
Bespoke’s Global Macro Dashboard — 8/14/19
Bespoke’s Global Macro Dashboard is a high-level summary of 22 major economies from around the world. For each country, we provide charts of local equity market prices, relative performance versus global equities, price to earnings ratios, dividend yields, economic growth, unemployment, retail sales and industrial production growth, inflation, money supply, spot FX performance versus the dollar, policy rate, and ten year local government bond yield interest rates. The report is intended as a tool for both reference and idea generation. It’s clients’ first stop for basic background info on how a given economy is performing, and what issues are driving the narrative for that economy. The dashboard helps you get up to speed on and keep track of the basics for the most important economies around the world, informing starting points for further research and risk management. It’s published weekly every Wednesday at the Bespoke Institutional membership level.
You can access our Global Macro Dashboard by starting a 14-day free trial to Bespoke Institutional now!

Bespoke’s Morning Lineup — 8/14/19
This week has started off with a 1%+ decline on Monday followed by a 1%+ gain on Tuesday. The same thing happened last week. Since 1952 when weekend trading ended and the five-day trading week began, there have only been three other instances in which this has happened. The forward returns for stocks following these three occurrences are quite amazing.
Find out why in today’s Morning Lineup. Bespoke’s Morning Lineup is the best way to start your trading day. Read it now by starting a two-week free trial to Bespoke Premium. CLICK HERE to learn more and start your free trial.

The Closer – Bouncing Around, Inflation Up, New York Fed Consumer Debt – 8/13/19
Log-in here if you’re a member with access to the Closer.
Looking for deeper insight on markets? In tonight’s Closer sent to Bespoke Institutional clients, we begin with a look at the S&P 500’s second rejection of the 50-DMA, weak 52-week bill auction, and the chaos in the VIX curve. Turning to macroeconomic data, we then review today’s CPI before taking an in depth look at consumer debt.
See today’s post-market Closer and everything else Bespoke publishes by starting a 14-day free trial to Bespoke Institutional today!
Chart of the Day: A Positive Small Business Report
Bespoke Stock Scores — 8/13/19
ZEW Sentiment Getting Carried Away
Each month, ZEW surveys analysts to gauge how they’re feeling about economic growth around the world, both for the current period and going forward. We spend far too much time looking at global data to try and paint a sanguine picture about the state of the global economy, but some of the negativity is starting to get ridiculous. Today’s ZEW analyst survey saw very weak readings in both expected growth and current activity across a range of economies; of the two flavors (current and expected growth) across 7 major economies, only one (Japanese current growth) rose from July data to August data. All are down substantially year-over-year. UK growth expectations are at a record low!
In the table below we show expectations and current growth assessments by country, including the date the last time the gauge was as low as current. As shown, things are getting pretty ridiculous in some cases; UK expectations are one example and US expectations another. Start a two-week free trial to Bespoke Institutional to access The Closer and the rest of Bespoke’s suite of Institutional products.

The last time the ZEW series for US growth was this weak was back in October of 2008. It’s easy to forget just how grim things were at that point, so in the table below we re-visit some notable headlines from the WSJ each day of October, 2008. Compare and contrast that series of headlines to recent ones. To be sure, recent news from around the world has been disappointing for investors. But to put it in the same category as the headlines we’ve highlighted in red, which document the near-destruction of global financial markets and the worst collapse in economic activity since the Great Depression, is patently absurd. The ZEW surveys are indicative of an excessively bearish level of sentiment that is both understandable and a contrary signal for global growth, in our view.
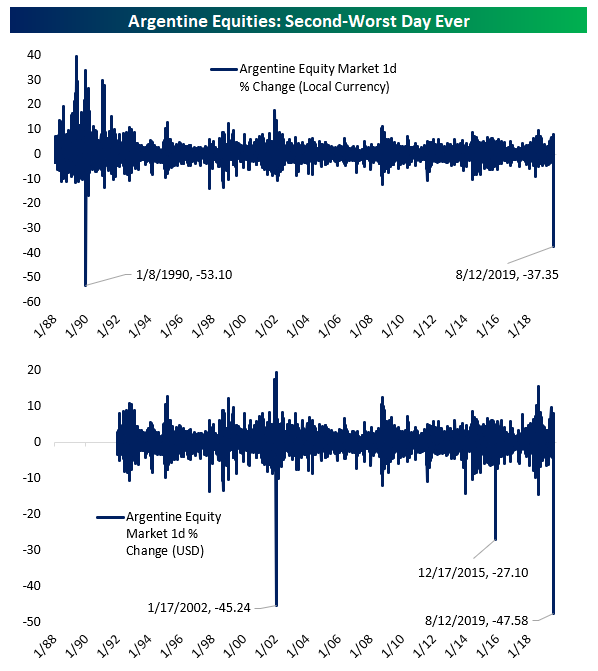
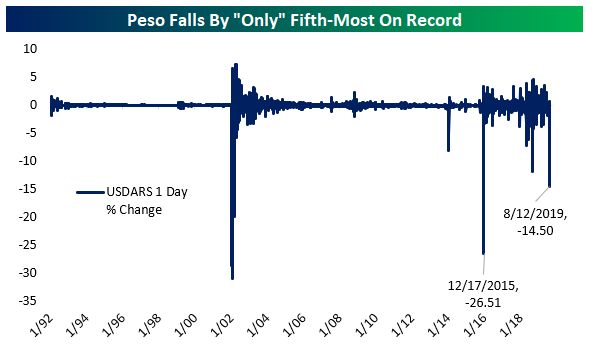
Argentina’s Bad Hair Day
In our global macro note The Closer last night, we discussed the brutal start to the week for Argentina. As far as the global macro picture goes, it’s hard to find a bigger one-day trainwreck than Argentina. A higher-than-expected vote share for populists in the country’s presidential primary kicked off a staggering 37% decline in Argentine stocks priced in the domestic peso, the second-worst day since the 1980s. Priced in USD, it was also the second-worst day, though the January 2002 devaluation was a more significant loss (barely). Either way, investors have effectively gotten cut in half between the local currency declines in stock prices and the ~15% drop in the peso. For US-based investors, the drop in ARGT (the Global X Funds MSCI Argentina ETF) was 24%. For international investors, the dream is now that huge blows to financial markets from Peronist success will mean the populist Judicialist Party won’t unseat reform-oriented President Macri in the October general election. If Macri wins, Argentinian assets should return to where they traded last week or higher. Of course, voters aren’t beholden to financial markets, so if they decide that the costs to the currency, equity market, and funding of the Argentine economy are worth it to shift leftwards, then anybody reaching in to catch falling knives today will get cut. Start a two-week free trial to Bespoke Institutional to access The Closer and the rest of Bespoke’s suite of Institutional products.
It’s worth noting that the ARGT ETF is 22.3% weighted to MercadoLibre (MELI): Alibaba for Latin America. Tenaris, a steel manufacturer, is a 10% weight, while Globant (GLOB) and banks round out the names comprising more than half of ARGT’s market cap exposure. Check out the disastrous drop for ARGT yesterday in the chart below: