Russell 2000 (IWM) Testing Support
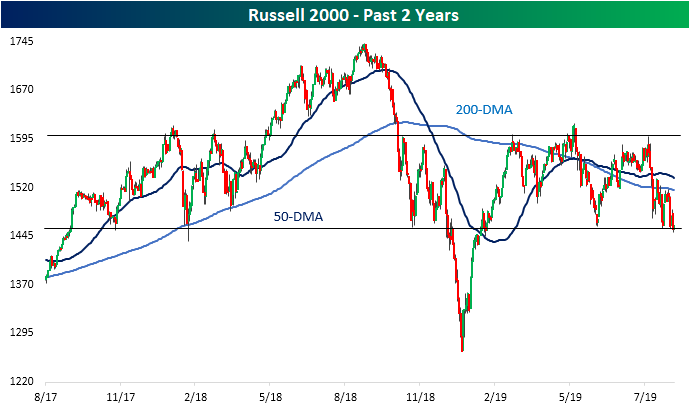
Unlike large-cap major indices like the Dow or S&P 500 which managed to reach record highs earlier this year, so far in 2019, the small-cap focused Russell 2000 never managed to so much as retest the highs from around this time last year. In fact, in the past year, other than the final leg down to December lows and the subsequent rally back up to previous levels in early 2019, the Russell has been in a range between support and resistance from last fall. This support and resistance can actually be traced back even further to the highs and lows of late 2017 and early 2018. This year has seen more tests of these support levels after May declines and once again this month.
At the beginning of August, the Russell collapsed through flat 50 and 200-DMAs finding relief at the bottom of this range. Since then, the index has been bouncing between this support and the 200-day with the most recent failed test of its 200-DMA coming just last week. Over the past few sessions, while it has not closed significantly below, intraday the index has breached these critical support levels. Fortunately, today the index is seeing some mean reversion from its extreme oversold levels as it is up rather than breaking out of the range to the downside. Start a two-week free trial to Bespoke Institutional to access our interactive Security Analysis tool and much more.
What’s Driven the S&P 500?
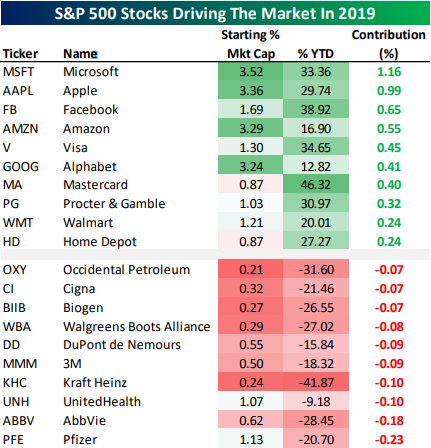
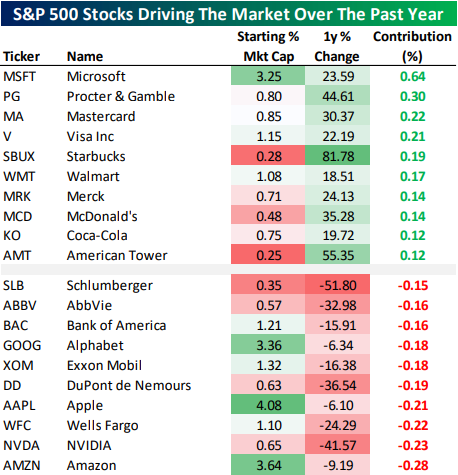
In last night’s Closer, we showed the biggest contributors to the S&P 500’s gain so far in 2019 as well as the stocks that have weighed on the index the most. Given the S&P’s 14% YTD gain, it’s probably not surprising to hear that only one stock in the entire S&P 500 has weighed on the total index performance by at least 20 bps: Pfizer (PFE). On the other hand, 11 different stocks have added at least 20 bps to total index performance in 2019. We show the 10 best and worst-performing stocks this year by the overall contribution to the S&P 500’s performance in the table below. As shown, mega-cap Tech like Microsoft (MSFT) and four of the five FAANG names have been the biggest contributors. When you add them all up, they’ve accounted for roughly 26% of the S&P’s gain this year. Two credit card companies — Mastercard (MA) and Visa (V), and two retailers — Walmart (WMT) and Home Depot (HD) — have also been big contributors to gains.
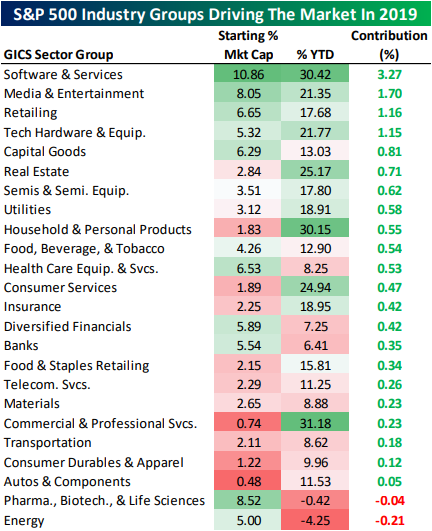
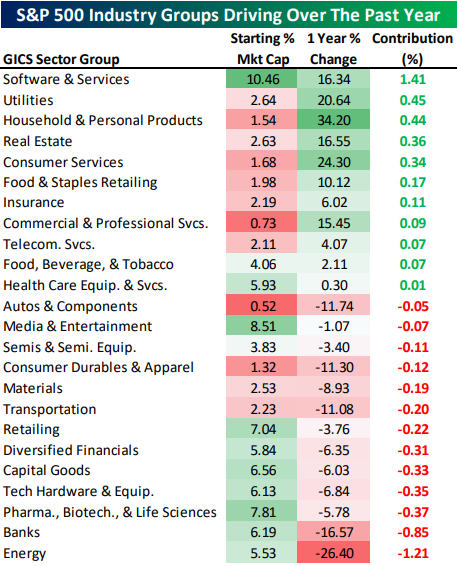
At the industry group level, health care stocks related to Pharmaceuticals, Biotech, and Life Sciences are one of only two industry groups to weigh on S&P 500 performance this year. Energy is the other standout with a 4% decline. Software & Services is the best performer, driving 3.3 percentage points of the S&P’s 14% gain this year. Media & Entertainment, Retail which includes Amazon (AMZN), and tech Hardware are the only other groups that have added at least 1% to the total 14.46% gain for the S&P 500 so far in 2019.
While YTD numbers look really great, things are not so hot versus this time last year; the S&P 500 is actually slightly lower year-over-year. As a result, the gap between the contribution of gainers and those of decliners is much narrower. Only four stocks drove a gain of at least 20 bps for the headline index over the past year: Microsoft (MSFT), Procter & Gamble (PG), Mastercard (MA), and Visa (V).
We note that the top ten gainers are almost exclusively very blue-chip stocks: large tech companies, credit card networks, and some consumer names. Only the cell phone tower REIT American Tower (AMT) is unusual in this list of big-cap, well-known stocks. Losers are concentrated in Health Care, Banks, and Tech.
While Alphabet (GOOG), Apple (AAPL), and Amazon (AMZN) aren’t down drastically versus last summer, their market caps are big enough to have cost a lot of performance for the S&P 500’s overall performance. Smaller cap stocks like NVIDIA (NVDA), DuPont (DD), AbbVie (ABBV), and Schlumberger (SLB) are a verry different story.
At the industry group level, there have been more decliners than gainers, though only Energy and Banks have cost the index more than 80 bps; on the flip side only Software has been a greater than 80 bps gainer. Defensive industry groups like Utilities, Household & Personal Products, and Real Estate have all driven the S&P 500 higher while cyclical industry groups like Capital Goods and Tech Hardware have weighed. Start a two-week free trial to one of Bespoke’s premium research services.
This Isn’t Normal
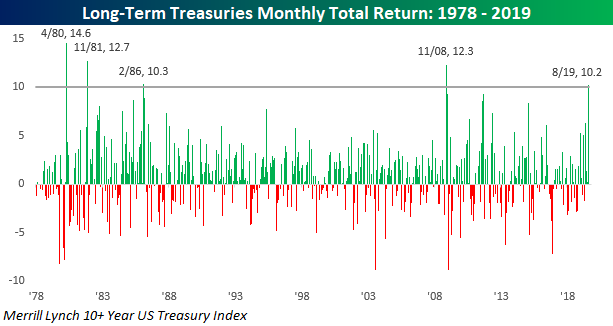
Being long bonds these days probably feels like being long tech stocks in the late 1990s. Every day you look at your portfolio, you expect it to be higher than the last time. This month through yesterday, the Merrill Lynch 10+ Year US Treasury Index is up over 10% and that doesn’t even include the rally we are seeing today. If the gains we have seen so far hold up into month-end, it will go down as just the 5th month since 1978 that long-term treasuries gained more than 10% in a single month. The last time we saw this large of a move in the long-term Treasury market was more than 10 years ago in November 2008, and before that you have to go all the way back to February 1986. In other words, this kind of move isn’t normal.
Besides the fact that long-term Treasuries are up over 10% this month, August marks the fourth straight month of gains for the asset class, and while that may not sound like much, the last time we saw a streak of four or more months of gains was in January 2015. With all these gains, the Merrill Lynch 10+ Year Treasury Index is up over 22% YTD. 22%! Start a two-week free trial to Bespoke Institutional to access our interactive Earnings Explorer, Triple Plays, and much more.
Bespoke’s Global Macro Dashboard — 8/28/19
Bespoke’s Global Macro Dashboard is a high-level summary of 22 major economies from around the world. For each country, we provide charts of local equity market prices, relative performance versus global equities, price to earnings ratios, dividend yields, economic growth, unemployment, retail sales and industrial production growth, inflation, money supply, spot FX performance versus the dollar, policy rate, and ten year local government bond yield interest rates. The report is intended as a tool for both reference and idea generation. It’s clients’ first stop for basic background info on how a given economy is performing, and what issues are driving the narrative for that economy. The dashboard helps you get up to speed on and keep track of the basics for the most important economies around the world, informing starting points for further research and risk management. It’s published weekly every Wednesday at the Bespoke Institutional membership level.
You can access our Global Macro Dashboard by starting a 14-day free trial to Bespoke Institutional now!

Trend Analyzer – 8/28/19 – Damage Done to Small Caps
Stocks remain oversold with small and mid-caps once again tipping into extreme oversold territory. Recent price action in the equity market has done the most damage to small caps. Despite breaking into neutral territory just over a week ago, the Core S&P Small-Cap ETF (IJR) has become the most oversold with a 2.88% decline over the last five trading sessions. The Russell 2000 (IWM) has seen equally large losses which have resulted in its trend to shift from ‘sideways’ to ‘down’ in our Trend Analyzer. The Micro-Cap ETF (IWC) is also in a downtrend and has fallen the most in the past week. Although most of the major index ETFs are still up by double-digit percentages in 2019, the same cannot be said for small caps. IWM’s 8.84% YTD gain is the best among small caps while IWC is only up 2.82% YTD.

In the commodities space, only precious metals have managed to edge out any sort of gain in the past week as gold and silver ETFs sit over 2% higher. Silver has outperformed much more dramatically, rising 6.11%. Despite this recent outperformance, SLV is still slightly lagging behind gold in terms of YTD performance, even if it extended in the short-term. Currently, SLV is 12.53% and more than two standard deviations above its 50-day. Both Gold Shares (GLD) and DB Precious Metals (DBP) are also extremely overbought while the DB Gold Fund (DGL) and the Gold Trust (IAU) just a hair below extreme overbought territory. Oil (USO) has taken it on the chin the past week after failing a test of its 50-DMA. Over the past five days, it is down 1.81%. Along with most other commodity ETFs in our Trend Analyzer, oil is in a long term downtrend while the aforementioned precious metals ETFs and Agribusiness ETF (MOO) are in uptrends. Only MOO has a good timing score given this uptrend in combination with its oversold levels. Start a two-week free trial to Bespoke Institutional to access our interactive Trend Analyzer and much more.

Bespoke’s Morning Lineup – Quietly Lower
See what’s driving market performance around the world in today’s Morning Lineup. Bespoke’s Morning Lineup is the best way to start your trading day. Read it now by starting a two-week free trial to Bespoke Premium. CLICK HERE to learn more and start your free trial.

The Closer – Stocks Driving The Market, Home Prices, Labor Over Capital – 8/27/19
Log-in here if you’re a member with access to the Closer.
As a quick programming note, tune in to see Bespoke’s Paul Hickey on CNBC’s Squawk Box tomorrow morning at 7 AM ET.
Looking for deeper insight on markets? In tonight’s Closer sent to Bespoke Institutional clients, we take a look at the S&P 500 stocks that have been the biggest contributors to the S&P 500’s gains so far in 2019. We also look at the stocks that have driven the index the most over the past 12 months. Finally, we take a look at today’s economic data releases that were centered around housing and manufacturing.

See today’s post-market Closer and everything else Bespoke publishes by starting a 14-day free trial to Bespoke Institutional today!
Bespoke Stock Scores — 8/27/19
Anaplan (PLAN) Still Flawless on Earnings
Anaplan (PLAN) now has four earnings reports under its belt as a public company, and it is setting a high standard for itself with a triple play in each of these quarters! Its most recent quarterly release came this morning, and while EPS was still negative at -$0.12, it beat analyst estimates. Revenues also beat, growing at a solid clip of 46.2% YoY. The company also raised guidance for the fourth time in a row.
In terms of stock price reaction to earnings, PLAN has usually been very strong rising over 10% each time with last quarter’s 18.22% gain being the best of these. Today is bucking that trend though as the stock gapped down 3.82% at the open even after its triple play. It traded as low as -8% on the day later in the morning, but it has seen buying this afternoon and is now down just 3% on the day. PLAN has been in a solid uptrend since its IPO but has been moving sideways in the month leading up to this report. Yesterday’s intraday high tested resistance at the previous high around $60, but with the stock failing to react positively to earnings today, it has yet to break out higher. We’ll be monitoring this one to see if it can report its 5th triple play in a row three months from now! Start a two-week free trial to Bespoke Institutional to access our interactive Earnings Explorer, Triple Plays, and much more.

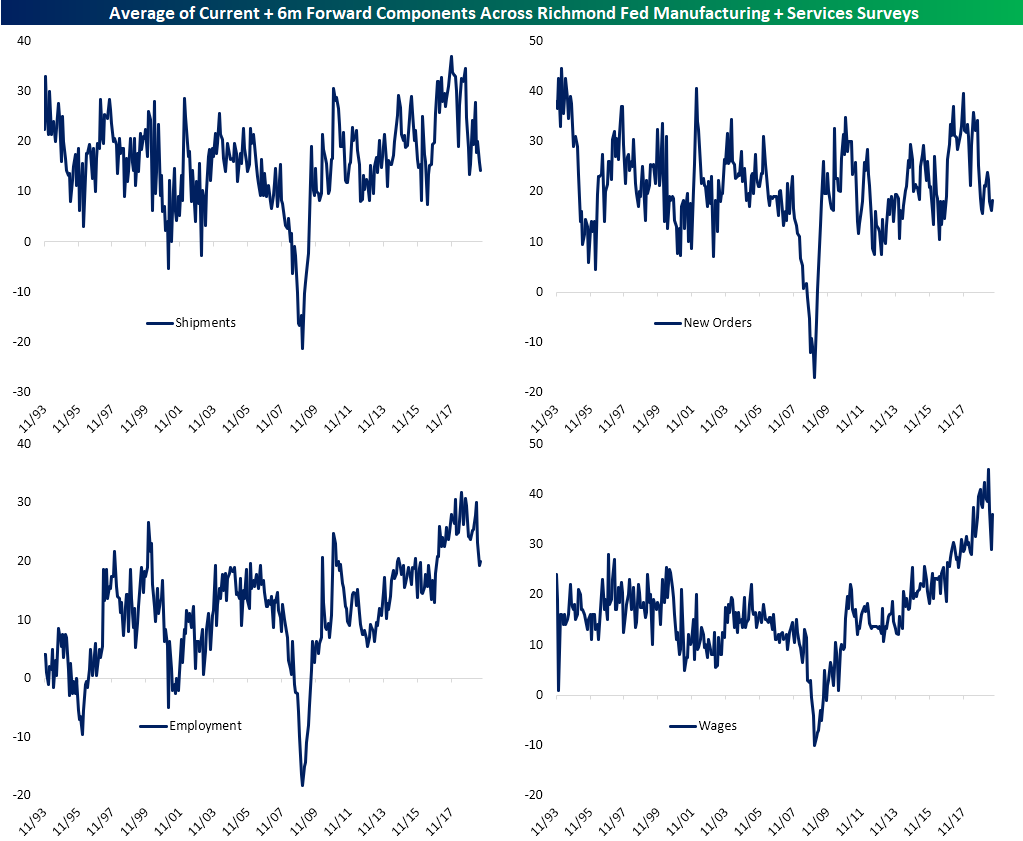
Richmond Rebounds
The Richmond Fed’s business condition surveys saw a dramatic rebound in August after July’s composite release came in at the lowest level since the financial crisis. The composite reading for current manufacturing conditions rose 13 points and came back into positive territory this month. This was thanks to strong breadth among the individual components as two-thirds improved with big pickups in shipments, new orders, backlogs, capacity utilization, local business conditions, equipment spending, and average workweek. Last month also saw half of these components come in with negative readings, but now only five are showing contraction. Notably, the employment component has fallen further after it turned negative last month for the first time since 2016. This is as businesses continue to struggle to find skilled workers.Start a two-week free trial to Bespoke Institutional now to see how the Richmond Fed data impacts our tracking of manufacturing activity across the whole country in The Closer tonight.
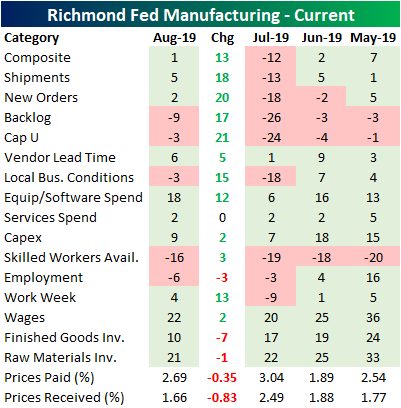
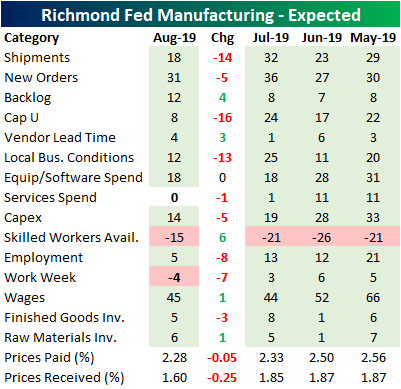
While current conditions improved dramatically, expectations six months out actually came in weaker. Only 29% of the components saw an improvement from June as many saw the opposite change from their current condition counterpart. For example, although shipments, new orders, capacity utilization, local conditions, and average work week all saw sizable gains in current conditions, the outlook for these components have simultaneously worsened. Companies are also expecting prices paid and received to fall further. Meanwhile, despite falling rates and the Fed’s cut last month, current conditions for capex remains subdued compared to where it has stood over the past year and expectations are not looking like there will be any pick up either. It is a similar story for equipment and software spending, although current conditions for this component is in better shape.
Looking at the averages of the current and forward-looking components for both the manufacturing and service surveys, business conditions, while not disastrous, have somewhat deteriorated over the past few months. Shipments have fallen for two straight months to the lowest level since last December. New orders are similarly at the lower end of its range, although it did improve marginally for the first time in three months in August. The indices for employment have been the real kicker. This has been nearly cut in half since April even with a small pickup this month. On average, employment indices are at their weakest level since late 2016 while wages have recovered a portion of their recent drop.