Q2 2025 Earnings Conference Call Recaps: PepsiCo (PEP)
Bespoke’s Conference Call Recaps use AI to summarize lengthy earnings calls. The commentary below is AI-generated and then edited by Bespoke for quality control. As always, none of these summaries should be construed as recommendations to buy or sell any securities, and investors should do their own research and/or consult with a financial professional before making any investment decisions.
Our latest recap available to Bespoke subscribers covers PepsiCo’s (PEP) Q2 2025 earnings call.
![]()
PepsiCo (PEP) is one of the world’s largest food and beverage companies, with a portfolio spanning iconic snack brands like Lay’s, Doritos, and Cheetos, and beverage brands including Pepsi, Gatorade, and Mountain Dew. The company operates globally but is anchored by two nearly $30 billion North American divisions: Frito-Lay North America (FLNA) and PepsiCo Beverages North America (PBNA). Organic revenue grew 4.5%, led by high-single-digit gains in away-from-home beverage sales, and continued momentum in international markets like LatAm and India. Amid regulatory shifts and rising consumer demand for cleaner labels, PEP is accelerating reformulations across snacks and beverages, removing artificial colors and flavors from Lay’s, Tostitos, and beverage lines. The company also highlighted the performance of its no-sugar colas and teased upcoming liquid protein and energy drink launches under big-brand banners, including Celsius and the Starbucks joint venture. Away-from-home sales continue to outperform and are margin-accretive. On better-than-expected results, PEP shares rallied 7.5% on 7/17…
Continue reading our Conference Call Recap for PEP by becoming a Bespoke Institutional subscriber. You can sign up for Bespoke Institutional now and receive a 14-day trial to read our newest Conference Call Recap. To sign up, choose either the monthly or annual checkout link below:
Bespoke’s Weekly Sector Snapshot — 7/17/25
Chart of the Day: Checking In On Office CRE
Bespoke’s Morning Lineup – Navigating Netflix – 7/17/25
See what’s driving market performance around the world in today’s Morning Lineup. Bespoke’s Morning Lineup is the best way to start your trading day. Read it now by starting a two-week trial to Bespoke Premium. CLICK HERE to learn more and start your trial.
“All money is a matter of belief.” – Adam Smith
Often hailed as the father of modern economics, Adam Smith (who died on this day in 1790) profoundly shaped our understanding of free markets and individual liberty through his seminal works, The Wealth of Nations and The Theory of Moral Sentiments. His ideas on the “invisible hand” and division of labor remain foundational to economic theory, emphasizing how self-interest and cooperation drive prosperity.

Below is a snippet of commentary from today’s Morning Lineup. Start a two-week trial to Bespoke Premium to view the full report.
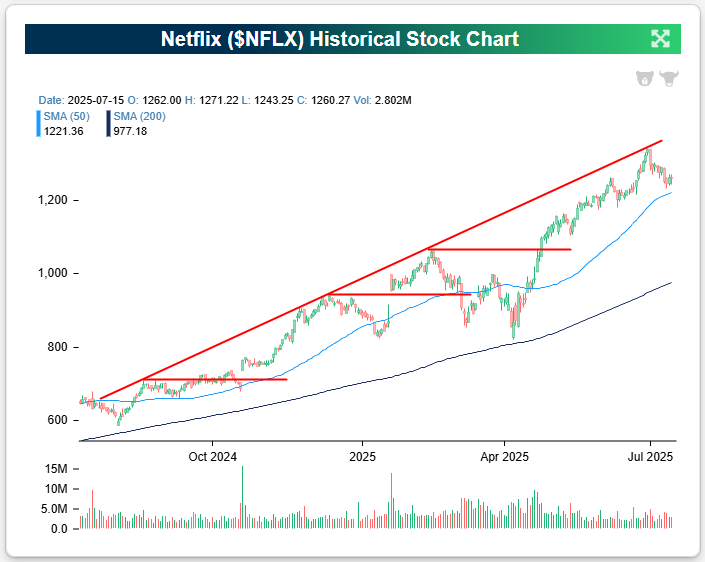
The banks and brokers always kick off each earnings season, but Netflix (NFLX) is the company that gets things started on the Tech/Consumer side of things. As shown below, NFLX is heading into its Q2 earnings report tonight in a long-term uptrend, but it has pulled back some in the past couple of weeks after touching up against the top of its one-year uptrend channel at the end of June. At the moment, it’s sitting just above support at its 50-day moving average after working off overbought levels.
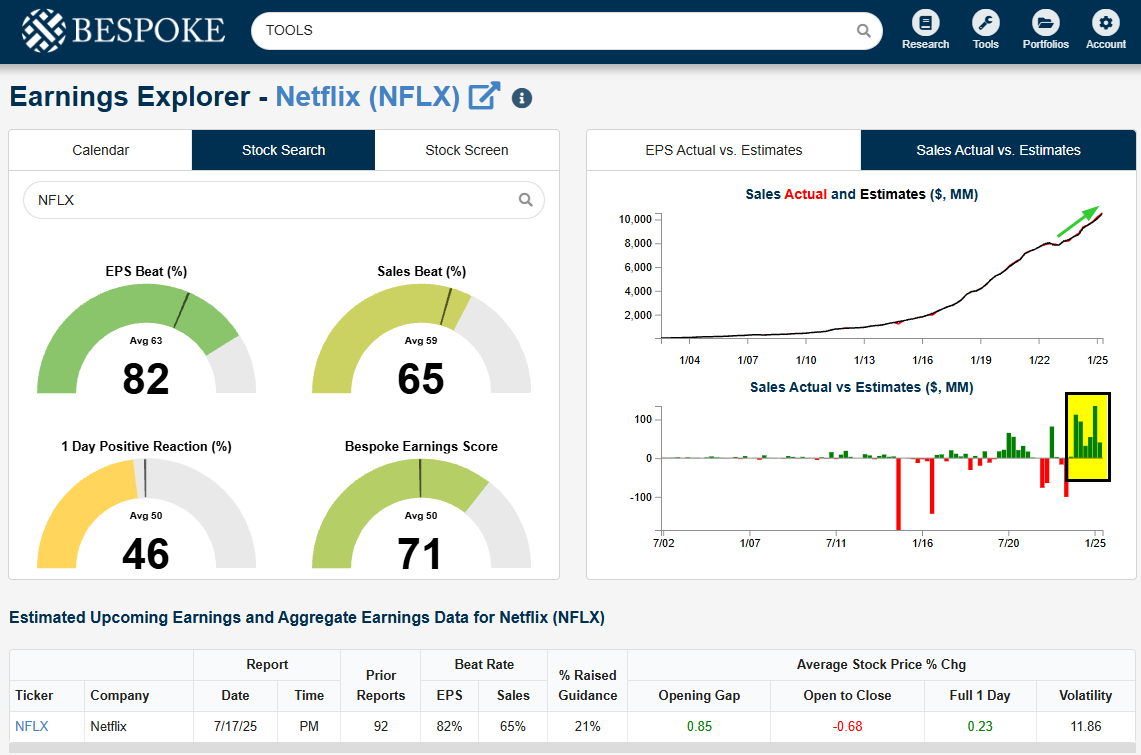
Below is a snapshot of Netflix (NFLX) from our Earnings Explorer tool, which can be seen on our website here for those with access (Institutional only). After stumbling on sales a few years ago in 2022, NFLX has seen a revenue resurgence with strong beats versus top-line estimates for six straight quarters. If estimates are met, this will be the third straight $10+ billion quarter for NFLX and the first above $11 billion.
There is some negative historical precedent for Netflix’s Q2 earnings reports specifically, though…
The Closer – Powell Firing, Beige Book, PPI – 7/16/25
Log-in here if you’re a member with access to the Closer.
Looking for deeper insight into markets? In tonight’s Closer sent to Bespoke Institutional clients, we begin with some commentary regarding risks that could drive up yields which includes inflation data (pages 1 – 3). We then turn to a look at JB Hunt (JBHT) earnings and how today’s performance shaped up in spite of very weak breadth (page 4). Next, we check in on loan growth (page 5) before finishing with a look at some impressive earnings streaks ahead of earnings season (pages 6 & 7).
See today’s full post-market Closer and everything else Bespoke publishes by starting a 14-day trial to Bespoke Institutional today!
Daily Sector Snapshot — 7/16/25
Chart of the Day: Equal Weight Yields More
Q2 2025 Earnings Conference Call Recaps: Big Banks & Asset Managers
Bespoke’s Conference Call Recaps use AI to summarize lengthy earnings calls. The commentary below is AI-generated and then edited by Bespoke for quality control. As always, none of these summaries should be construed as recommendations to buy or sell any securities, and investors should do their own research and/or consult with a financial professional before making any investment decisions.
Our latest recap, available to Bespoke subscribers, covers Q2 2025 earnings calls from JPMorgan (JPM), Bank of America (BAC), Wells Fargo (WFC), Morgan Stanley (MS), Goldman Sachs (GS), BlackRock (BLK), and Citigroup (C).
The second quarter of 2025 marked a rebound in capital markets activity and continued resilience for big banks and asset managers across asset and wealth management. JPMorgan (JPM) led the group with $15B in net income and strong trading gains (+15% YoY), driven by fixed income and derivatives. Its asset and wealth business added $36B in net inflows. Goldman Sachs’ (GS) investment banking surged (+32% YoY) as dealmaking returned, but FICC trading softened. Bank of America (BAC) and Citi (C) both reported improved capital markets results, with Citi noting that investment banking revenue increased by 18% and FICC trading revenue rose by 25%. Morgan Stanley (MS) experienced a revival in equity underwriting and advisory services (+34% YoY in IB revenue), offsetting sluggish trading. On the asset management side, BlackRock (BLK) posted a record $12.5T in AUM with $116B in net inflows (excluding low-fee redemptions) and double-digit EPS growth (+16% YoY), while JPMorgan and Morgan Stanley also posted strong flows and AUM growth. Wells Fargo (WFC) leaned on net interest income growth and consumer credit normalization. Across the board, firms noted lower fee compression, improved flows, and a more upbeat M&A outlook, with private markets and technology services (e.g. BlackRock’s HPS and Preqin acquisitions) becoming increasingly central to long-term growth narratives…
Continue reading our Conference Call Recap for JPM, BAC, WFC, MS, GS, BLK, and C by becoming a Bespoke Institutional subscriber. You can sign up for Bespoke Institutional now and receive a 14-day trial to read our newest Conference Call Recap. To sign up, choose either the monthly or annual checkout link below:
Bespoke Baskets Update — July 2025
Bespoke’s Morning Lineup – More Banks Beat – 7/16/25
See what’s driving market performance around the world in today’s Morning Lineup. Bespoke’s Morning Lineup is the best way to start your trading day. Read it now by starting a two-week trial to Bespoke Premium. CLICK HERE to learn more and start your trial.
“There is always some kid who may be seeing me for the first time. I owe him my best.” – Joe DiMaggio
On this day in 1941, Yankees star Joe DiMaggio extended his record hit streak to 56 games, which would end the next day. July 16th was also the day of the first atomic bomb test in New Mexico in 1945. J.D. Salinger’s Catcher in the Rye was published on July 16th, 1951, and the Apollo 11 moon-landing mission launched on this day in 1969.
Below is a snippet of commentary from today’s Morning Lineup. Start a two-week trial to Bespoke Premium to view the full report.
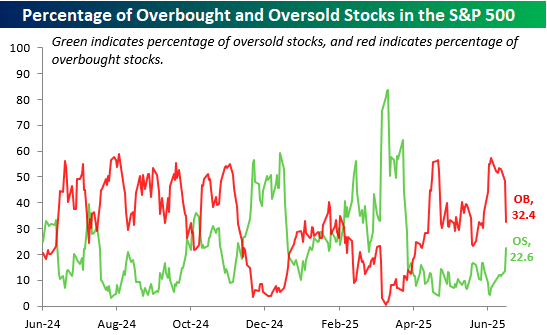
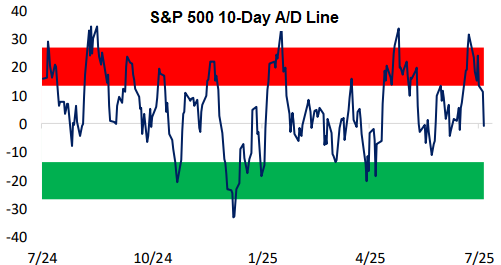
While the S&P is down just 0.3% over the last week, we’ve seen overbought levels work themselves off for some of the key breadth levels we watch.
The S&P’s 10-day advance/decline line had gotten to one of its most overbought levels of the last year earlier in the month, but it’s currently sitting just below the flat-line.
The percentage of overbought stocks in the S&P has also fallen from a reading above 50% down to 32%, while 22.6% of stocks in the index are now oversold.