Small Changes, Big Moves
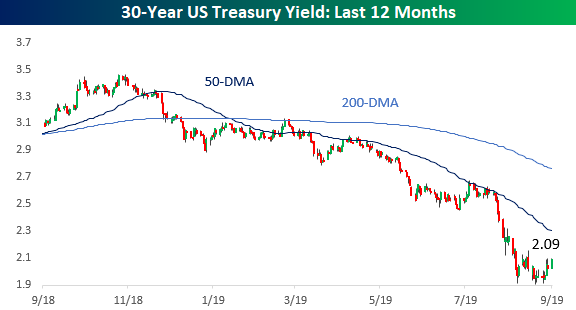
After a relentless downward move for much of August, long-term interest rates have started to stabilize in the last week or so and have even started to show small upward moves. Take the 30-year US Treasury yield, for example. After hitting a low of 1.90% on August 28th, the 30-year yield has moved up to 2.09%.
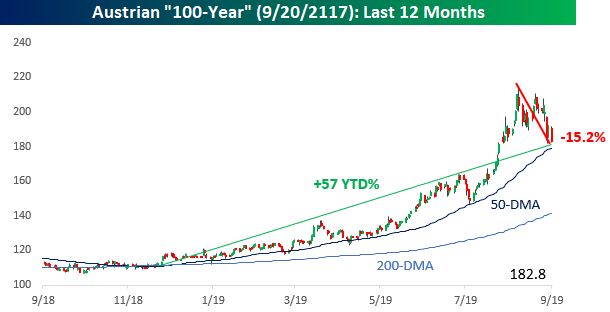
While a small increase in yields may not seem like a lot, the further out into the future the maturity of that asset is, the bigger the impact the move in interest rates will be on its price. Let’s take an extreme example using the Austrian 100-year bond that was issued in late 2017 and matures in September 2117. As the frenzy for yield has eased since late August, the price of the Austrian 100-year bond has dropped over 15%. That’s a pretty big move given that the interest rate on the bond has only increased 23 basis points! To be fair, it works both ways. When yields were falling, the price of the Austrian 100-year was one of the top-performing assets in the entire financial universe, and even after the recent decline, it is still up 57% YTD. If rates keep rising, those big gains investors have seen in their long-term fixed-income holdings this year will reverse sharply. Start a two-week free trial to Bespoke Institutional to access our unparalleled research and interactive tools.
Bespoke’s Morning Lineup – Keeping Up the Momentum
See what’s driving market performance around the world in today’s Morning Lineup. Bespoke’s Morning Lineup is the best way to start your trading day. Read it now by starting a two-week free trial to Bespoke Premium. CLICK HERE to learn more and start your free trial.

Bespoke Brunch Reads: 9/8/19
Welcome to Bespoke Brunch Reads — a linkfest of the favorite things we read over the past week. The links are mostly market related, but there are some other interesting subjects covered as well. We hope you enjoy the food for thought as a supplement to the research we provide you during the week.
While you’re here, join Bespoke Premium for 3 months for just $95 with our 2019 Annual Outlook special offer.
Indexing
The Big Short’s Michael Burry Explains Why Index Funds Are Like Subprime CDOs by Reed Stevenson (Bloomberg)
One of the most well-known benefactors of housing short trades sees index funds as the next big problem for markets, citing liquidity mismatches and structuring as the key problems for investors. [Link; soft paywall, auto-playing video]
Debunking the Silly “Passive is a Bubble” Myth by Ben Carlson (A Wealth Of Common Sense)
The prior story about indexing gets a forensic treatment from Carlson, who does a great job pointing out the absurd hyperbole surrounding index funds. [Link]
Tech
The Time Netflix Considered Selling Itself to Amazon for Peanuts by Marc Randolph (WSJ)
Back in 1998, the now-giant streaming service was on the ropes as an order-by-mail DVD rental business, and it briefly considered a sale of its business to the nascent Amazon empire. [Link; paywall]
Waze Hijacked L.A. in the Name of Convenience. Can Anyone Put the Genie Back in the Bottle? by Jonathan Littman (LA Mag)
How the traffic app started off giving Los Angelenos a god-like power over their commute, but has since led to dead-ends by snarling streets with traffic and prompting pushback from the neighborhoods turned throughfares that Waze pushes traffic through. [Link]
Investing
Quality Stocks Are an Overcrowded Trade by John Authers (Bloomberg)
Stocks which have attributes broadly grouped into the basket of “quality” have been outperforming, but are their gains sustainable? [Link; soft paywall]
The Collector: 1977 WSJ Article on Buffett Strikes Familiar Themes (The Rational Walk)
A blast from the past with quotes from Warren Buffett much earlier in his career, offering a remarkable degree of consistency in his views about companies over the years. [Link]
Tech Dystopia
A Breakthrough for A.I. Technology: Passing an 8th-Grade Science Test by Cade Metz (NYT)
In Seattle, a lab has developed an AI capable of scoring 90% on an 8th-grade math test and more than 80% on a 12th-grade exam; that’s a remarkable breakthrough in natural language processing that clobbers efforts made by hundreds of teams as recently as four years ago. [Link; soft paywall]
Fraudsters Used AI to Mimic CEO’s Voice in Unusual Cybercrime Case by Catherine Stupp (WSJ)
Using software that allowed them to duplicate a CEO’s voice, scammers were able to direct one of his subordinates to transfer a six figure payment to a fictitious supplier. [Link; paywall]
Higher Ed
All the Greedy Young Abigail Fishers and Me by Jia Tolentino (Jezebel)
A fascinating look at the industry of tutors who work to get their higher income peers into high status colleges with that perfect essay or personal statement. [Link]
Food
Meet The Man Who Guards America’s Ketchup by Dan Charles (WFAE)
Assuring a consistent taste and quality in America’s ketchup supply is an important job, and it falls to a man Kraft Heinz refers to as their “Ketchup Master”. [Link]
Real Estate
The ridiculous reasons rich New Yorkers no longer buy penthouses by Christopher Cameron (NY Post)
With super-thin buildings pushing dozens upon dozens of stories high, the ultra-lux penthouse is no longer as attractive to buyers who don’t like the excessive height of the tallest floors. [Link]
Read Bespoke’s most actionable market research by joining Bespoke Premium today! Get started here.
Have a great weekend!
The Bespoke Report — 9/6/19
This week’s Bespoke Report newsletter is now available for members.
In this week’s newsletter, we highlight the S&P 500’s breakout above a key resistance level this week and try to identify if the rally has any staying power. We provide a run-down of major economic releases and what they mean for global financial markets, and we also take a look at the recent action in mega-cap stocks at the top of the food chain. To read the Bespoke Report and access everything else Bespoke’s research platform has to offer, start a two-week free trial to one of our three membership levels. You won’t be disappointed!

The Closer: End of Week Charts — 9/6/19
Looking for deeper insight on global markets and economics? In tonight’s Closer sent to Bespoke clients, we recap weekly price action in major asset classes, update economic surprise index data for major economies, chart the weekly Commitment of Traders report from the CFTC, and provide our normal nightly update on ETF performance, volume and price movers, and the Bespoke Market Timing Model. We also take a look at the trend in various developed market FX markets.

The Closer is one of our most popular reports, and you can sign up for a free trial below to see it!
See tonight’s Closer by starting a two-week free trial to Bespoke Institutional now!
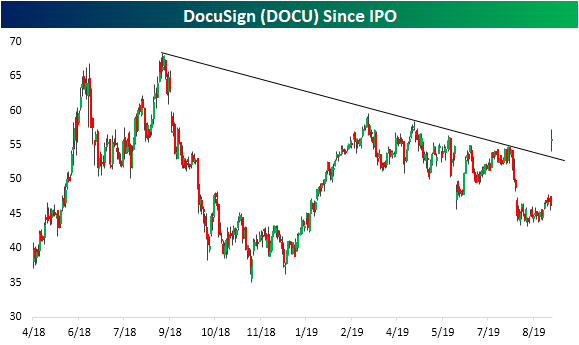
DocuSign (DOCU) No Longer Flawless On Earnings But…
DocuSign (DOCU) reported after the close yesterday and for the first time since the company went public back in April of 2018, it did not report an earnings triple play. Although revenues grew 41% YoY to $235.61 million (~$15 mm above estimates) and the company raised guidance, EPS was 3 cents below analyst estimates. As shown in our Earnings Explorer below, before this report DOCU had been flawless on earnings. Despite the strong fundamental picture from these past quarters, the stock price reaction has consistently been negative. Only after the first earnings report as a public company did the stock finish the next day higher, and even then, it fell from open to close.
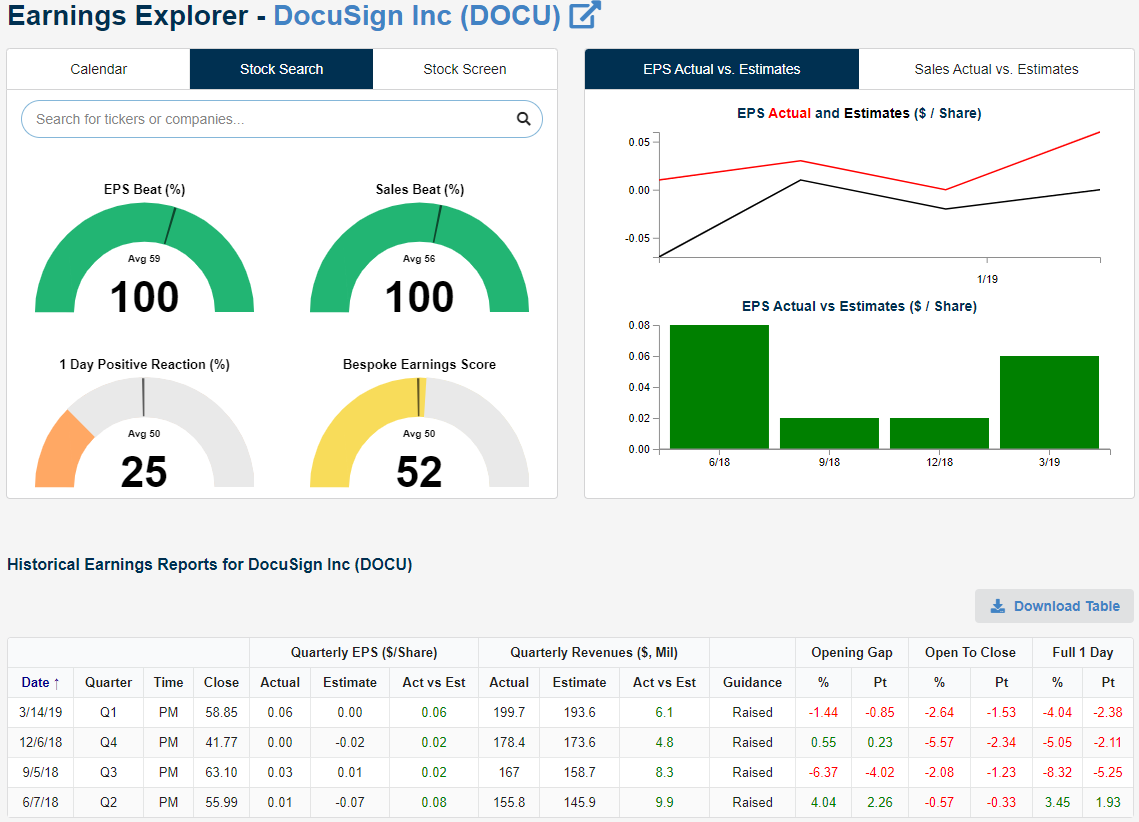
Given this somewhat confusing disconnect between strong results and the stock’s reaction, it almost seems to make sense that DOCU rallied today despite missing EPS for the first time. DOCU broke a streak of three straight moves lower on earnings with a gap up of 20.4% at the open. Intraday the stock has more or less held onto these gains but experienced swings of a few percentage points in both directions. At the highs of the day, it was up 3.3% from the open and at today’s lows, it was down 2.9% from the open. Regardless of the indecisive intraday price action, the massive gap up has brought the stock back up to levels last seen at the end of May and above the past year’s downtrend line. The stock is also now trading above its 50 and 200-day moving averages for the first time since the beginning of August. Start a two-week free trial to Bespoke Institutional to access our interactive Earnings Explorer and much more.
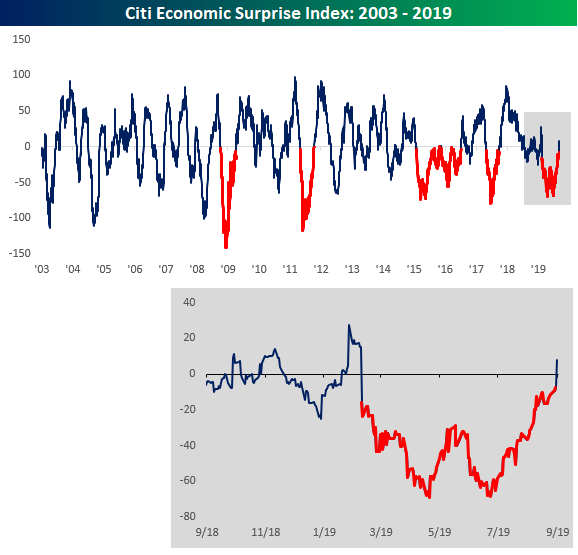
Economic Surprise Index Turns Positive
When it comes to economic reports, one trend that has seemingly been in place all year is that the vast majority of data points have come in short of expectations. The fact that economic momentum has been slowing is one thing, but when the economy consistently comes up short relative to expectations, it sets a tone that things are quickly deteriorating. That’s never a good thing, but thankfully, there are signs that the tide is turning.
The Citi Economic Surprise Index measures the pace at which economic indicators are coming in ahead of or below consensus forecasts. When the index is negative, it means that the majority of reports are coming in below expectations, while a positive reading indicates that most data is coming in ahead of expectations. The chart below shows the index going back to 2003, and the parts where the line is red indicate periods where the index was negative for at least 100 trading days. The most recent period of negative readings was one of the longest ever at 140 trading days and just the 6th streak of 100 or more trading days (during the period from 2015 to 2016 there were actually two separate streaks although it looks like just one long streak in the chart). The fact that this index is now positive indicates that economists have finally ratcheted down estimates enough to be in line with actual conditions on the ground. Start a two-week free trial to Bespoke Institutional to access our interactive economic indicators monitor and much more.
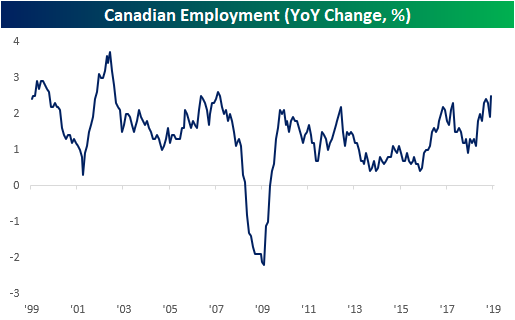
Canadian Employment Growth At Cycle High
While today’s Nonfarm Payrolls report in the US may have disappointed with only 130K added jobs compared to estimates of 160K, our neighbors north of the border got a very strong reading on their labor market. The number of employed persons in Canada grew by 81.1K in August with most of the added jobs being part-time work. This smashed estimates for a 20K increase and was a nice rebound from the prior month’s decline of 24.2K. Since August of last year when YoY growth was just 0.9%, the Canadian labor market has been growing more rapidly with the most recent reading showing a 2.5% increase from last year. That is the highest year-over-year growth rate of the cycle and the strongest since November 2007, right before the onset of the Financial Crisis. Start a two-week free trial to Bespoke Institutional to access our interactive economic indicators monitor and much more.
Next Week’s Economic Indicators – 9/6/19
Despite a shortened week from the Labor Day holiday, there was a heavy slate of economic data with a total of 30 releases. Half of these came in better than estimates or the prior period’s reading while another 13 missed or weakened. Three indicators were in line with estimates. There was a lot of manufacturing data this week including readings from Markit and the ISM, Factory Orders, Durable Goods, and Capital Goods. The ISM reading was the most strikingly negative of these as it showed a contractionary reading. The ISM and Markit service counterparts, on the other hand, showed healthier levels, but the Markit PMI did miss estimates. Labor data also was a major focus this week and the overall results were pretty mixed. ISM employment, initial jobless claims, and today’s NFP report all disappointed, but the ADP employment change, continuing claims, and labor force participation rate came in stronger than expected. Similarly, each indicator for wages including quarterly unit labor costs and average earnings showed improvements.
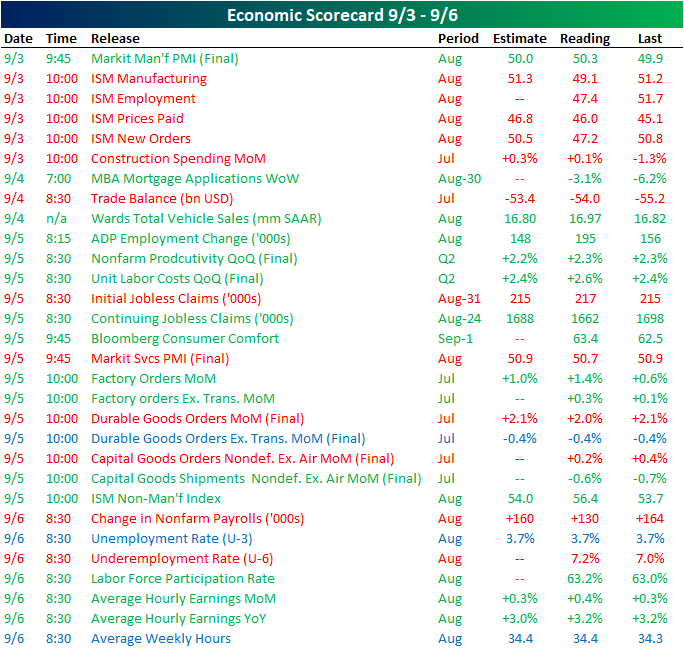
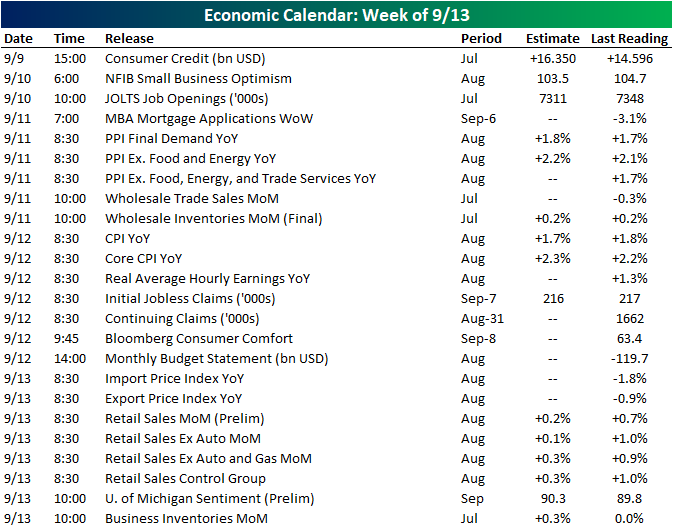
It will be slightly less busy next week with only 24 releases scheduled. Following up on this week’s labor data, the JOLTS report is due out Tuesday morning and is expected to show fewer job openings than June. Inflation indicators like PPI, CPI, and export and import prices make up a considerable portion of next week’s data. Core estimates for both PPI and CPI are forecasted to show higher price inflation in August. In addition to preliminary consumer sentiment, on Friday we will also get a reading on retail sales for August. For both core and headline readings, this indicator is expected to slow significantly MoM compared to July. Start a two-week free trial to Bespoke Institutional to access our interactive economic indicators monitor and much more.
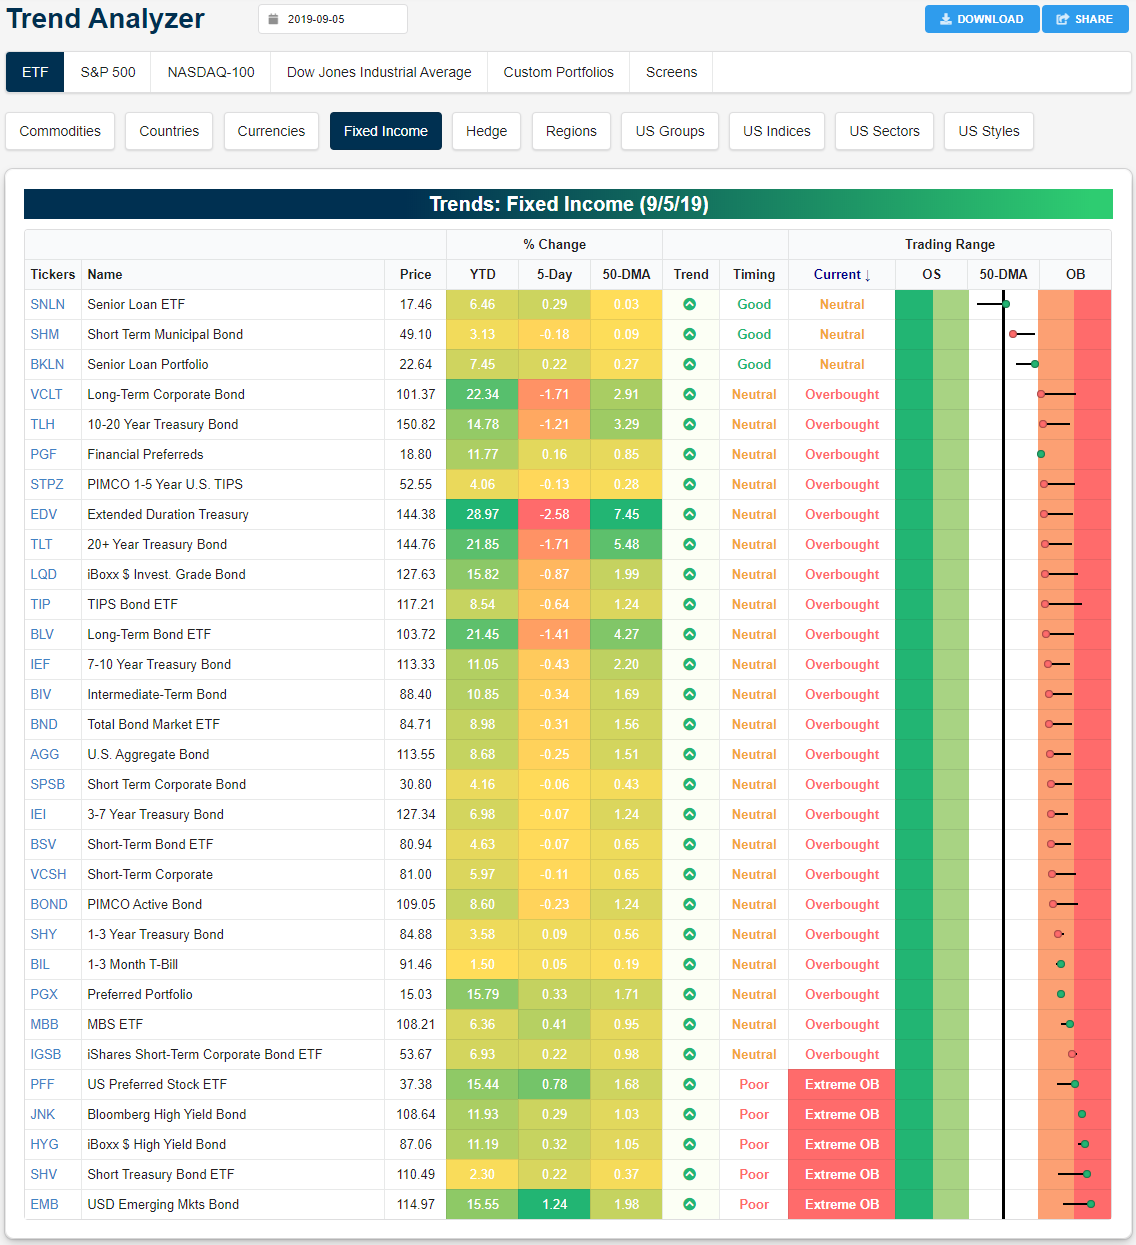
Trend Analyzer – 9/6/19 – Stocks No Longer Oversold
For the first time since August 1st, not a single major index ETF in our Trend Analyzer is oversold. This comes as the Micro-Cap ETF (IWC) finally closed within one standard deviation of its 50-DMA yesterday. As with other small caps like the Russell 2000 (IWM) and Core S&P Small-Cap ETF (IJR), even though IWC has worked off of its oversold levels, it has still yet to move back above its 50-DMA. IWC is also the only index ETF currently in a downtrend. Granted, the trends of the other major indices still leave a lot to be desired considering only the S&P 500 is in an uptrend.

While stocks have worked off of the past month’s persistent oversold readings, fixed income has yet to do the reverse. Although there has been a some mean reversion with most fixed income ETFs lower than where they were a week ago, the vast majority are overbought. As investors have begun to put risk back on, preferred stocks (PFF), High Yield (JNK and HYG), Short Treasury Bonds (SHV), and Emerging Market Bonds (EMB) have actually become extremely overbought. Of these, EMB has rallied the most with a 1.24% gain. On the other hand, the long end of the curve has been met with more intense selling. The Long-Term Corporate Bond ETF (VCLT), 10-20 Year Treasury Bond ETF (TLH), 20+ Year Treasury Bond (TLT), Long-Term Bond ETF (BLV), and Extended Duration Treasury ETF (EDV) are all down well over 1% over the past week. EDV has been met with the worst of these declines as it has fallen 2.58%. This is after the ETF was the most extended above its 50-DMA and has risen the most so far in 2019. Start a two-week free trial to Bespoke Institutional to access our Trend Analyzer and much more.