Investors Keep Thinking Positive
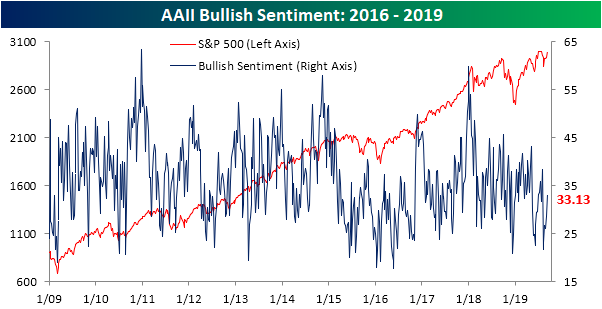
As the S&P 500 broke and held above its August range in the past week, sentiment has shifted more positive. The percentage of investors reporting as bullish in AAII’s weekly survey rose from 28.64% last week up to 33.13%. That is the highest since August 1st when 38.44% reported bullish sentiment. With two consecutive weeks of improvements, bullish sentiment is now well off of its lows from the second week of August (21.66%) and is back within a normal range relative to its historical average of 38%. This week marks the sixth straight week with below average bullish sentiment.
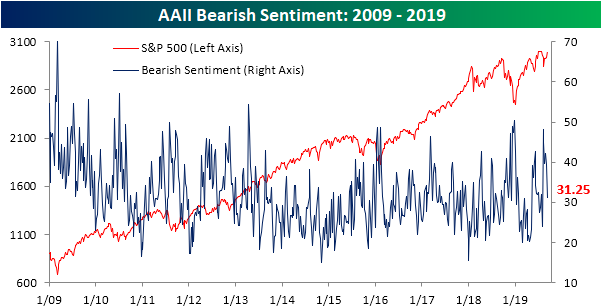
Inverse to bullish sentiment, bearish sentiment is now the lowest that it has been since the first week of August. With bearish sentiment falling 8.26 percentage points this week to 31.25%, it was the largest drop since June 13th’s 8.38 percentage point decline.
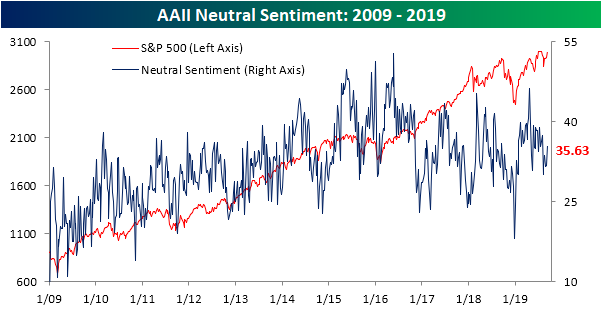
Although most of the loss in bearish sentiment went to bulls, a predominant share of investors remain neutral. Ticking up to 35.63% this week, neutral sentiment remains above its historical average (31.52%) as it has for five weeks in a row and 31 of the total 36 weeks this year. This was also the first time that neutral sentiment has outweighed both bulls and bears since the end of July. Start a two-week free trial to Bespoke Institutional to access our interactive economic indicators monitor and much more.
One Man’s Trash…
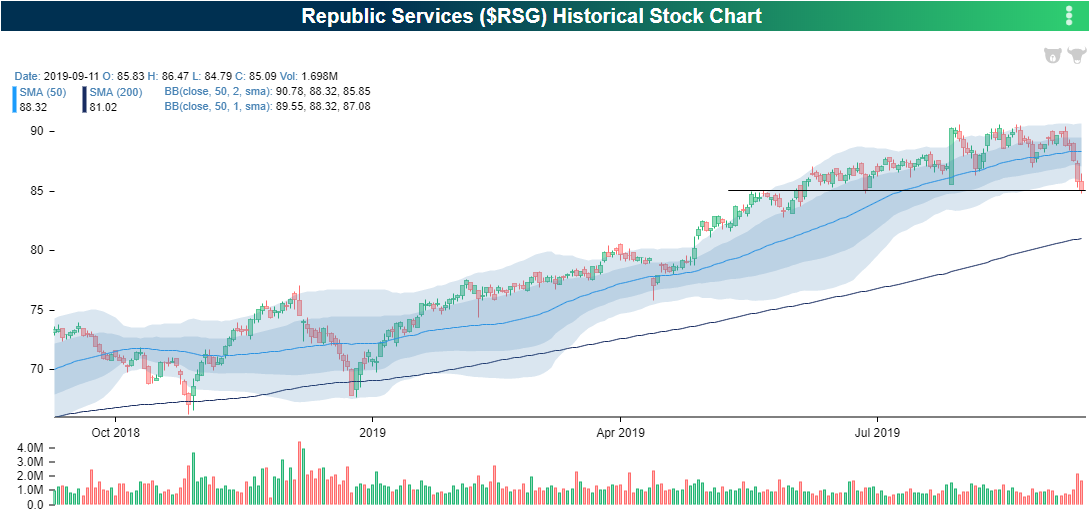
We have all heard the saying one man’s trash is another man’s treasure. When it comes to literal garbage stocks — Waste Management (WM) and Republics Services (RSG) — that saying is more than applicable today. After trading in strong uptrends this year through August, both WM and RSG have had a rough September with month-to-date declines of 4.9% and 3.5%, respectively. The strong performance YTD and big drops this month puts these stocks in good company with the rest of the momentum world. Recent declines brought both stocks to the bottom of their trading ranges as each closed yesterday in extremely oversold territory (over 2 standard deviations below their 50-DMAs). Given the strong long-term uptrends and this pullback, RSG and WM earned perfect timing scores in our Trend Analyzer tool. Today, those declines have ceased as the stocks found support at prior lows that were first established in the spring. Start a two-week free trial to Bespoke Institutional to access our Trend Analyzer, Security Analysis tool, and much more.

The Bespoke 50 Top Growth Stocks
Every Thursday, Bespoke publishes its “Bespoke 50” list of top growth stocks in the Russell 3,000. Our “Bespoke 50” portfolio is made up of the 50 stocks that fit a proprietary growth screen that we created a number of years ago. Since inception in early 2012, the “Bespoke 50” has beaten the S&P 500 by 112.5 percentage points. Through today, the “Bespoke 50” is up 230.5% since inception versus the S&P 500’s gain of 118.0%. Always remember, though, that past performance is no guarantee of future returns. To view our “Bespoke 50” list of top growth stocks, please start a two-week free trial to either Bespoke Premium or Bespoke Institutional.

Chart of the Day: Style & Size
Throw It All Out the Window
It’s time to throw all those financial “mumbo jumbo” ratios out the window. That’s right. You can take your P/E, P/B, P/S ratios and send them out packing with EV/EBITDA and the PEG ratio. While you’re at it, why don’t you free up some space and toss out all those finance textbooks you bought in college and grad school. None of it matters. At least not this week where making money in the market has been as simple as “buy low and sell high.”
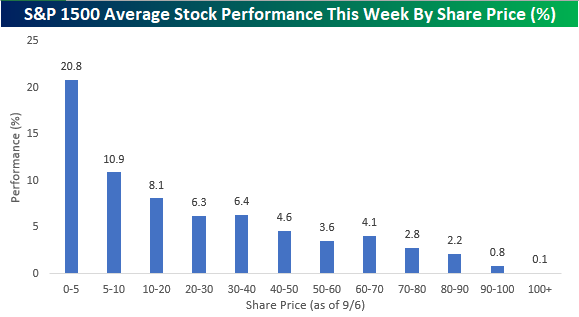
Through yesterday’s close, the S&P 1500, which is comprised of large-caps (S&P 500), mid-caps (S&P 400), and small-caps (S&P 600), was up just under 1% on the week. The average week to date performance of individual stocks in the index, however, was a much more impressive gain of 5%. By far the biggest gains have come from the stocks with the lowest share prices. Coming into the week, there were 55 stocks in the S&P 1500 that had share prices of less than $5, and through Wednesday’s close, they were up an average of 21% with 54 of 55 in the black. 21%!!!! Coming into today, there were also seven stocks in the S&P 1500 that were already up over 40% this week, and guess what? They all came into the week with share prices below $5.
Looking at the performance of individual stocks this week shows that share prices appear to have been a key driver of performance. In the chart below, we grouped stocks in the S&P 1500 based on their share prices as of last Friday and then calculated the average performance of the stocks in each group so far this week (through Wednesday’s close). While stocks with share prices of less than $5 per share were up an average of 20.8%, the performance of stocks priced between $5 and $10 per share were up a still impressive 10.9%. What’s even crazier about this chart is the fact that as you move out to the right (higher share prices), average performance consistently weakens to the point where stocks with high share prices ($100+) have only gained an average of 0.1% so far this week. Who needs Alphabet (GOOGL), Amazon (AMAZN) and Chipotle (CMG) when you could have had JC Penney (JCP), Dean Foods (DF), or Mallinckrodt (MNK). If these high priced stocks know what’s good for them, they better start announcing 10-1 splits pronto! (That was a joke.)
In all seriousness, the performance numbers listed below further illustrate this week’s massive rotation out of momentum strategies, where stocks and sectors that had been leading have been sold off while those that had lagged or been written off for dead have seen some buying interest or at least an easing of selling pressure. All the textbooks and financial ratios in the world may provide comfort to analysts and investors, but they don’t help at all when the momentum tide turns. Start a two-week free trial to Bespoke Premium for our most actionable investment ideas.
Lowest Jobless Claims Since the 60’s
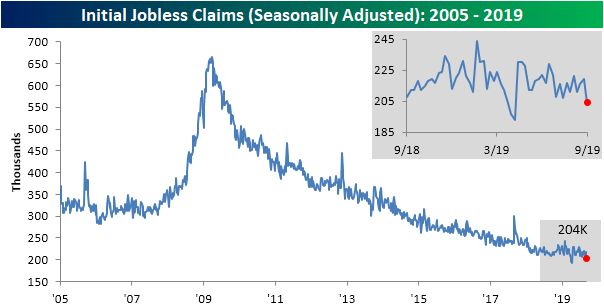
After Friday’s weaker than expected Nonfarm Payrolls report, today’s initial jobless claims release is setting a different tone for labor data. Initial jobless claims were expected to see a modest decline to 215K this week after rising for two straight weeks. Instead, claims came in well below estimates falling to 204K. Not only was this well below last week’s upwardly revised 219K (the largest week-over-week decline since May 10th’s 16K decline) and forecasts, but it was also the lowest print since April’s 193K. Important to note, those April lows were the lowest readings in around 50 years. Although that low from only a few months ago was not taken out, jobless claims still appear healthy with this week’s data bringing it back below the past few months’ range. The overall claims reading is also now more within tangible reach of those aforementioned 50-year lows. Furthermore, SA jobless claims have now spent 236 consecutive weeks at or below 300K and 101 weeks at or below 250K; both the longest streaks on record.
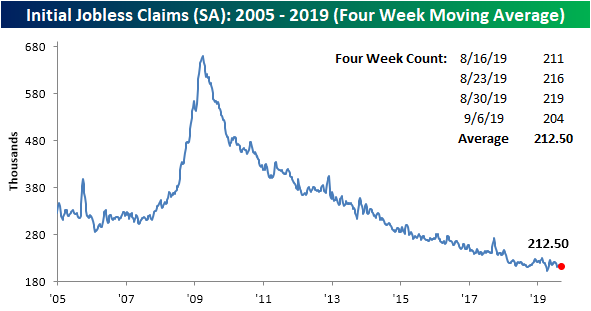
As we mentioned in a note last week, today’s release was likely to see a move lower in the four-week moving average because a recent high of 221K from early August would be rolling off the count. Between that and the exceptionally low number this week, the four-week moving average experienced a 4.25K decline which was its largest decline since mid-July (-5.5K). We would caution though that one week does not necessarily make a trend. The average now sits at 212.5K, which is an improvement from August, but it is also not yet any sort of dramatic new low as with other reads on this indicator. The moving average is now back to where it was only in late-July/early August. Additionally, the moving average is actually 0.75K higher than it was for the current week last year.
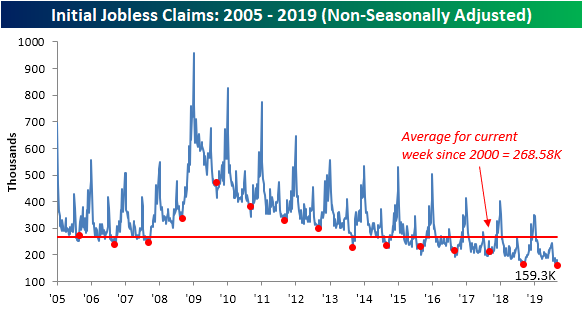
We have mentioned in recent weeks that due to seasonal effects we usually see the yearly low in NSA claims at this time of year. As a result, this would give a good read on how this year’s lows stack up to prior years. The NSA number did not disappoint, dropping to 159.3K. Not only was this 3.3K lower than the comparable week last year, but was also the lowest reading for any given week of the current cycle. Even more impressive, this was the lowest reading for the NSA data in just under 50 years. The last time NSA initial jobless claims were at or below 159.3K was back on October 18th, 1969 when the number was 155K. That was also only a month after the indicator’s all-time low of 133K. Start a two-week free trial to Bespoke Premium for our most actionable investment ideas.
Bespoke’s Morning Lineup – ECBuying
See what’s driving market performance around the world in today’s Morning Lineup. Bespoke’s Morning Lineup is the best way to start your trading day. Read it now by starting a two-week free trial to Bespoke Premium. CLICK HERE to learn more and start your free trial.

Small Cap Surge
Small caps have been serial underperformers versus the large-cap S&P 500 over the last 12+ months, but they’re having their day in the sun this week. Not only has the small-cap Russell 2,000 risen more than 1% for three consecutive trading days to start the week, but the index has also outperformed the S&P 500 by more than one percentage point on each of the last three days.
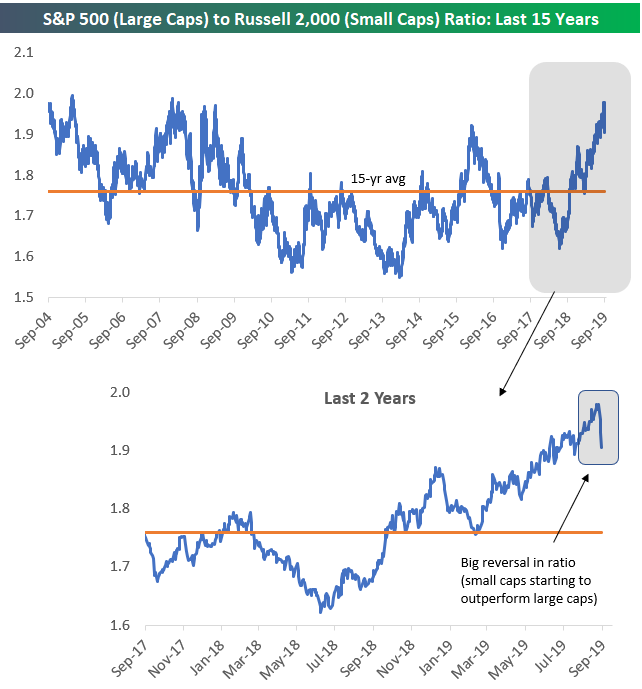
If this is the start of a longer-term small cap resurgence, there is certainly a lot of runway left. Below is a chart of the ratio between the S&P 500 and the Russell 2,000 over the last 15 years. When the line is rising, the S&P is outperforming the Russell. When the line is falling, the Russell is outperforming the S&P.
As you can see in the chart, the S&P has been outperforming the Russell for the last year, and the ratio got extended to the very top of its 15-year range at the start of September. Since peaking earlier this month, however, the ratio has fallen dramatically as small caps have started to outperform. Even after the recent small-cap outperformance, the ratio remains well above its long-term average. Start a two-week free trial to Bespoke Premium for our most actionable investment ideas.
The Closer – Real Yield Run, Russell Reverts, Corporate Data, Election Odds – 9/11/19
Log-in here if you’re a member with access to the Closer.
Looking for deeper insight on markets? In tonight’s Closer sent to Bespoke Institutional clients, we begin with a look at the rip higher in real yields and the Russell 2000. Turning to macroeconomic data, we review today’s PPI data which showed disinflation in Health Care. Next, we get a read on industrial production through Fastenal’s (FAST) monthly sales data. We also show the slowing capex of FAANG stocks before reviewing this week’s EIA data. We finish with what betting sites are showing for the presidential election.

See today’s post-market Closer and everything else Bespoke publishes by starting a 14-day free trial to Bespoke Institutional today!