B.I.G. Tips – CAT Sales Stuck in Neutral
S&P 500 Nearing ATHs But Individual Sectors Not So Much
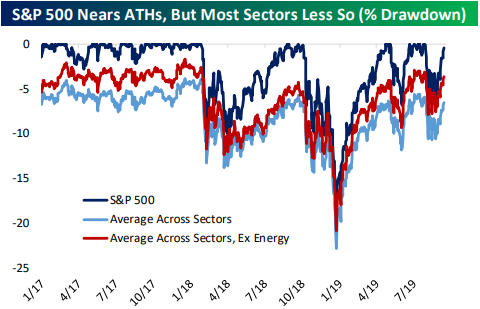
The past week has been a solid run for the US equity market as a whole. The S&P 500 continues to edge ever closer to prior all-time highs; opening today within half a percent of this level. As shown in the chart below, on average across all sectors, though, it is a little bit less optimistic. The average sector is still 6.5% below record highs. Excluding energy, which is by far the furthest (in terms of price and time) from its all-time high, the average across sectors jumps up to 3.6%. Consumer Staples and Utilities are the only sectors within 1% of their highs while the Tech sector is not far behind only 1.5% away. Start a two-week free trial to one of Bespoke’s three membership levels to receive our most actionable research.
B.I.G. Tips – Mixed Retail Sales Report
Betting Markets and the Election
One way to keep track of the evolving Presidential primaries and general election news is the website electionbettingodds.com which shows what the betting market is predicting for upcoming election outcomes. In the charts below, we show the current probabilities of a primary and general election win for each of the various candidates (officially announced and otherwise) with a 1% or higher chance of winning. Elizabeth Warren now has a commanding lead in the Democrats’ primary with a 34.9% chance of victory with Biden and Sanders in second and third.

Where things get more interesting is to figure out which candidates have the best chance of winning the general election assuming they win their primary. For example, President Trump’s odds of winning his primary are 88.1%, but his odds of winning the general election for the Presidency are priced at 43.7%.

By dividing that 43.7% by the 88.1% chance of primary victory we can get to a 49.6% general election pricing assuming the candidate wins their primary. This conditional probability probably shouldn’t be taken too seriously, but it’s got some interesting results. Among candidates polling over 5%, Beto O’Rourke has the highest odds (80%) of a general election win if he takes the primary while other Democratic hopefuls Andrew Yang and Bernie Sanders are priced at 60%+ odds. Biden’s general election odds are at 55% if he wins the primary, while Warren — the current front runner — is at 49.9%. Notably, although Trump is close at 49.6%, no Republican has a conditional priced probability over 50% to win the general.
All of that said, these conditional relationships can be very unstable and are complicated to arbitrage, so we probably shouldn’t place too much faith in the detail of their message, but it’s still interesting to see that markets are implicitly optimistic about the electability of a candidate like Sanders or Yang relative to more mainstream candidates like Warren, Harris, or Biden. Start a two-week free trial to one of our three membership levels to receive Bespoke’s most actionable ideas.

Copper Unconsolidated
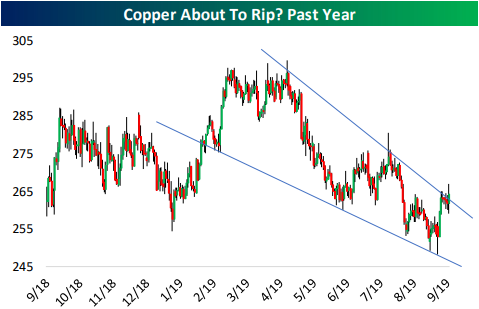
In last night’s Closer, we noted the recent price action of copper. Over the past several months, copper had been consistently moving lower in a solid downtrend, but that downtrend has been broken this week. Finishing up about 1% in yesterday’s session, copper had its first close above resistance which would suggest a further move higher. We’re seeing additional gains today as the commodity continues to break out. Over the next few weeks, copper bulls will look for a series of higher highs and higher lows that would eventually form a new uptrend. Start a two-week free trial to one of our three membership levels for Bespoke’s most actionable research.
Bespoke’s Morning Lineup – Busy Economic Day
See what’s driving market performance around the world in today’s Morning Lineup. Bespoke’s Morning Lineup is the best way to start your trading day. Read it now by starting a two-week free trial to Bespoke Premium. CLICK HERE to learn more and start your free trial.

Dividend Stock Spotlight: Steel Dynamics (STLD)
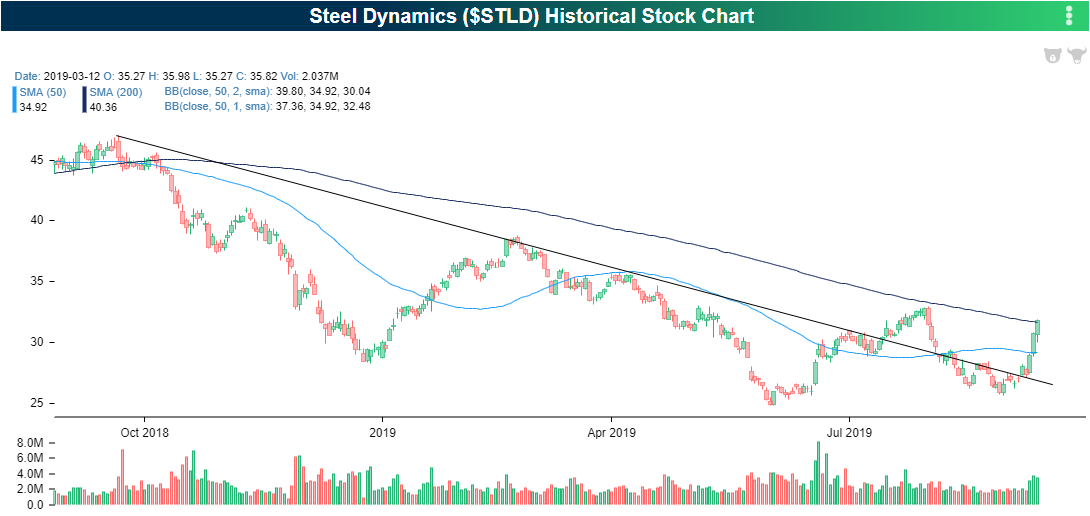
For the first time since last October, Steel Dynamics (STLD) closed above its 200-DMA yesterday. This comes after the stock has remained in a long term downtrend over the past year after the first round of tariffs on steel were imposed. Although the company is not out of the woods yet on the political front, this long term downtrend was broken earlier this summer. Afterward, the stock pulled back to retest its downtrend. STLD then made a higher low at the end of August (8/27), and has since risen over 23%. In the process, STLD not only took out its 50-day moving average, but it also closed marginally above its 200-DMA, holding above there today.
Even with the recent move higher, STLD’s yield remains attractive. With a current yield of just under 3%—$0.24 per share paid quarterly—the dividend yield is higher than both the average for the broader S&P 1500 and the Materials sector which are 1.76% and 1.96%, respectively. In regards to other S&P 1500 steel companies, along with Nucor (NUE), STLD has the joint highest dividend yield. The growth rate of STLD’s dividend has also outpaced the sector dramatically. The dividend grew by 24.82% over the past year and 13.7% over the past five years. By both measures, this is nearly twice the growth rate of other stocks in the sector. That growth has been in spite of the past year and a half’s trade headwinds. Furthermore, with the dividend payout ratio at 27.36%, the company still has plenty of cushion to pay shareholders in the event that earnings do decline. Start a two-week free trial to Bespoke Institutional to access our interactive Security Analysis tool and much more.

The Closer – 10-Year Rally, Copper Coil, ECB and Banks, US Data Dump – 9/12/19
Log-in here if you’re a member with access to the Closer.
Looking for deeper insight on markets? In tonight’s Closer sent to Bespoke Institutional clients, we begin by seeing just how common a seven consecutive day rally in the 10-year yield is as well as the difference between the S&P 500 and its individual sectors in regards to all-time highs. We then show the implications of ECB policy on European banks. We also finish with a slug of economic data including Bloomberg Consumer Comfort, CPI, Continuing Claims, and the monthly budget balance.

See today’s post-market Closer and everything else Bespoke publishes by starting a 14-day free trial to Bespoke Institutional today!
Bespoke’s Sector Snapshot — 9/12/19
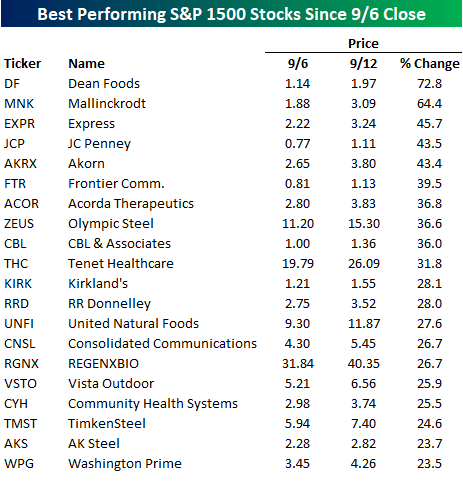
best and WORST S&P 1500 Stocks Since 9/6
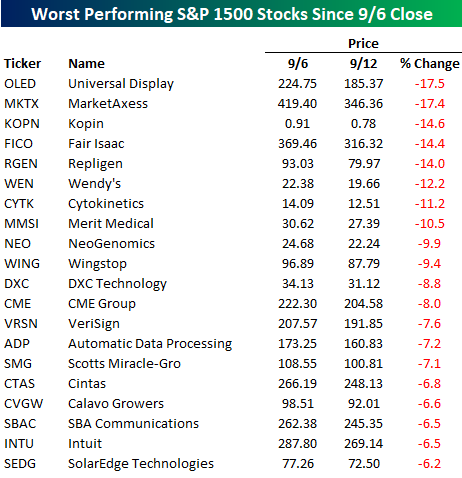
This week has been all about little is big and big is little in terms of stock performance. Take the lists of best and worst performing S&P 1500 stocks since last Friday’s close. The first table below shows the 20 best performing S&P 1500 stocks since the close last Friday. The fact that there are more than 20 stocks in the S&P 1500 that are up over 20% already this week is notable in itself. Even crazier, though, is that when you look at the share prices of these stocks, all but seven have current share prices of less than $5 per share even after their gains this week, and the average share price of the 20 stocks listed is just $7.42. Also, as we noted in an earlier post, it’s not as if there are tons of stocks in the S&P 1500 trading below $5 per share. Heading into today, there were only 55 and 54 of them were up on the week.
Turning to the list of losers so far this week, while there are more than 20 stocks that are up over 20%, not a single stock in the index is down 20% and only eight are down more than 10%. Besides the fact that the stocks listed below are down so far this week and the ones above are up, the other major and pretty consistent difference between the two lists is their share prices. As of today, the average price of the 20 biggest losers so far this week is $135.74 which is more than 18 times the average share price of the biggest week to date winners. Start a two-week free trial to Bespoke Premium for our most actionable investment ideas.