ChatGPT and Netscape Keep Track
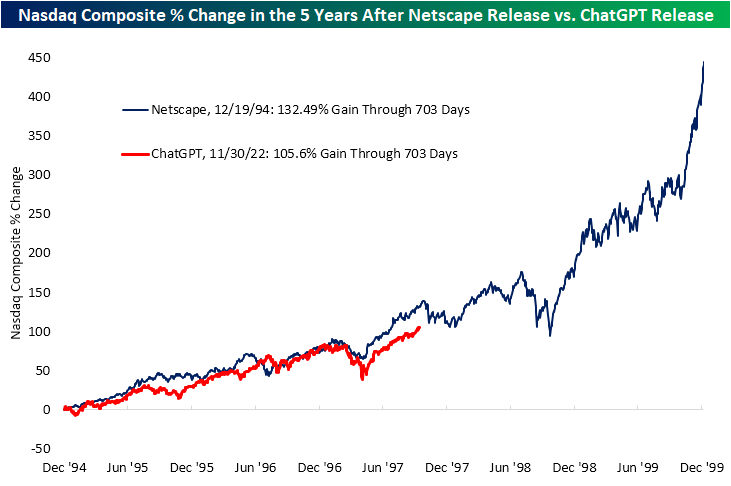
If history does not repeat itself, it can at least rhyme. One good example of this has been the performance of the Tech-heavy Nasdaq since the AI era began in earnest with the release of ChatGPT in November 2022. In our chart below that we first published in early 2024, we show the move in the Nasdaq Composite since ChatGPT’s release and compare that to the move in the index following the release of the first modern web browser, NetScape, in December 1994.
As the chart shows, the moves in the Nasdaq following the release of ChatGPT and Netscape have been eerily similar. Putting a number to it, the two lines have an astoundingly high correlation coefficient of 0.95. For a refresher from your 101 statistics class, a coefficient of 1 would indicate the two lines move identically; so for real world statistics, this is about as close as it gets!
In terms of absolute performance, the rally in the Nasdaq has been slightly weaker this go around than it was in the 1990s. Since the release of ChatGPT, the Nasdaq has risen 105%, which compares to a 132.5% gain for the index from December 19, 1994 up through the next 703 trading days (through 9/29/1997). The index doubling in a little more than a two and a half year span is impressive in its own right. With that said, if these two lines were to continue to track one another down the road, history would suggest that there is still plenty of steam left in the rally.

Q3 2025 Earnings Conference Call Recaps: FedEx (FDX)
Bespoke’s Conference Call Recaps use AI to summarize lengthy earnings calls. The commentary below is AI-generated and then edited by Bespoke for quality control. As always, none of these summaries should be construed as recommendations to buy or sell any securities, and investors should do their own research and/or consult with a financial professional before making any investment decisions.
Our latest recap available to Bespoke subscribers covers FedEx’s (FDX) Q1 2026 earnings call.
![]()
FedEx (FDX) is a global logistics company spanning express air, ground parcel, and LTL freight, plus digital supply-chain platforms (Dataworks, fdx, Surround). It serves SMBs, large enterprises, and healthcare, moving about 17 million packages per day and generating roughly 2 petabytes of data and 100 billion transactions that offer a real-time read on trade flows and consumer demand. In the first quarter of fiscal 2026, management balanced a resilient US parcel market with mounting global trade frictions tied to the removal of de minimis exemptions: consolidated revenue grew 3% YoY while Federal Express Corporation revenue rose 4%. FedEx reduced trans-Pacific Asia outbound capacity by roughly 25% and shifted lift to Asia–Europe, helping International Priority and Economy Freight revenue grow 14%, and it deepened domestic share with small business and healthcare wins, including Best Buy as primary national parcel carrier and Amazon onboarding targeted for completion by the third quarter. Network 2.0 has optimized about 360 stations with roughly 18% of US volume on the model. FDX shares were up as much as 7.4% after hours on 9/18 in reaction to better-than-expected results…
Continue reading our Conference Call Recap for FDX by becoming a Bespoke Institutional subscriber. You can sign up for Bespoke Institutional now and receive a 14-day trial to read our newest Conference Call Recap. To sign up, choose either the monthly or annual checkout link below:
Bespoke Stock Profile: Credo Technology (CRDO)
Small-Caps Finally Make New High
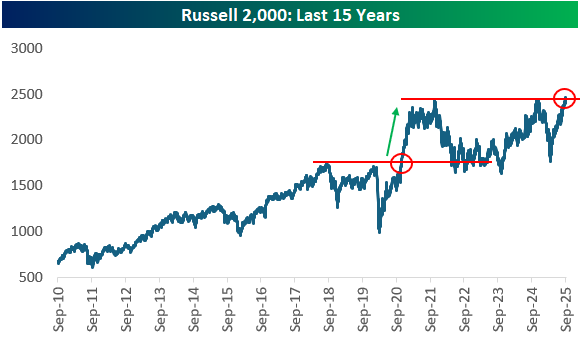
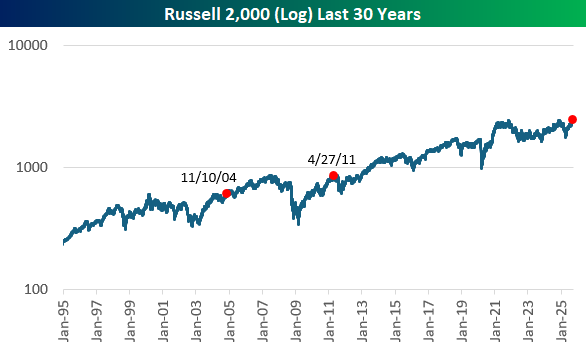
Yesterday, the small-cap Russell 2,000 finally managed to close at a new all-time high when it broke above prior peaks made in December 2024 and December 2021. The last time the index had a breakout after a long period without one was in late 2020 following the COVID Crash. Back then, the index made a huge leg higher after the breakout. Small-cap bulls would love to see a repeat.
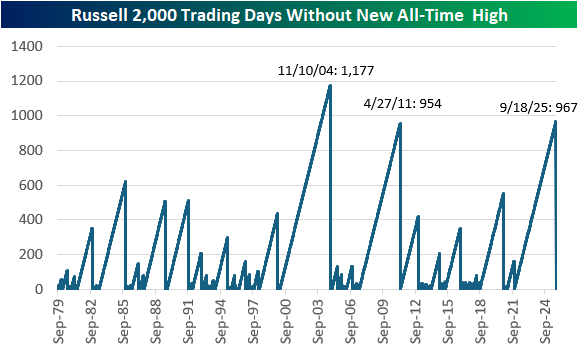
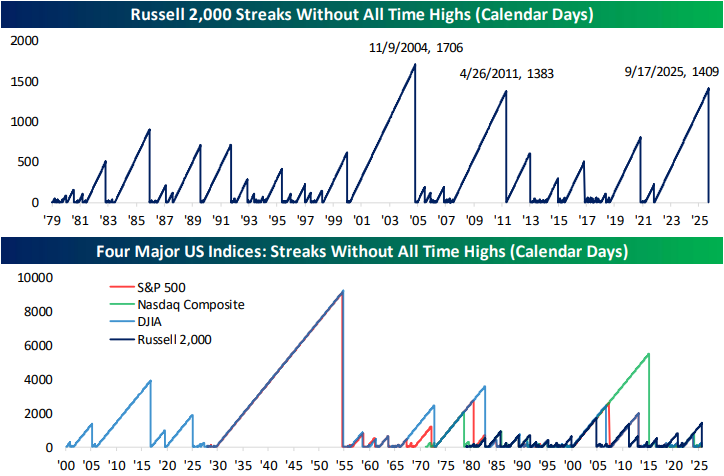
Yesterday also marked the end of a 967-trading day streak without a new all-time high for the Russell 2,000. It was the second-longest streak without a new all-time high in the index’s history behind the 1,177 day streak that ended in November 2004. The only other comparable streak was the 954 trading days it went without a new high that ended on April 27th, 2011.
Below is a log chart of the Russell with red dots marking the end of the two prior long streaks without new all-time highs mentioned above. Following the 2004 streak, the index continued to chug along higher, but the index saw a pretty nasty sell-off in the months following the end of the 2011 streak.
Bespoke Morning Lineup – 9/19/25
See what’s driving market performance around the world in today’s Morning Lineup. Bespoke’s Morning Lineup is the best way to start your trading day. Read it now by starting a two-week trial to Bespoke Premium. CLICK HERE to learn more and start your trial.
“Language fits over experience like a straight-jacket.” – William Golding

Below is a snippet of commentary from today’s Morning Lineup. Start a two-week trial to Bespoke Premium to view the full report.
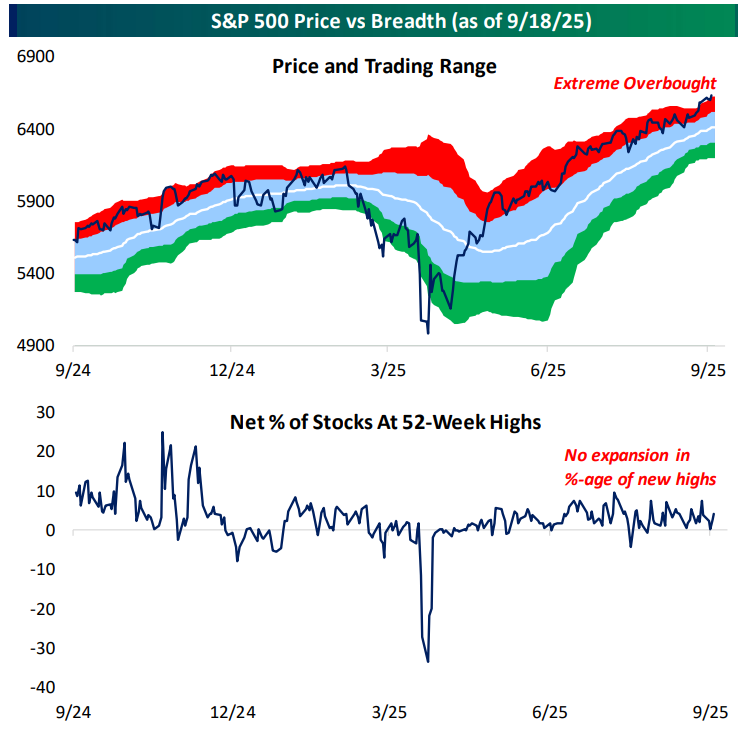
It’s important to continue to note that the S&P is trading in extreme overbought territory, but there hasn’t been a similar move with underlying breadth. Yet another breadth indicator that remains totally neutral is the percentage of stocks in the S&P trading at new 52-week highs.
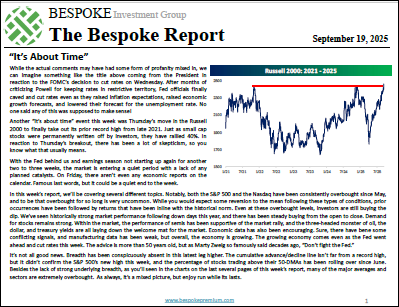
The Bespoke Report – 9/19/25 – “It’s About Time”
To read our weekly Bespoke Report newsletter and access everything else Bespoke’s research platform offers, start a two-week trial to Bespoke Premium. This week, we review the consistently overbought nature of the market, demand for equities, the FOMC’s resumption of rate cuts, the state of the economy, where breadth stands, and finally, a review of one and five-year charts of the major indices, sectors, and asset classes. Give it a read!

The Closer – Russell’s New High, Courts, Valuations – 9/18/25
Log-in here if you’re a member with access to the Closer.
Looking for deeper insight into markets? In tonight’s Closer sent to Bespoke Institutional clients, we begin with a look at the Russell 2,000’s breakout to fresh all time highs, comparing its streak without a high to similar streaks of the past (page 1). Next, we review today’s news surrounding the Supreme Court, Fed Governor Cook, and tariffs (page 2). We then delve into equity market valuations (pages 2 and 3) before shifting into macro data that includes claims (page 4), TICS (page 5), regional Fed Manufacturing gauges (page 6), and freight volumes and prices (page 7).
See today’s full post-market Closer and everything else Bespoke publishes by starting a 14-day trial to Bespoke Institutional today!
Bespoke’s Weekly Sector Snapshot — 9/18/25
Chart of the Day: NVIDIA (NVDA) Falls Behind
Bespoke’s Morning Lineup – 9/18/25 – Slow Moving Rally
See what’s driving market performance around the world in today’s Morning Lineup. Bespoke’s Morning Lineup is the best way to start your trading day. Read it now by starting a two-week trial to Bespoke Premium. CLICK HERE to learn more and start your trial.
“He who waits to do a great deal of good at once will never do anything.” – Samuel Johnson
Below is a snippet of commentary from today’s Morning Lineup. Start a two-week trial to Bespoke Premium to view the full report.
Investors apparently slept on the Fed’s announcement yesterday and woke up in a good mood. The S&P 500 is on pace to open up by 0.75% this morning, while the Nasdaq is on track to open up by more than 1%, and small caps are leading the way with a gain of 1.25%. The US strength follows what was a mostly positive night in Asia, where China was the only country to trade lower, while Japan and Korea both shot higher by over 1%. The strength in Japan came even as Machinery Orders fell 4.6% m/m compared to forecasts for a drop of just 1.8%. In Europe, stocks are also higher across the board as the STOXX 600 rallies 0.8%.
This morning in the US, there’s little in the way of earnings data, and the only reports on the economic calendar are jobless claims at 8:30 and the Philly Fed and Leading Indicators at 10 AM.
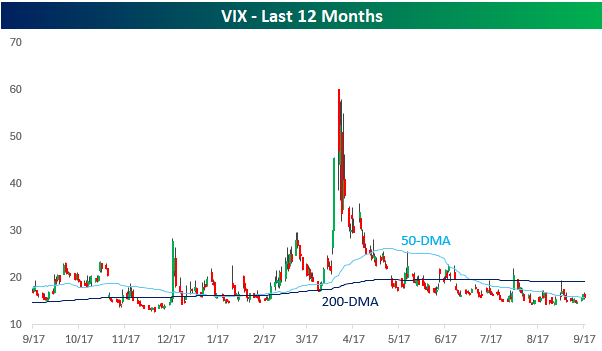
Like the quote above, the market’s grind higher for the last several months has been more gradual than a move concentrated into a handful of days. There are several ways to illustrate this, and we’ll start with the VIX. At 14.8 this morning, the VIX is on pace for its lowest close since late August, not exactly a level you would expect for what historically has been one of the most volatile months of the year. As shown in the chart below, if the VIX was an EKG, we’d be putting a sheet over the patient as it has flatlined since first falling back below its 200-DMA in June.
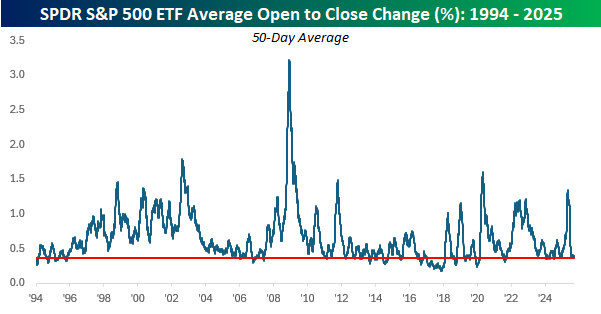
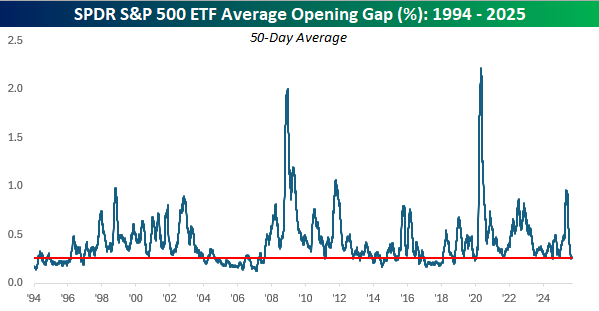
In addition to the low VIX, another example of the gradual moves is by looking at the S&P 500’s average opening gap. Using SPY as a proxy, the S&P 500’s average change at the open relative to the prior days’ close over the last 50 trading days has been 0.25%, and there has only been one day when the S&P 500 gapped up or down more than 1% (9/2/25: -1.17%). After volatility at the open rocketed to the highest levels since COVID back in April, the average daily change has sunk like a stone to some of the lowest levels of the last five years.
Just as volatility has been subdued at the opening bell, it has also been tamed during regular trading hours. Just like the average opening gap, intraday volatility shot higher in April only to come crashing down in the summer to around the lowest levels of the last five years. The old cliché says to never short a dull market, and that’s the only piece of advice an investor has needed over the last few months.