Daily Sector Snapshot — 7/21/25
Q2 2025 Earnings Conference Call Recaps: Domino’s Pizza (DPZ)
Bespoke’s Conference Call Recaps use AI to summarize lengthy earnings calls. The commentary below is AI-generated and then edited by Bespoke for quality control. As always, none of these summaries should be construed as recommendations to buy or sell any securities, and investors should do their own research and/or consult with a financial professional before making any investment decisions.
Our latest recap available to Bespoke subscribers covers Domino’s Pizza (DPZ) Q2 2025 earnings call.
![]()
Domino’s Pizza (DPZ) is the largest pizza company in the world by global retail sales, operating a heavily franchised model across more than 90 markets. Known for its delivery and carryout focus, the company produces and sells a range of pizzas, pastas, chicken, and side items through its extensive store network. Domino’s is a case study in digital transformation within QSR, with over 85% of US orders placed digitally and a global supply chain that supports consistent execution. Domino’s delivered 3.4% US same-store sales growth in Q2, driven by strong traction from the launch of Parmesan-Stuffed Crust, its most complex product yet. The company completed its nationwide rollout on DoorDash and expects it to be a meaningful comp driver in the second half of the year, joining Uber Eats to round out its aggregator strategy. Carryout growth hit a record 5.8%, boosted by its revamped Domino’s Rewards program. Executives emphasized Domino’s positioning to win on value during a pressured consumer backdrop. Global net store growth totaled 178, including 30 in the US, with strong performance in India and Canada helping offset macro risks abroad. DPZ shares opened 4.5% higher on 7/21, but gains were completely wiped out intraday after missing estimates on the top and bottom lines…
Continue reading our Conference Call Recap for DPZ by becoming a Bespoke Institutional subscriber. You can sign up for Bespoke Institutional now and receive a 14-day trial to read our newest Conference Call Recap. To sign up, choose either the monthly or annual checkout link below:
Q2 2025 Earnings Conference Call Recaps: American Express (AXP)
Bespoke’s Conference Call Recaps use AI to summarize lengthy earnings calls. The commentary below is AI-generated and then edited by Bespoke for quality control. As always, none of these summaries should be construed as recommendations to buy or sell any securities, and investors should do their own research and/or consult with a financial professional before making any investment decisions.
Our latest recap available to Bespoke subscribers covers American Express’ (AXP) Q2 2025 earnings call.
![]()
American Express (AXP) is a global payments company best known for its premium charge and credit cards, financial services, and travel-related offerings. It issues cards, operates a proprietary merchant network, and earns revenue from both card fees and discount rates on transactions. The company gives unique insight into discretionary consumer spending, especially among younger, high-income, and international segments. AXP reported record revenue of $17.9B (+9% YoY) and EPS of $4.08 (+17% YoY ex-Accertify). Gen-Z and Millennial spend surged 40% and 10% respectively, and transaction growth held strong at +9%. Despite softening in airline and lodging categories, overall cardmember spend remained resilient. The upcoming US Platinum card refresh was a major theme, with AXP reaffirming its leadership in the premium space and defending its pricing power amid rising competition. The company also discussed exiting its Amazon and Lowe’s co-brand portfolios, double-digit international growth, and early moves in digital currency through a new Coinbase partnership. The stock declined 2.4% on 7/18 despite better-than-expected results…
Continue reading our Conference Call Recap for AXP by becoming a Bespoke Institutional subscriber. You can sign up for Bespoke Institutional now and receive a 14-day trial to read our newest Conference Call Recap. To sign up, choose either the monthly or annual checkout link below:
Another 1,000 Point Level Bites the Dust
For the first time this year but the third time since the 2024 election, the Nasdaq Composite is on the cusp of closing above another 1,000-point threshold as the index crossed 21,000 for the first time earlier today. In the table below, we list the date that the Nasdaq first closed above each 1,000-point threshold since first closing above four-digit territory 30 years ago in July 1995.
After first closing above 1,000 in July 1995, it took another three years for the Nasdaq to breach the 2,000 level, but 1,000 points for the Nasdaq isn’t what it used to be. Back then, the Nasdaq had to double to get from 1,000 to 2,000, but the latest 1,000 points required a gain of just 5%.
Of all the different 1,000-point thresholds, the only one the Nasdaq crossed and never looked back from was 6,000 in April 2017. That was also the 1,000-point threshold with the longest span between crosses as it took more than 17 years to get there. At the other extreme, the 1,000-point threshold with the most crosses was 2,000 with 65, while the shortest span between different 1,000-point levels was the 27 days it took to cross from 11,000 to 12,000 in the summer of 2020.
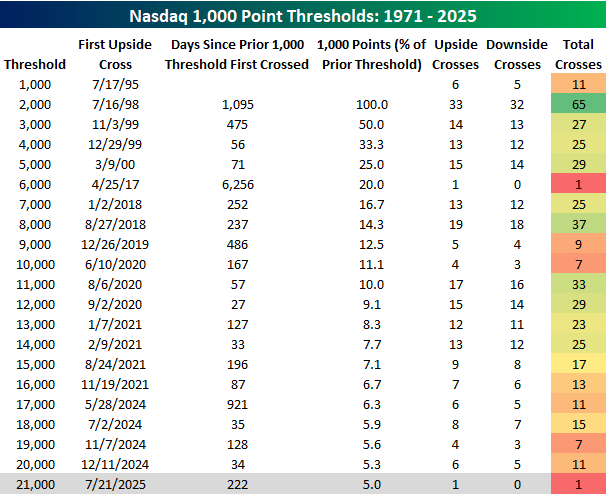
The long-term chart of the Nasdaq below shows when each 1,000-point threshold was first crossed along with the number of days between each one. After a period of 921 days without a new 1,000 point threshold, since the Nasdaq first closed above 17,000, it has crossed a new level four more times.
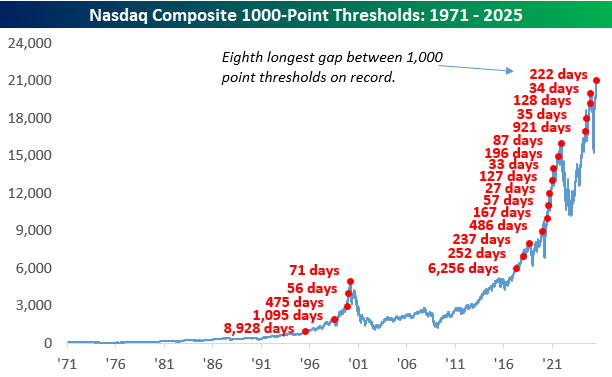
As mentioned above, 1,000 points isn’t what it used to be, and the Nasdaq’s price history on a log scale illustrates that as each 1,000-point level is more closely bunched together as the index rises over time. After requiring a rally of 100% to get from 1,000 to 2,000, it now takes a rally of less than 5% (and even less with each successive level reached) to reach a new 1,000 point threshold.
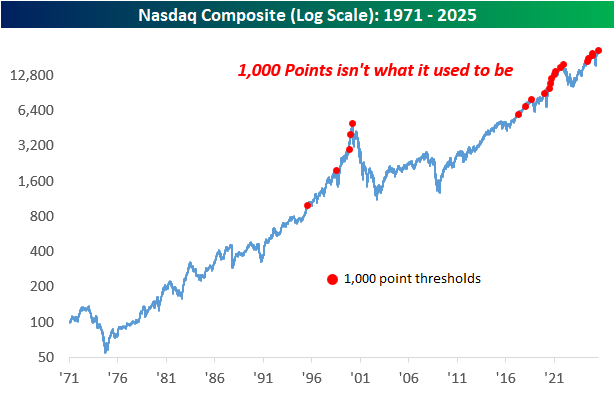

Chart of the Day: Trump Two-Step…But Not Because of Trump
Q2 2025 Earnings Conference Call Recaps: 3M (MMM)
Bespoke’s Conference Call Recaps use AI to summarize lengthy earnings calls. The commentary below is AI-generated and then edited by Bespoke for quality control. As always, none of these summaries should be construed as recommendations to buy or sell any securities, and investors should do their own research and/or consult with a financial professional before making any investment decisions.
Our latest recap available to Bespoke subscribers covers 3M’s (MMM) Q2 2025 earnings call.

3M is a global industrial and technology company known for its diversified portfolio spanning over 60,000 products across safety, healthcare, consumer goods, electronics, and manufacturing. It serves a range of customers, from hospitals and governments to contractors and big-box retailers, offering everything from adhesives and abrasives to air filtration and medical tapes. What makes 3M impressive is its relentless focus on applied science and operational scale, launching 126 new products in the first half of 2025 alone. The company provides unique insights into global industrial trends, supply chain dynamics, and innovation-led margin expansion. 3M delivered strong Q2 results, with adjusted EPS of $2.16 (+12% YoY) and free cash flow of $1.3B. Key drivers included a 70% YoY increase in product launches (64 in Q2), expansion of a global commercial excellence initiative, and operational improvements. The macro backdrop remains “sluggish,” but 3M sees momentum from internal execution, particularly in industrial, auto, and electrical markets. Tariff impacts are now baked into guidance, offset by pricing power and sourcing changes. Full-year EPS guidance was raised to $7.75–$8.00, with margin expansion and >100% free cash flow conversion expected. In reaction to earnings on 7/18, shares of MMM traded down 3.7%…
Continue reading our Conference Call Recap for MMM by becoming a Bespoke Institutional subscriber. You can sign up for Bespoke Institutional now and receive a 14-day trial to read our newest Conference Call Recap. To sign up, choose either the monthly or annual checkout link below:
Bespoke’s Morning Lineup – 7/21/25 – Positive Start to the Week
See what’s driving market performance around the world in today’s Morning Lineup. Bespoke’s Morning Lineup is the best way to start your trading day. Read it now by starting a two-week trial to Bespoke Premium. CLICK HERE to learn more and start your trial.
“Happiness in intelligent people is the rarest thing I know.” – Ernest Hemingway

Below is a snippet of commentary from today’s Morning Lineup. Start a two-week trial to Bespoke Premium to view the full report.
Stocks are poised to open the week higher this morning as we gear up for a busy week of earnings. The only economic indicator on the calendar this morning is Leading Indicators at 10 AM. In terms of earnings, we’ve already gotten reports from Cleveland Cliffs (CLF), Domino’s Pizza (DPZ), Roper (ROP), and Verizon (VZ). The only one of the four that missed EPS forecasts was DPZ, while it was the only one to miss estimates (barely) on the top line. After the close, the most notable reports on the calendar are Crown (CCK), NXP Semiconductors (NXPI), Steel Dynamics (STLD), and WR Berkley (WRB).
Outside of the US, Asian markets were mostly higher, while Japan was closed. Japan’s ruling party lost its majority in the weekend elections. While Asia was mostly higher, Europe is sitting on some modest losses in early trading with the STOXX 600 down 0.2%. Trade and tariffs continue to dominate the headlines there as the August 1st deadline approaches, and President Trump is pushing for 15% to 20% tariffs on all European imports.
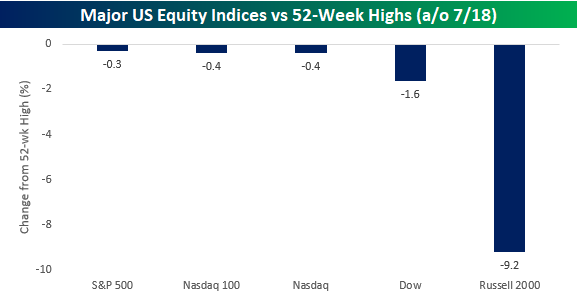
While the S&P 500, Nasdaq 100, and Nasdaq Composite all closed out the week within 1% of 52-week highs last Friday, the Dow Jones Industrial Average remains a little further off at 1.6%. The small-cap Russell 2000 remains in a league of its own, near correction territory at 9.2% below its 52-week high. Not all US equity indices are created equal.
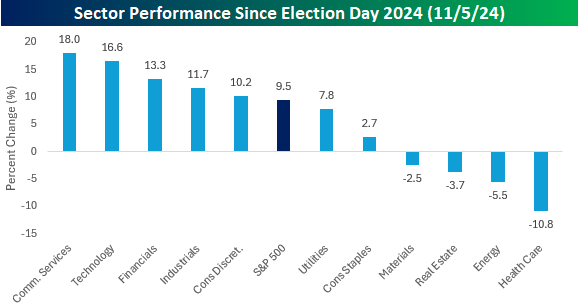
At the sector level, the haves vs have-nots is even more pronounced. Last Friday, just three sectors – Utilities, Technology, and Industrials – closed within 1% of their respective 52-week highs. After these three, Financials, Communication Services, and Consumer Staples closed out the week between 1% and 5% below their respective 52-week highs.
Nearly half of the S&P 500 sectors, however, remain more than 5% from their respective highs, including Energy (-11.7%) and Health Care (-16.3%), which are still deep in correction territory. While the Energy sector’s weight of 2.97% in the overall index is nearly inconsequential, the Health Care sector still has a respectable weighting of right around 9%.
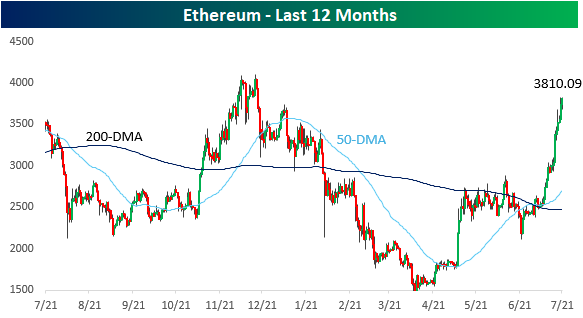
Outside of equities, the crypto space has been strong, and here, there’s been a relative rotation where the formerly overlooked Ethereum has been surging. After trading at $1,500 in April and below $2,500 as recently as July 4th, Ethereum is back up above $3,800 for the first time this year.
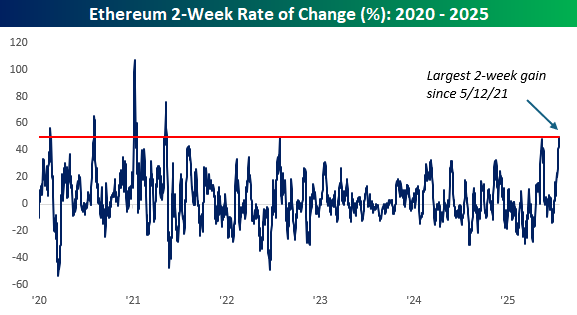
Based on where it’s trading this morning, Ethereum has rallied just over 50% in the last two weeks, which would put it on pace for the largest 14-day gain (crypto doesn’t take weekends off) in more than four years.
Brunch Reads – 7/20/25
Welcome to Bespoke Brunch Reads — a linkfest of some of our favorite articles over the past week. The links are mostly market-related, but there are some other interesting subjects covered as well. We hope you enjoy the food for thought as a supplement to the research we provide you during the week.
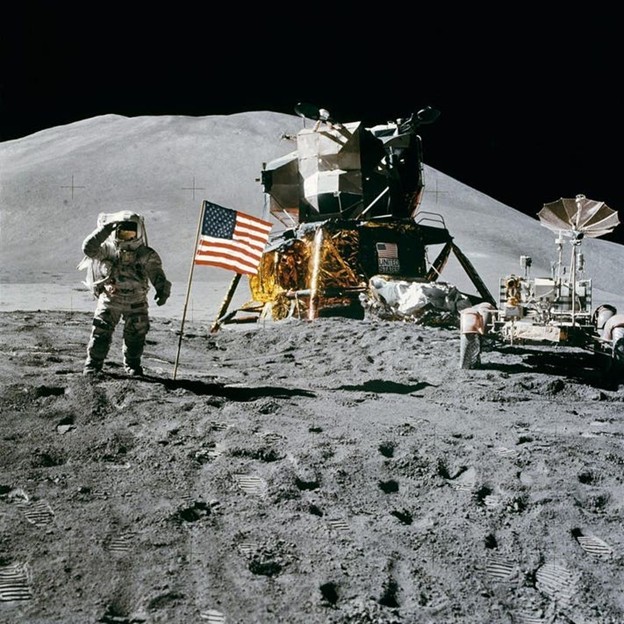
One Small Step for Man: On the night of July 20, 1969, Neil Armstrong and Buzz Aldrin set foot on the moon. Neil Armstrong was a former test pilot from Ohio, and delivered the famous line, “That’s one small step for man, one giant leap for mankind.” Aldrin follow him out onto the lunar surface, and together, they spent about two and a half hours exploring, collecting rock samples, and planting the American Flag. As the centerpiece of NASA’s Apollo 11 mission, the achievement was the result of intense engineering, political will, and human bravery in the middle of the Cold War between the United States and the Soviet Union. It fulfilled President John F. Kennedy’s 1961 promise to send an American safely to the Moon before the decade’s end. The grainy black-and-white footage broadcast live across the globe captured the milestone where the once impossible became reality.
Business
Are Diamonds Even a Luxury Anymore? De Beers Reckons With Price Plunge (WSJ)
De Beers CEO Al Cook is fighting to preserve the mystique of natural diamonds as lab-grown stones flood the market. Synthetic diamonds now account for over half of US engagement ring sales and have driven down prices across the board, pushing De Beers to shutter its lab-grown line and double down on marketing natural stones as rare and meaningful. Despite the science being identical, Cook argues the romance and long-term value just aren’t the same, though for price-conscious buyers, the appeal of a bigger, shinier lab-grown gem at a fraction of the cost is hard to ignore. [Link]
Continue reading our weekly Brunch Reads linkfest by logging in if you’re already a member or signing up for a trial to one of our two membership levels shown below! You can cancel at any time.

The Bespoke Report – 7/18/25 – Global Macro Quarterly
To read our weekly Bespoke Report newsletter and access everything else Bespoke’s research platform offers, start a two-week trial to Bespoke Premium. This week, we are sending out our Global Macro Quarterly deck instead of our traditional Bespoke Report. This report is filled with dozens of charts reviewing the current state of the global economy and where it’s headed next. We review major central bank policy outlooks, global equity market earnings growth and valuations, the outlook for China and Europe, and go into detail on the US economy including a strong consumer backdrop, scenarios for the Federal Reserve, and the possibility of a reacceleration for labor markets. We also discuss tariffs, labor supply, and other policy-adjacent subjects. Give it a read!

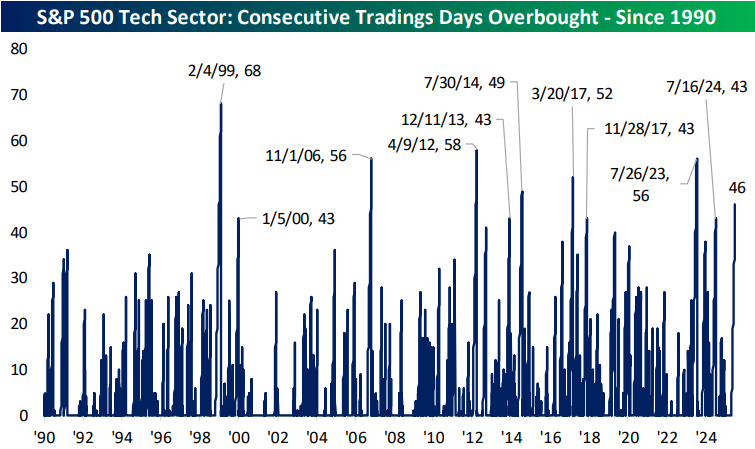
Tech Sector Overbought for 46 Trading Days and Counting
Below is a look at a one-year price chart of the S&P 500 Technology sector. The white line represents the sector’s 50-day moving average, while the light blue shading represents its “normal” trading range, which is a band that’s one standard deviation above and below the 50-DMA. The red shading is one to two standard deviations above the 50-DMA, which we consider “overbought” territory, and anything above the top of the red band is more than two standard deviations above the 50-day. The green shading is the opposite of the red zone: one to two standard deviations below the 50-DMA, which we consider “oversold.”
The Tech sector has now rallied 45% since its low point in early April, leaving it at all-time highs. The sector has also now closed in “overbought” territory for 46 straight trading days (heading into Friday).
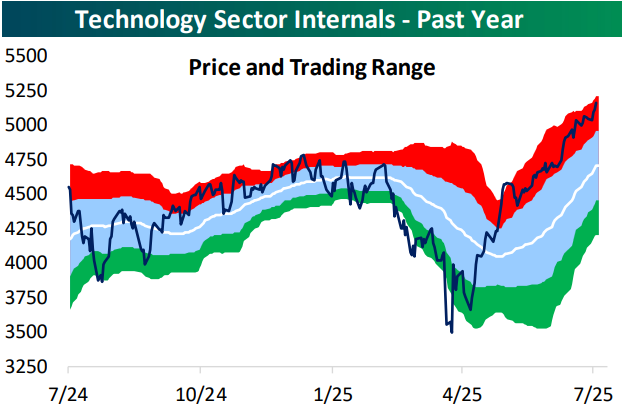
This is the 11th time since 1990 that the Tech sector has closed in overbought territory for at least 40 straight trading days. Yesterday we looked at how the sector has done going forward after prior lengthy overbought streaks in our post-market macro note, The Closer. You can read that report with proper access here.
The longest the Tech sector has remained in overbought territory is the 68-trading day streak that ended in February 1999. At its current level, the sector would need to fall 3.5% for the “overbought” streak to end, so unless we get a big drop early next week, it looks like the current streak will make it to the 50-day mark.