Q2 2025 Earnings Conference Call Recaps: Tesla (TSLA)
Bespoke’s Conference Call Recaps use AI to summarize lengthy earnings calls. The commentary below is AI-generated and then edited by Bespoke for quality control. As always, none of these summaries should be construed as recommendations to buy or sell any securities, and investors should do their own research and/or consult with a financial professional before making any investment decisions.
Our latest recap available to Bespoke subscribers covers Tesla’s (TSLA) Q2 2025 earnings call.
![]()
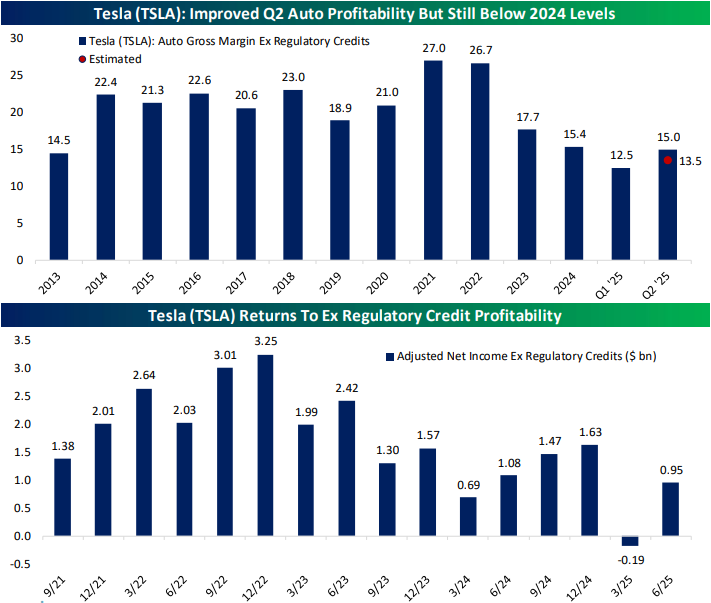
Tesla (TSLA) designs, manufactures, and sells electric vehicles, energy storage products, solar energy systems, and AI-powered software like Full Self-Driving (FSD). Its lineup includes the Model S, 3, X, Y, Cybertruck, and energy solutions like Powerwall and Megapack. Tesla is widely regarded as a pioneer in real-world AI, autonomous driving, and EV innovation. It serves global consumers and commercial clients, while also pushing into areas like humanoid robotics (Optimus) and chip development (Dojo, AI5). Tesla’s call centered around autonomy. The company officially launched its Robotaxi service in Austin and expects to expand to half the US population by year-end. FSD subscriptions rose 25% post-Version 12, though many owners still haven’t tried it. Musk confirmed production of Optimus 3 humanoid robots will begin early 2026, targeting 1 million units annually within five years. AI infrastructure also took focus. Tesla plans to deploy Dojo 2 at 100,000 H100-equivalent scale and roll out the powerful AI5 chip next year. Meanwhile, tariffs and the repeal of the US EV credit are pressuring margins, prompting a near-term affordability push. Musk suggested that the next few quarters could be “rough.” EPS results were in line with estimates and revenue beat estimates, though both figures fell YoY. The stock fell about 9% on 7/24…
Continue reading our Conference Call Recap for TSLA by becoming a Bespoke Institutional subscriber. You can sign up for Bespoke Institutional now and receive a 14-day trial to read our newest Conference Call Recap. To sign up, choose either the monthly or annual checkout link below:
Bespoke’s Weekly Sector Snapshot — 7/24/25
Bespoke’s Morning Lineup – 7/25/25 – Who Needs Harvard?
See what’s driving market performance around the world in today’s Morning Lineup. Bespoke’s Morning Lineup is the best way to start your trading day. Read it now by starting a two-week trial to Bespoke Premium. CLICK HERE to learn more and start your trial.
“Don’t confuse schooling with education. I didn’t go to Harvard, but the people that work for me did.” – Elon Musk

Below is a snippet of commentary from today’s Morning Lineup. Start a two-week trial to Bespoke Premium to view the full report.
It’s a mixed picture for US equities this morning, as Dow futures are poised to open down by about 0.4%, while the S&P 500 and Nasdaq are indicated to be higher. Helping to drive the gains in the Nasdaq and S&P 500, shares of Alphabet (GOOGL) are up over 3% after the company reported better-than-expected earnings and sales. To the downside, Tesla (TSLA), another trillion-dollar stock, or at least as of the close yesterday, is down 6% after CEO Elon Musk warned of “a few rough quarters” ahead.
The mixed picture for US stocks follows a positive session in Asia, where the Nikkei rallied over 1.5% while Chinese stocks also finished the session in positive territory as trade deals start to emerge. European equities were also positive on prospects of trade deals ahead of the August 1 deadline. Flash PMI readings for July came in roughly in line with expectations. The ECB also announced its latest policy decision, and as expected, there was no change in rates.
Turning back to the US, another CEO, like Elon Musk, who didn’t go to Harvard, is the current Starbucks (SBUX) CEO and former Chipotle (CMG) CEO Brian Niccol. Since it was announced that the Miami University (Ohio) alum would be leaving Chipotle for Starbucks, the former’s stock has had a rough go, and its four earnings reports since then haven’t been particularly positive either.
After the close yesterday, CMG reported inline EPS on weaker-than-expected revenues. The revenue miss was the fourth straight time it missed top-line expectations, and the stock is on pace to gap down close to 10% at the open this morning. Besides the four straight sales misses, CMG will have now gapped down 5%+ in reaction to three of its last four earnings reports.
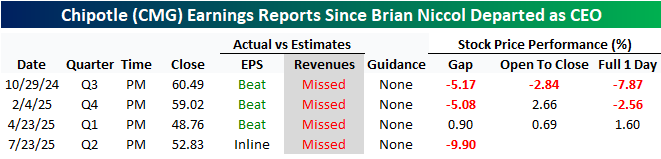
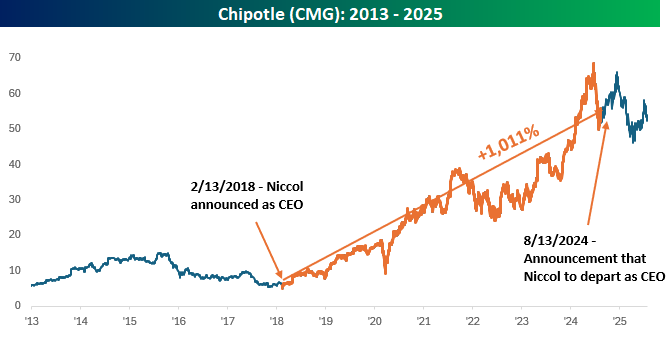
Including this morning’s decline, shares of CMG are down over 15% since it was announced that Niccol would be leaving the company. Over that same period, the S&P 500 is up over 18%. All of this also comes after the stock rallied more than 1,000% during Niccol’s tenure as CEO. Whether all of CMG’s problems are a result of Niccol’s departure or he saw the writing on the wall could be up for debate, but his timing was impeccable, further burnishing his reputation. He came into the company just as it was reeling from food safety incidents in 2018, and while he didn’t get out right at the top, he didn’t miss it by much.
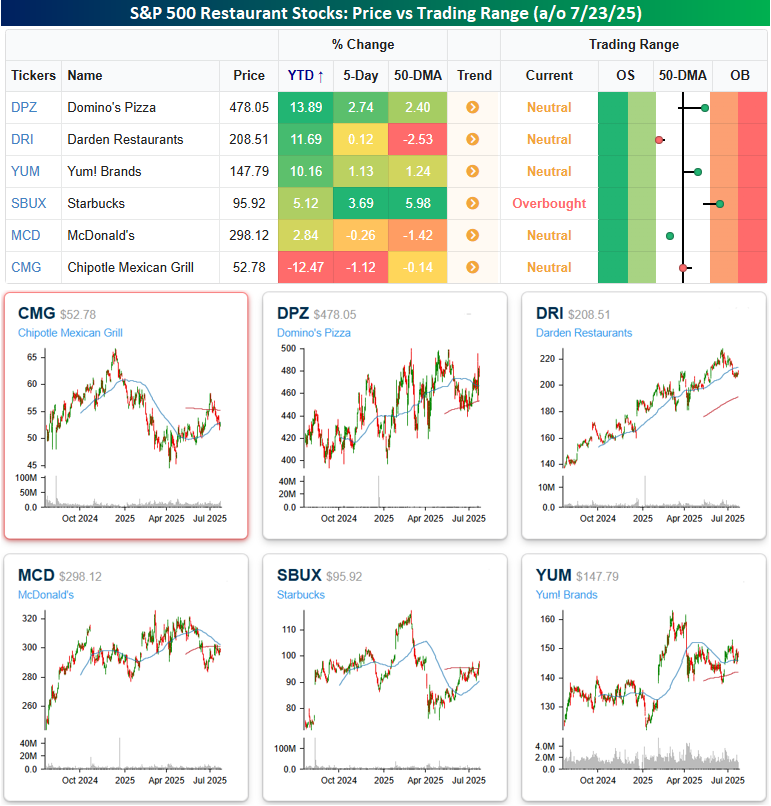
The snapshot below from our Trend Analyzer compares CMG to other restaurant stocks in the S&P 500. As of the close yesterday, stocks in CMG’s peer group were all up on the year, but CMG was down well over 10%, and that doesn’t even take into account this morning’s weakness.
Looking at the charts of all six stocks, CMG is also an outlier as no other stock in its group is closer to a 52-week low. SBUX is the second furthest from a 52-week high, so Niccol’s magic doesn’t appear to be coming through just yet.
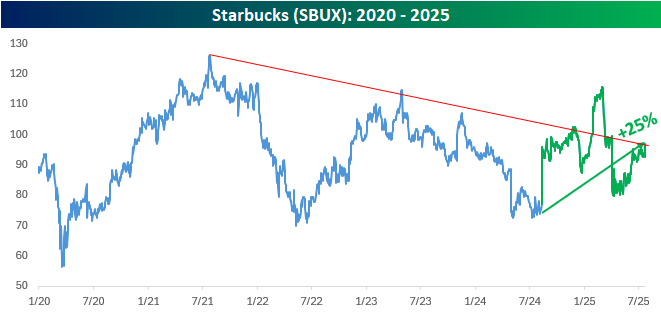
Speaking of SBUX, the stock has been stuck in a range for the last five years. Just as it was announced nearly a year ago that Niccol would be taking over the company, SBUX was testing the low end of its multi-year range. Since then, the stock has rallied 25%, which is modestly better than the S&P 500, but outside of a brief period earlier this year, the downtrend from its post-COVID high remains intact. Since it was announced that Niccol would be taking over as CEO last August, SBUX has reported weaker-than-expected EPS and revenues in two of the last three quarters, so his move to the CEO seat has yet to show any meaningful impact on results, but the next opportunity will be next Tuesday.
The Closer – Meme Stocks, GOOGL & TSLA, Delinquencies – 7/23/25
Log-in here if you’re a member with access to the Closer.
Looking for deeper insight into markets? In tonight’s Closer sent to Bespoke Institutional clients, we begin with another check in on the performance of meme stocks in addition to recent IPOs (page 1). After reviewing the latest earnings including results from Alphabet (GOOGL), Tesla (TSLA), and more (pages 2 and 3), we review today’s existing home sales data (page 4). We finish with a look into credit card delinquencies (page 5).
See today’s full post-market Closer and everything else Bespoke publishes by starting a 14-day trial to Bespoke Institutional today!
Q2 2025 Earnings Conference Call Recaps: General Dynamics (GD)
Bespoke’s Conference Call Recaps use AI to summarize lengthy earnings calls. The commentary below is AI-generated and then edited by Bespoke for quality control. As always, none of these summaries should be construed as recommendations to buy or sell any securities, and investors should do their own research and/or consult with a financial professional before making any investment decisions.
Our latest recap available to Bespoke subscribers covers General Dynamics’s (GD) Q2 2025 earnings call.
General Dynamics (GD) is a global aerospace and defense company that designs, builds, and supports advanced military systems and business aviation solutions. Its operations span four segments: Aerospace (Gulfstream and Jet Aviation), Marine Systems (submarines and surface ships), Combat Systems (armored vehicles, weapons, and munitions), and Technologies (IT services and mission-critical defense tech). The company serves the U.S. Department of Defense, allied governments, and corporate clients worldwide. Known for its long-cycle visibility and execution-focused culture, General Dynamics provides deep insight into defense modernization, national security infrastructure, and the global demand for secure mobility and digital capabilities. General Dynamics delivered a strong Q2, beating EPS expectations and $13B in revenue (+8.9% YoY). The quarter featured a record $28B in orders and $103.7B in backlog, led by a surge in Marine Systems contracts. Gulfstream delivered 38 jets, including 15 G700s, and will soon begin G800 deliveries, though lower-margin mix will pressure near-term Aerospace margins. General Dynamics Information Technology (GDIT) showed solid performance despite slower adjudications, while Combat Systems saw strength in European demand and munitions ramp-up…
Continue reading our Conference Call Recap for GD by becoming a Bespoke Institutional subscriber. You can sign up for Bespoke Institutional now and receive a 14-day trial to read our newest Conference Call Recap. To sign up, choose either the monthly or annual checkout link below:
Daily Sector Snapshot — 7/23/25
Chart of the Day – GOOGL Goes For 10 & Mega-Cap Earnings
Q2 2025 Earnings Conference Call Recaps: Lamb Weston (LW)
Bespoke’s Conference Call Recaps use AI to summarize lengthy earnings calls. The commentary below is AI-generated and then edited by Bespoke for quality control. As always, none of these summaries should be construed as recommendations to buy or sell any securities, and investors should do their own research and/or consult with a financial professional before making any investment decisions.
Our latest recap available to Bespoke subscribers covers Lamb Weston’s (LW) Q4 2025 earnings call.
![]()
Lamb Weston (LW) is one of the world’s largest producers of frozen potato products, supplying French fries and other potato-based snacks to global quick-service restaurants (QSRs), foodservice distributors, and retailers. Lamb Weston is a bellwether for consumer demand trends in the QSR and casual dining globally. Its insights into fry attachment rates, restaurant traffic, and category growth offer a window into broader consumer behavior and foodservice recovery. The company beat expectations behind strong global volume growth (+8% overall, with 4% in North America and 16% internationally) despite continued softness in restaurant traffic. While price/mix declined 4% due to promotional efforts in a competitive market, gains in smaller and retail accounts helped offset weakness from QSR hamburger chains. The company launched a $250M cost-savings plan and reaffirmed its “Focus to Win” strategy, targeting premium product segments and strategic markets. Inventory reduction and curtailments improved working capital, while GLP-1 concerns were downplayed. Fiscal 2026 guidance assumes flat traffic, continued pricing pressure, and tariff risks of about $25M. LW shares rose as much as 20% on 7/23 after posting EPS and revenue beats…
Continue reading our Conference Call Recap for LW by becoming a Bespoke Institutional subscriber. You can sign up for Bespoke Institutional now and receive a 14-day trial to read our newest Conference Call Recap. To sign up, choose either the monthly or annual checkout link below:
Q2 2025 Earnings Conference Call Recaps: GE Verona (GEV)
Bespoke’s Conference Call Recaps use AI to summarize lengthy earnings calls. The commentary below is AI-generated and then edited by Bespoke for quality control. As always, none of these summaries should be construed as recommendations to buy or sell any securities, and investors should do their own research and/or consult with a financial professional before making any investment decisions.
Our latest recap available to Bespoke subscribers covers GE Verona’s (GEV) Q2 2025 earnings call.
![]()
GE Verona (GEV) is a global energy infrastructure company focused on accelerating the electrification and decarbonization of the world’s power systems. It designs, manufactures, and services equipment across three major segments: Power (gas turbines, steam, nuclear, hydro), Wind (onshore and offshore turbines), and Electrification (grid hardware, software, and storage). With a $129 billion total backlog, the company plays a central role in modernizing energy systems, serving utilities, governments, and industrials worldwide. GE Vernova also provides early insight into how data centers, grid reliability, and renewable adoption are shaping global energy demand. GEV posted a strong quarter led by surging demand for gas turbines, steam upgrades, and electrification equipment, with Power segment orders up 44% and Electrification revenue up 20%. Aeroderivative turbine orders jumped from 1 to 27 YoY, fueled by data center demand. Wind remains challenged (–$300M YTD loss) but is nearing breakeven. Tariffs are tracking toward a $300–$400M hit in 2025, mostly in Offshore Wind. AI and automation investments are scaling up, including the acquisition of Alteia for grid orchestration. On better-than-expected results, GEV shares climbed more than 12% on 7/23…
Continue reading our Conference Call Recap for GEV by becoming a Bespoke Institutional subscriber. You can sign up for Bespoke Institutional now and receive a 14-day trial to read our newest Conference Call Recap. To sign up, choose either the monthly or annual checkout link below:
Q2 2025 Earnings Conference Call Recaps: Capital One (COF)
Bespoke’s Conference Call Recaps use AI to summarize lengthy earnings calls. The commentary below is AI-generated and then edited by Bespoke for quality control. As always, none of these summaries should be construed as recommendations to buy or sell any securities, and investors should do their own research and/or consult with a financial professional before making any investment decisions.
Our latest recap available to Bespoke subscribers covers Capital One’s (COF) Q2 2025 earnings call.

Capital One (COF) is a leading US-based financial services company offering a broad range of consumer and commercial banking products, including credit cards, auto loans, savings accounts, and commercial lending. Known for its pioneering use of data and technology, Capital One has evolved into a tech-driven financial institution serving over 100 million customers. The company’s recent acquisition of Discover adds a powerful payments network and deepens its presence in cards, consumer lending, and digital banking. What sets Capital One apart is its vertically integrated model, combining credit issuance, banking, and now a proprietary payment network backed by a decade-long investment in cloud-based infrastructure and AI capabilities. This quarter was dominated by the completion of the Discover acquisition on May 18. The deal added $2B in revenue but also drove a $6.4B net loss, primarily due to an $8.8B provision build. Executives emphasized the integration is on track, though costs are trending above the initial $2.8B estimate. Management reiterated confidence in long-term earnings power and synergy realization. Notably, Capital One is aggressively investing in AI, international network expansion, and its premium credit card offerings like Venture X. The company also began migrating its debit volume to the Discover Network, a major strategic shift with long-term upside. Shares of COF traded up nearly 2% on its earnings reaction day on 7/23.
Continue reading our Conference Call Recap for COF by becoming a Bespoke Institutional subscriber. You can sign up for Bespoke Institutional now and receive a 14-day trial to read our newest Conference Call Recap. To sign up, choose either the monthly or annual checkout link below: