The Closer – AI-Pocalypse, Overbought Tech, Wages – 7/31/25
Log-in here if you’re a member with access to the Closer.
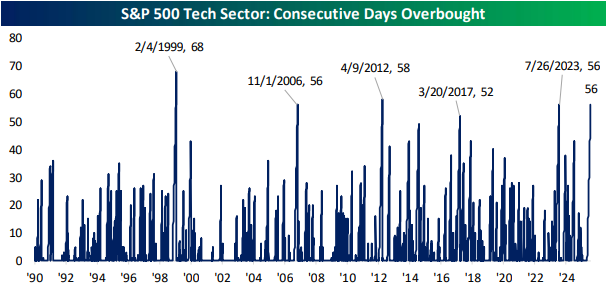
Looking for deeper insight into markets? In tonight’s Closer sent to Bespoke Institutional clients, we lead off with a look at a handful of the biggest winners of the AI trade in addition to the intraday reversal in the S&P and Nasdaq (page 1). Pivoting back to AI, we then look at the consistent string of overbought readings in our AI Basket (page 2). We follow up with a rundown of the latest earnings (pages 3 and 4) and then switch over to economic data including a look at jobless claims (page 5), personal income and spending (page 6), and the Employment Cost Index (page 7).
See today’s full post-market Closer and everything else Bespoke publishes by starting a 14-day trial to Bespoke Institutional today!
Top Quotes from Today’s Earnings Calls: 7/31/25
We sifted through earnings calls from the biggest companies that reported since last night’s (7/30) close, looking for some of the most interesting macro-related quotes from management teams that may serve as broader signals about the state of the economy, consumers, and markets. Below are twenty of the most revealing quotes that we pulled from this batch of calls, offering a window into what executives are seeing across industries and geographies right now.
- Microsoft (MSFT): “We are going through a generational tech shift with AI… Every GPU requires storage and compute. That ratio is another thing that is really exponential for infrastructure growth… Just like the server-to-cloud transition was an expansion of usage, the AI transition is an expansion of compute — orders of magnitude more. As long as you do that, usage goes up, and that’s what shows up in the results.” – Satya Nadella, CEO
- Ford (F): “We increasingly see Europe, North America, and Asia becoming regional businesses with tariff rates that are aligned for those 3 or 4 regions. And I believe that is a very long-term change… It’s happening with electrification and CO2 requirements. And it will happen as well as the Chinese OEMs go global and start to localize outside of China, and they’ll pick the regions and the regions will pick them.” – James Farley, CEO
- Meta Platforms (META): “There are all these questions that people have about what are going to be the timelines to get to really strong AI or superintelligence or whatever you want to call it… each step along the way so far, we’ve observed the more kind of aggressive assumptions, or the fastest assumptions have been the ones that have most accurately predicted what would happen… we think that this is going to really shape all of our systems sooner rather than later… there’s just a very high chance it seems like the world is going to look pretty different in a few years from now… So yes, I mean, we’re just going to push very aggressively on all of that.” – Mark Zuckerberg, CEO
- Qualcomm (QCOM): “Consistent to what we have been saying, we’re starting to see AI use cases on phones to gain traction… What AI is doing is making connectivity more relevant again, especially because of voice utilization, is driving more computing, more capable devices and exactly changing the use cases. And the rate of utilization, it’s very encouraging… I expect that to continue to accelerate.” – Cristiano Renno Amon, CEO
- Mastercard (MA): “The strength of cross-border as well as domestic spend is a function of how consumer health is. And right now, we’re seeing the consumer to be in very good shape… We also mentioned about how commercial is actually performing well, and you know that commercial actually also lends to our cross-border metrics.” – Sachin Mehra, CFO
- Cognizant Technology (CTSH): “I see health care as an opportunity… which hasn’t as much embraced technology, and it has been fragmented all the way from payer, providers and pharmacies zone.” – Ravi Kumar Singisetti, CEO
- Lam Research (LRCX): “As AI performance requirements continue to demand these greater capabilities, we’re just seeing increased [wafer fabrication equipment] in the etch and deposition spaces… you need approximately 30% more wafers to produce an equivalent number of bits when you move from 3D to 4D. Similarly, SSD speeds… that’s being directly put in for performance… higher performance for SSDs, higher run speeds. So I think that everywhere these kind of packaging capabilities are being leveraged for performance and next-gen capabilities.” – Timothy Archer, CEO
- MGM Resorts (MGM): “International visitation has been an issue, not only for Las Vegas, but a lot of destinations. Particularly earlier in the year with Canada… we saw visitation down. I think Southern California this summer has laid quiet more than it historically has.” – William Joseph Hornbuckle, CEO
- Builders FirstSource (BLDR): “Our sense is builders are slowing on the start side. And without a clear indicator that interest rates are going to move any time soon, I think in the best case scenario, it’s going to be a little while. It probably won’t help this year. Our sense is that that slowing, that resetting to a lower rate in order to manage those completed home inventory levels, that’s what’s going to flow through. So that’s the slowing indication that you’ve got from us.” – Peter Jackson, CEO
- C.H. Robinson Worldwide (CHRW): “Certainly, there’s been a democratization of kind of freight brokerage tech over the last couple of years… From your question on, is it enabling carriers to stay in longer. I wouldn’t say that’s the case. We’ve seen a decline not only in the number of brokers, but also in capacity exits… I’m not sure I would agree maybe with your sentiment on that being a driver of keeping capacity in the marketplace. But certainly, I would acknowledge the democratization of freight brokerage tech.” – Michael Castagnetto, President of North American Surface Transportation
- S&P Global Inc. (SPGI): “We’re expecting 1 to 2 rate cuts from the US Fed in the second half of the year, and we’re expecting a slow but positive GDP growth across all major economic zones. We’re also expecting oil prices to be slightly lower in the back half compared to the first half, with dated Brent crude expected to be in the mid-60s.” – Martina Cheung, CEO
- ArcelorMittal (MT): “We are all waiting to see really the actions that the commission will pass into legislation. And it’s encouraging. And also the agreement between US and Europe with regards to coming together to find ways to ring fence the industry against the biggest issue that we face today. That is, of course, the overcapacity in China.” – Genuino Christino, CFO
- Anheuser-Busch Inbev (BUD): “Across the board, we see consumer confidence, not at the high levels that we saw back that in ’22, for example. And one would expect that at point, as the economy continues to progress, consumer confidence will converge. But we are not there yet… the consumer basket, a different consumer cohorts and economic, socioeconomic levels are being somehow stable, like they are buying on average the same dollars than they usually buy. But we all know that the same dollars with inflation will be less units being bought in the basket… where purchase power is already rebuilding… Then you see the industry recovery in line, not only on the euros that people is spending, but also in quantity.” – Michel Doukeris, CEO
- Arrow Electronics (ARW): “We definitely are seeing customer level inventories normalize, especially in the larger OEM piece of the market, and that’s been driving a level of replenishment activity. And we’re seeing normal booking patterns reemerge… We do think the mass market customer base lags the larger OEMs… Obviously, visibility will improve as either lead times extend or end market demand improves more sharply… Inventories normalizing in the high end, de-stocking still playing out in the lower end.” – Sean J. Kerins, CEO
- HF Sinclair (DINO): “There was a lot of concern earlier in the year that capacity growth would outshine demand growth. And really what we’ve seen play out over this year is that that’s not happening… The policies of this new administration are also strengthening the outlook for the refining industry. The CRA bill… reversed the ban on internal combustion engines in California, [and] the big beautiful bill that is taking away some of the artificial incentives for some of the EV vehicles… that’s really creating more of a global landscape that’s more favorable to our refining industry.” – Timothy Go, CEO
- Quanta Services (PWR): “The demand on power is exponential. It continues to come in. AI continues to prove out, both economically as well as what we see from power demand under any scenario. And if we’re going to lead the country in the world, you have to have power.” – Earl C Duke Austin, CEO
- International Paper (IP): “When you look at the market right now, it’s relatively flat sequentially… Housing has been just a mess and… people have been pretty constrained in terms of net investment spending. People have been pretty constrained in terms of inventory… I think one of the great lessons for everybody out of the COVID era was around supply chain… I think you’re going to see less [restocking] unless you get a really big step up in economic activity… there is a ton of pent-up investment… the downside scenario really is this continued muddiness and people holding back… we’re kind of four years into a pretty tough industrial environment.” – Andrew Silvernail, CEO
- Emcor (EME): “[Pharmaceutical manufacturers] got a bunch of new drugs they’re going to build onshore that they’ve been investing… I think they’re called GLP-1s, and the weight loss drugs. That’s been a big part of the story in the places we are, whether it be parts of Indiana or North Carolina and then somewhat New Jersey. Now, you’re getting to the second part, which I think they started playing in the middle of last year is… onshoring more manufacturing. That doesn’t happen overnight, but that has been ongoing, and I expect that to accelerate.” – Anthony J. Guzzi, CEO
- Pilgrim’s Pride (PPC): “If you look at the demand and you look at what’s happening in both retail, that is gaining market share because of the living increases in inflation and the concerns of the consumers about spending… On the foodservice, despite the reduction in the traffic, we’re seeing chicken gaining market share and increasing menu penetration… And I think that’s being what we’ve seen lately on the prices of boneless breast meat.” – Fabio Sandri, CEO
Q2 2025 Earnings Conference Call Recaps: Mastercard (MA)
Bespoke’s Conference Call Recaps use AI to summarize lengthy earnings calls. The commentary below is AI-generated and then edited by Bespoke for quality control. As always, none of these summaries should be construed as recommendations to buy or sell any securities, and investors should do their own research and/or consult with a financial professional before making any investment decisions.
Our latest recap available to Bespoke subscribers covers Mastercard’s (MA) Q2 2025 earnings call.
![]()
Mastercard (MA) is a global payments technology company that facilitates electronic payments across more than 210 countries. It operates one of the world’s largest payment networks, connecting consumers, financial institutions, merchants, governments, and businesses. While best known for credit and debit card transactions, Mastercard has expanded into cybersecurity, data analytics, open banking, and digital identity. Mastercard reported 16% revenue growth and 12% adjusted net income growth as strong consumer spending and rising FX volatility lifted results. Cross-border volumes rose 15%, with non-travel e-commerce up about 20%. The call highlighted momentum in Click to Pay, tokenization, and fleet/SME cards. Its value-added services, like AI-powered fraud prediction and Dynamic Yield personalization, continue to differentiate Mastercard and justify pricing power. Commercial payments and B2B virtual cards also gained traction through partnerships with platforms like SAP and Oracle. Management emphasized a strong US consumer, stable trends across income tiers, and an outlook buoyed by wage growth outpacing inflation. MA posted better-than-expected results on the top and bottom lines, and the stock moved about 2.5% higher on 7/31…
Continue reading our Conference Call Recap for MA by becoming a Bespoke Institutional subscriber. You can sign up for Bespoke Institutional now and receive a 14-day trial to read our newest Conference Call Recap. To sign up, choose either the monthly or annual checkout link below:
Bespoke’s Weekly Sector Snapshot — 7/31/25
Q2 2025 Earnings Conference Call Recaps: Shake Shack (SHAK)
Bespoke’s Conference Call Recaps use AI to summarize lengthy earnings calls. The commentary below is AI-generated and then edited by Bespoke for quality control. As always, none of these summaries should be construed as recommendations to buy or sell any securities, and investors should do their own research and/or consult with a financial professional before making any investment decisions.
Our latest recap available to Bespoke subscribers covers Shake Shack’s (SHAK) Q2 2025 earnings call.
![]()
Shake Shack (SHAK) is a premium fast-casual restaurant chain known for its high-quality burgers, hand-spun shakes, and crinkle-cut fries. With roots in a single hot dog cart in NYC, it has grown into a global brand offering a more elevated alternative to traditional fast food. Shake Shack serves urban diners, travelers, and families alike, both domestically and through international licensed partners. The burger chain posted 1.8% Same-Shack Sales growth in Q2 and 23.9% restaurant-level margins, its highest in 24 quarters. Traffic turned positive in July (+3.2%), aided by a $10 Dubai Shake and new app promos. For the first time, Shake Shack launched top-of-funnel paid media, targeting 15 test markets to support LTOs and drive app adoption. The company opened 13 new company-operated Shacks and remains on track for 45–50 this year, its largest class ever. Supply chain efforts helped offset beef inflation, and cost-to-build is down about 10%. Despite EPS and revenue beats, SHAK shares took a big back step on 7/31, trading down more than 13%…
Continue reading our Conference Call Recap for SHAK by becoming a Bespoke Institutional subscriber. You can sign up for Bespoke Institutional now and receive a 14-day trial to read our newest Conference Call Recap. To sign up, choose either the monthly or annual checkout link below:
Q2 2025 Earnings Conference Call Recaps: Builders FirstSource (BLDR)
Bespoke’s Conference Call Recaps use AI to summarize lengthy earnings calls. The commentary below is AI-generated and then edited by Bespoke for quality control. As always, none of these summaries should be construed as recommendations to buy or sell any securities, and investors should do their own research and/or consult with a financial professional before making any investment decisions.
Our latest recap available to Bespoke subscribers covers Builders FirstSource’s (BLDR) Q2 2025 earnings call.
![]()
Builders FirstSource (BLDR) is the largest supplier of structural building products, manufactured components, and value-added services to residential and multi-family homebuilders, repair and remodel contractors, and manufactured housing builders in the US. The company produces everything from roof trusses to millwork and offers integrated solutions like digital tools and off-site construction. BLDR’s operations span 43 states, with strength in fast-growing Sunbelt markets. Amid soft housing starts and affordability headwinds, BLDR delivered durable profitability with Q2 sales down 5% to $4.2B and adjusted EBITDA of $506M. Single-Family and Multi-Family revenues declined 9% and 23%, respectively, while R&R (Repair & Remodel) rose 3%. The company consolidated 8 facilities YTD, maintained a 92% on-time delivery rate, and continued ramping adoption of its BFS digital tools (>$2B in orders YTD, up 400% YoY). OSB (Oriented Strand Board) oversupply remains a drag, but lumber is stable. Management expects continued pressure in H2, but sees potential upside in 2026 if rates ease and builder destocking finishes. BLDR beat EPS estimates but came up short on the top line and revised guidance downward. The stock fell 5.3% at the open on 7/31 as a result…
Continue reading our Conference Call Recap for BLDR by becoming a Bespoke Institutional subscriber. You can sign up for Bespoke Institutional now and receive a 14-day trial to read our newest Conference Call Recap. To sign up, choose either the monthly or annual checkout link below:
The Bespoke 50 Growth Stocks — 7/31/25
The “Bespoke 50” is a basket of noteworthy growth stocks in the Russell 3,000. To make the list, a stock must have strong earnings growth prospects along with an attractive price chart based on Bespoke’s analysis. There were 15 changes to the list this week.
The Bespoke 50 is available with a Bespoke Premium subscription or a Bespoke Institutional subscription. With Bespoke Premium, you’ll receive a number of daily market updates from us along with our weekly newsletter and a portion of our investor tools. With Bespoke Institutional, you’ll receive everything that’s included with Premium plus additional daily macro analysis and more stock-specific research.
To see all 50 stocks that currently make up the Bespoke 50, simply start a two-week trial to Bespoke Premium or Bespoke Institutional.
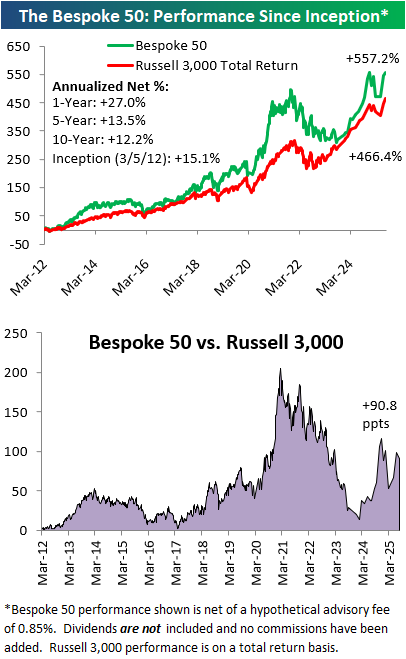
The Bespoke 50 performance chart shown does not represent actual investment results. The Bespoke 50 is updated monthly on Thursdays unless otherwise noted. Performance is based on equally weighting each of the 50 stocks (2% each) and is calculated using each stock’s opening price as of Friday morning after publication. Entry prices and exit prices used for stocks that are added or removed from the Bespoke 50 are based on Friday’s opening price. Any potential commissions, brokerage fees, or dividends are not included in the Bespoke 50 performance calculation, but the performance shown is net of a hypothetical annual advisory fee of 0.85%. Performance tracking for the Bespoke 50 and the Russell 3,000 total return index begins on March 5th, 2012 when the Bespoke 50 was first published. Past performance is not a guarantee of future results. The Bespoke 50 is meant to be an idea generator for investors and not a recommendation to buy or sell any specific securities. It is not personalized advice because it in no way takes into account an investor’s individual needs. As always, investors should conduct their own research when buying or selling individual securities. Click here to read our full disclosure on hypothetical performance tracking. Bespoke representatives or wealth management clients may have positions in securities discussed or mentioned in its published content.
Q2 2025 Earnings Conference Call Recaps: Carvana (CVNA)
Bespoke’s Conference Call Recaps use AI to summarize lengthy earnings calls. The commentary below is AI-generated and then edited by Bespoke for quality control. As always, none of these summaries should be construed as recommendations to buy or sell any securities, and investors should do their own research and/or consult with a financial professional before making any investment decisions.
Our latest recap available to Bespoke subscribers covers Carvana’s (CVNA) Q2 2025 earnings call.
![]()
Carvana (CVNA) is a US e-commerce platform for buying and selling used cars entirely online. It differentiates itself through vertical integration, owning everything from inspection centers and logistics to financing, which allows it to deliver vehicles directly to consumers’ driveways, often within 24 to 48 hours. As of Q2 2025, it holds just 1.5% of the US used car market but has ambitions to reach 3 million annual units. Carvana posted a record-breaking Q2 with 41% unit growth and $4.84B in revenue. Adjusted EBITDA grew to $601M (12.4% margin), while GAAP operating income hit $511M. Tariff-related demand in April boosted retail GPU (Gross Profit per Unit) by $100. ADESA site integrations expanded to 12, cutting inbound transport miles by 20%. Marketing spend rose as the company pushes brand awareness and word-of-mouth. AI is already being deployed in customer service and documentation workflows, showing early efficiency gains. CVNA shares were up as much as 22% on 7/31 following the better-than-expected results. That pushed the stock to a new all-time high after a 99% drawback from its previous August 2021 high! That’s a 10,445% gain from the 12/27/22 low!…
Continue reading our Conference Call Recap for CVNA by becoming a Bespoke Institutional subscriber. You can sign up for Bespoke Institutional now and receive a 14-day trial to read our newest Conference Call Recap. To sign up, choose either the monthly or annual checkout link below:
Q2 2025 Earnings Conference Call Recaps: Microsoft (MSFT)
Bespoke’s Conference Call Recaps use AI to summarize lengthy earnings calls. The commentary below is AI-generated and then edited by Bespoke for quality control. As always, none of these summaries should be construed as recommendations to buy or sell any securities, and investors should do their own research and/or consult with a financial professional before making any investment decisions.
Our latest recap available to Bespoke subscribers covers Microsoft’s (MSFT) Q4 2025 earnings call.
![]()
Microsoft (MSFT) is currently the second-largest company in the world by market cap, behind NVIDIA, selling software, cloud services, hardware, and AI-powered solutions across consumer and enterprise markets. Best known for products like Windows, Office, Azure, and LinkedIn, the company serves businesses of all sizes, government agencies, and billions of consumers worldwide. It’s at the forefront of the AI revolution, uniquely positioned with massive cloud scale, proprietary models via OpenAI, and an expansive product ecosystem from developer tools to business applications. Microsoft delivered a blockbuster quarter, with revenue up 18% to $76.4B and EPS rising 24% to $3.65. Azure grew 39% as demand for AI workloads, cloud-native apps, and major migrations (e.g., Nestlé moving 200 SAP instances) accelerated. The Copilot suite now boasts 100M+ monthly users, with major clients like Barclays and UBS scaling adoption. Foundry processed 500T tokens and is now used by 80% of the Fortune 500. CapEx will top $30B next quarter, yet the company remains supply-constrained despite standing up 2+ gigawatts of new data center capacity. Management struck a confident tone, calling the current AI wave a “generational tech shift.” MSFT shares popped more than 9% after hours on 7/30 in reaction to the strong results…
Continue reading our Conference Call Recap for MSFT by becoming a Bespoke Institutional subscriber. You can sign up for Bespoke Institutional now and receive a 14-day trial to read our newest Conference Call Recap. To sign up, choose either the monthly or annual checkout link below: