Daily Sector Snapshot — 8/6/25
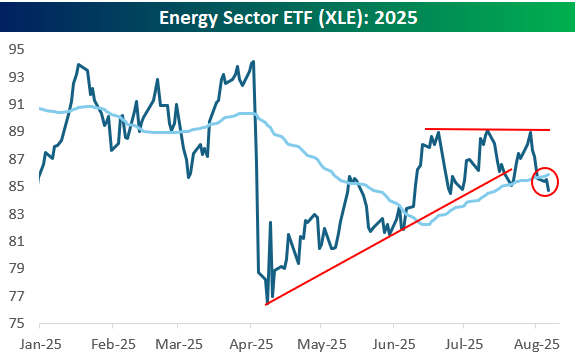
Energy Sector Breaks; Gold Goes Sideways
While some sectors like Tech (XLK) and Consumer Discretionary (XLY) are rallying sharply today, Energy (XLE) is going in the opposite direction with a decline of 1%.
The chart for the Energy sector doesn’t look so hot. As shown below, XLE recently made a triple top just below resistance from the Q1 highs, broke below the bottom of its uptrend channel, and now it’s back below its 50-day moving average.
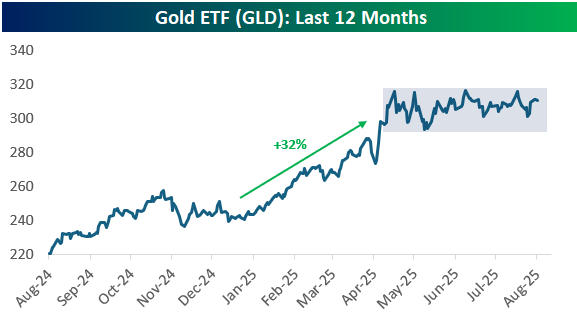
Another chart we thought looked interesting was the gold ETF (GLD). After a huge rally in the first few months of 2025, GLD has stalled out since early April. This looks like a classic “consolidation” pattern after a big move higher. At some point, it will break out of this sideways range and either start another leg higher or start breaking down.

Q2 2025 Earnings Conference Call Recaps: Shopify (SHOP)
Bespoke’s Conference Call Recaps use AI to summarize lengthy earnings calls. The commentary below is AI-generated and then edited by Bespoke for quality control. As always, none of these summaries should be construed as recommendations to buy or sell any securities, and investors should do their own research and/or consult with a financial professional before making any investment decisions.
Our latest recap available to Bespoke subscribers covers Shopify’s (SHOP) Q2 2025 earnings call.
![]()
Shopify (SHOP) is a global commerce platform that enables businesses of all sizes, from solo entrepreneurs to global brands, to build, manage, and scale their online and offline storefronts. Its core offerings include customizable e-commerce websites, payment processing, point-of-sale systems, and a growing suite of AI tools. What sets Shopify apart is its ability to simplify complex commerce, whether that’s managing inventory across multiple countries, integrating with AI agents like Microsoft Copilot, or offering checkout solutions through its modular “Commerce Components” approach. With over 64% payments penetration and brands like Starbucks, Miele, and Canada Goose onboard, Shopify gives investors insight into global retail digitization and the evolving infrastructure of online and omnichannel commerce. Shopify posted 31% revenue growth to $2.7B, driven by GMV acceleration in the US and 42% international GMV growth. AI and agentic commerce dominated the call, with product launches like Catalog, Universal Cart, and Checkout Kit enabling conversational shopping via platforms like Microsoft Copilot. Shop Pay GMV surged 65%, and Shopify expanded payments and capital offerings in Europe. The company highlighted wins in enterprise, including Canada Goose and mining giant Boart Longyear, and emphasized resilience amid tariff changes, with only 4% of GMV affected by de minimis exemptions. SHOP shares surged 21% on better-than-expected results…
Continue reading our Conference Call Recap for SHOP by becoming a Bespoke Institutional subscriber. You can sign up for Bespoke Institutional now and receive a 14-day trial to read our newest Conference Call Recap. To sign up, choose either the monthly or annual checkout link below:
Q2 2025 Earnings Conference Call Recaps: McDonald’s (MCD)
Bespoke’s Conference Call Recaps use AI to summarize lengthy earnings calls. The commentary below is AI-generated and then edited by Bespoke for quality control. As always, none of these summaries should be construed as recommendations to buy or sell any securities, and investors should do their own research and/or consult with a financial professional before making any investment decisions.
Our latest recap available to Bespoke subscribers covers McDonald’s (MCD) Q2 2025 earnings call.
![]()
McDonald’s (MCD) is the world’s largest fast-food restaurant company, operating in over 100 countries under a largely franchised model, with more than 95% of locations operated by franchisees. McDonald’s is not just a food brand; it’s a global cultural icon and a bellwether for consumer behavior, pricing power, and economic sentiment across income levels. In Q2, McDonald’s reported 3.8% global comp sales growth, driven by strong execution in international markets, particularly Germany, France, and Australia. While US traffic remained weak, especially among low-income consumers, franchisees backed national pricing moves, like the $2.99 Snack Wrap, to reinforce value. The company discussed tech transformation, including AI and IoT via Google-powered Edge computing, now in hundreds of US stores. Loyalty members in the US visit 2.5x more frequently, and globally McDonald’s reached 185M 90-day active users. MCD shares rose roughly 3% on 8/6 in reaction to EPS and a revenue beat…
Continue reading our Conference Call Recap for MCD by becoming a Bespoke Institutional subscriber. You can sign up for Bespoke Institutional now and receive a 14-day trial to read our newest Conference Call Recap. To sign up, choose either the monthly or annual checkout link below:
Q2 2025 Earnings Conference Call Recaps: Rivian (RIVN)
Bespoke’s Conference Call Recaps use AI to summarize lengthy earnings calls. The commentary below is AI-generated and then edited by Bespoke for quality control. As always, none of these summaries should be construed as recommendations to buy or sell any securities, and investors should do their own research and/or consult with a financial professional before making any investment decisions.
Our latest recap available to Bespoke subscribers covers Rivian’s (RIVN) Q2 2025 earnings call.
![]()
Rivian (RIVN) designs and manufactures electric vehicles, including the R1T pickup, R1S SUV, and commercial delivery vans (EDVs). It’s known for vertically integrating its software, battery, and autonomous tech stack, giving it full control over product innovation. The company primarily serves high-end consumers seeking rugged EVs with premium performance as well as commercial partners like Amazon, which has committed to tens of thousands of EDVs. What sets Rivian apart is its ambitious scalability plan, anchored by the mid-priced R2 platform, and its push into autonomy, micromobility (via its “Also” spin-off), and in-house software licensing, highlighted by a $5B partnership with Volkswagen. Rivian stayed focused on the upcoming R2 launch, confirming it has already sourced 100% of the vehicle’s components at a bill of materials 50% lower than R1. The company plans to begin production in early 2026 from its Normal, IL, plant. Autonomy was a major theme, touting its AI-driven sensor fusion platform and teasing hands-free, eyes-off capability by 2026. Regulatory headwinds, like the loss of $140M in expected credit revenue, forced Rivian to revise its 2025 gross profit and EBITDA guidance. Yet optimism remained high, with management reiterating confidence in achieving breakeven EBITDA by 2027. RIVN shares fell as much as 5% after the close on 8/5 in reaction to mixed results…
Continue reading our Conference Call Recap for RIVN by becoming a Bespoke Institutional subscriber. You can sign up for Bespoke Institutional now and receive a 14-day trial to read our newest Conference Call Recap. To sign up, choose either the monthly or annual checkout link below:
July 2025 Headlines
Bespoke’s Morning Lineup – 8/6/25 – Exceptionalism Becomes the Norm
See what’s driving market performance around the world in today’s Morning Lineup. Bespoke’s Morning Lineup is the best way to start your trading day. Read it now by starting a two-week trial to Bespoke Premium. CLICK HERE to learn more and start your trial.
“If everyone isn’t beautiful, then no one is.” – Andy Warhol

Below is a snippet of commentary from today’s Morning Lineup. Start a two-week trial to Bespoke Premium to view the full report.
Futures are modestly higher this morning following a slew of earnings reports that have been positive, on balance. There’s no economic data on the calendar, and the only non-earnings event is a just-scheduled 4:30 PM announcement from the President in the Oval Office. The topic of the announcement is unknown, so as usual, the President will keep everyone in suspense.
Overnight in Asia, markets were mostly higher, and in Europe, equities opened the session higher, but have erased those gains intraday, with Health Care leading the way lower.
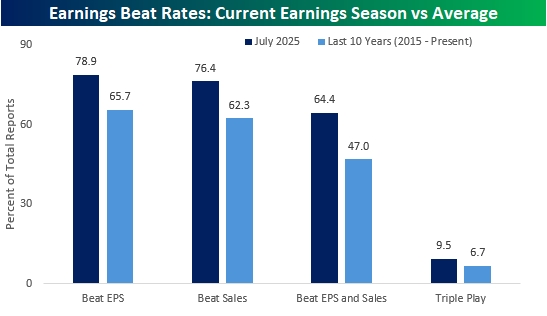
Unlike Warhol’s comment above, one could argue that when everyone looks great, no one does, and the current earnings season provides an example of that logic. The chart below shows the overall earnings and revenue beat rates of companies that reported in July versus the historical average. Whether you look at EPS or revenues, beat rates are well above their averages over the last ten years, and the frequency of Triple Plays is also above the historical average, but to a lesser degree.
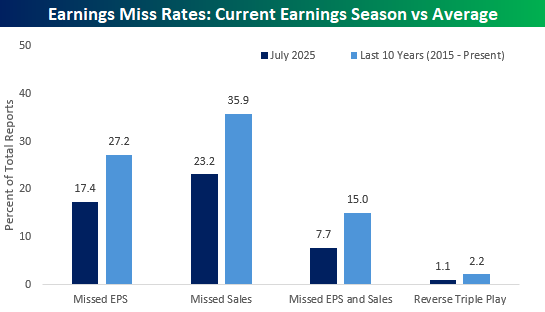
Conversely, companies are also reporting weaker-than-expected results at a much slower pace. The rate of EPS misses is nearly 10 percentage points below the historical average, while the revenue miss rate is over ten percentage points less. With fewer EPS and sales misses, the pace of reverse triple plays is also just half the pace of the average from the last ten years.
The Closer – Tariff Rates, Consumer Credit, Ludicrous – 8/5/25
Log-in here if you’re a member with access to the Closer.
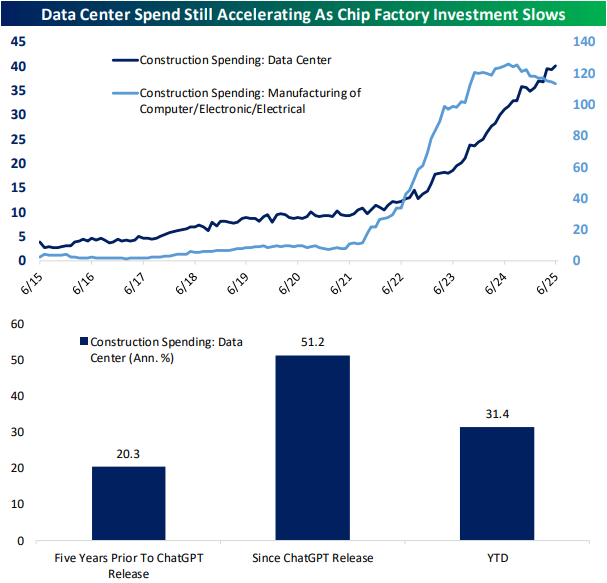
Looking for deeper insight into markets? In tonight’s Closer sent to Bespoke Institutional clients, we begin with a dive into the latest earnings including results from AMD (AMD), Super Micro (SMCI), Rivian (RIVN), and more (page 1). Next, we check in on the the increased share of stocks trading with high momentum and lofty valuations (page 2). We then switch over to macro data including a look at effective tariff rates and data center spending (page 3), the ISM Services miss (page 4), consumer credit figures (pages 5 and 6), and finally the latest logistics data (page 7).
See today’s full post-market Closer and everything else Bespoke publishes by starting a 14-day trial to Bespoke Institutional today!
Daily Sector Snapshot — 8/5/25
Q2 2025 Earnings Conference Call Recaps: Caterpillar (CAT)
Bespoke’s Conference Call Recaps use AI to summarize lengthy earnings calls. The commentary below is AI-generated and then edited by Bespoke for quality control. As always, none of these summaries should be construed as recommendations to buy or sell any securities, and investors should do their own research and/or consult with a financial professional before making any investment decisions.
Our latest recap available to Bespoke subscribers covers Caterpillar’s (CAT) Q2 2025 earnings call.
![]()
Caterpillar (CAT) is the world’s leading manufacturer of construction and mining equipment, diesel and natural gas engines, industrial gas turbines, and diesel-electric locomotives. Its products help power infrastructure, resource extraction, and energy development across the globe. The company serves construction contractors, mining firms, energy producers, and governments. Its performance gives deep insight into infrastructure spending, commodity cycles, and economic health across regions. Caterpillar posted a mixed Q2 as it managed strong demand but warned of mounting tariff headwinds. Despite a 1% YoY sales decline to $16.6B, adjusted operating margin reached 17.6%, beating internal expectations thanks to cost controls. Tariffs are now expected to reduce 2025 profits by $1.3–$1.5B, yet management is holding off on longer-term mitigation until the trade environment stabilizes. The backlog hit a record $37.5B, supported by robust orders in all three segments. Power generation, particularly for data centers, surged 28%, with Caterpillar planning years in advance with hyperscale clients. North American construction remained strong, and dealer rental loading is expected to rebound in the second half of the year. On mixed results, CAT shares headed into the close flat on 8/5 after an up-and-down session…
Continue reading our Conference Call Recap for CAT by becoming a Bespoke Institutional subscriber. You can sign up for Bespoke Institutional now and receive a 14-day trial to read our newest Conference Call Recap. To sign up, choose either the monthly or annual checkout link below: