Q2 2025 Earnings Conference Call Recaps: Duolingo (DUOL)
Bespoke’s Conference Call Recaps use AI to summarize lengthy earnings calls. The commentary below is AI-generated and then edited by Bespoke for quality control. As always, none of these summaries should be construed as recommendations to buy or sell any securities, and investors should do their own research and/or consult with a financial professional before making any investment decisions.
Our latest recap available to Bespoke subscribers covers Duolingo’s (DUOL) Q2 2025 earnings call.
![]()
Duolingo (DUOL) is the world’s most popular language-learning platform, offering gamified courses in over 40 languages through its mobile app and website. The company has expanded into adjacent educational verticals like math, music, and, most recently, chess. Duolingo serves a wide global user base, with particularly strong growth among English learners in Asia. Its tiered subscription model, including Super and Max plans, supports both free and paid users. What makes Duolingo stand out is its use of AI to personalize learning experiences at scale and its viral, irreverent brand voice. Duolingo posted another strong quarter, raising full-year guidance on the back of 40% DAU (Daily Active User) growth, an 8% Max subscriber mix, and record profitability. Growth in Asia (especially China, boosted by a Luckin Coffee partnership) was a standout. The company highlighted progress in its new “Energy” system, which has lifted DAUs, revenue, and time spent, while drawing some user backlash. AI-related costs fell as token prices dropped, improving gross margins. Video Call remains the “killer feature” of Max, and the team is adding bilingual dialogue and engagement-based fine-tuning. Social media strategy was reined in after controversial AI remarks, affecting US virality but now stabilizing. The stock was up as much as 31% on 8/7 after the triple play but gave up half of those gains intraday…
Continue reading our Conference Call Recap for DUOL by becoming a Bespoke Institutional subscriber. You can sign up for Bespoke Institutional now and receive a 14-day trial to read our newest Conference Call Recap. To sign up, choose either the monthly or annual checkout link below:
Q2 2025 Earnings Conference Call Recaps: Cheniere Energy (LNG)
Bespoke’s Conference Call Recaps use AI to summarize lengthy earnings calls. The commentary below is AI-generated and then edited by Bespoke for quality control. As always, none of these summaries should be construed as recommendations to buy or sell any securities, and investors should do their own research and/or consult with a financial professional before making any investment decisions.
Our latest recap available to Bespoke subscribers covers Cheniere Energy’s (LNG) Q2 2025 earnings call.
![]()
Cheniere Energy (LNG) is the largest producer and exporter of liquefied natural gas (LNG) in the United States and a top-five global LNG supplier. Operating major export terminals at Sabine Pass (Louisiana) and Corpus Christi (Texas), Cheniere transforms US shale gas into LNG for delivery to over 45 countries. The company serves utilities, energy companies, and governments, offering flexible, long-term supply contracts that help anchor energy security worldwide. What sets Cheniere apart is its vertically integrated, brownfield-driven growth model, expanding capacity through debottlenecking and modular additions rather than full greenfield builds. The company finalized FID (Final Investment Decision) on Corpus Christi Midscale Trains 8 & 9 and achieved substantial completion of Train 2 in Stage 3. Debottlenecking added about 1 MTPA (Million Tons Per Annum) in capacity at low cost, while a new 1 MTPA long-term contract with JERA (Japan) marked a strategic commercial milestone. Management emphasized robust LNG demand in Europe (up 25% YoY) and a strong long-term outlook in Asia despite short-term softness. LNG shares hovered around flat in 8/7’s session despite stronger-than-expected results…
Continue reading our Conference Call Recap for LNG by becoming a Bespoke Institutional subscriber. You can sign up for Bespoke Institutional now and receive a 14-day trial to read our newest Conference Call Recap. To sign up, choose either the monthly or annual checkout link below:
Q2 2025 Earnings Conference Call Recaps: Uber (UBER)
Bespoke’s Conference Call Recaps use AI to summarize lengthy earnings calls. The commentary below is AI-generated and then edited by Bespoke for quality control. As always, none of these summaries should be construed as recommendations to buy or sell any securities, and investors should do their own research and/or consult with a financial professional before making any investment decisions.
Our latest recap available to Bespoke subscribers covers Uber’s (UBER) Q2 2025 earnings call.
![]()
Uber (UBER) is a global mobility and delivery platform that connects consumers to transportation, food, groceries, freight, and increasingly, autonomous vehicles. Its core segments, Mobility and Delivery, serve both everyday consumers and enterprise clients in over 70 countries. The company offers a glimpse into global consumer habits, urban transportation, and the future of autonomous mobility. Uber posted record highs across gross bookings (+18%), trips (+18%), adjusted EBITDA, and free cash flow, driven by growing audience engagement and platform usage. Only 20% of adults in top markets use Uber monthly, signaling runway ahead. Uber One membership rose 60% YoY to 36 million, fueled by perks like “surge savings.” Autonomous vehicle deployments expanded, with Waymo rides now busier than 99% of human drivers and a broader OEM strategy taking shape through deals like Lucid/Nuro. UBER shares fell more than 2% at the opening bell on 8/6 but recovered most of the losses intraday after posting in-line EPS and a stronger-than-expected top-line figure…
Continue reading our Conference Call Recap for UBER by becoming a Bespoke Institutional subscriber. You can sign up for Bespoke Institutional now and receive a 14-day trial to read our newest Conference Call Recap. To sign up, choose either the monthly or annual checkout link below:
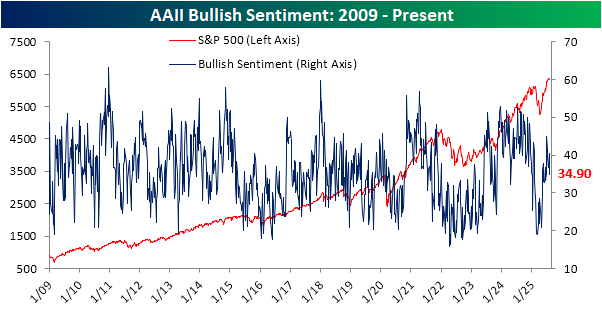
Bull-Bear Spread Tips Negative
The equity market’s rally has hit a bit of a snag since late July, although the S&P 500 is far from having collapsed as it remains within a couple percentage points of record highs. Nonetheless, sentiment has taken a hit. Bullish sentiment according to the weekly AAII survey peaked in the first week of July at 45%. Since then, it has fallen in four of the five weeks with the latest print of 34.9% the lowest of that stretch. That is only the lowest reading since the week of June 18th when it fell to 33.2%.
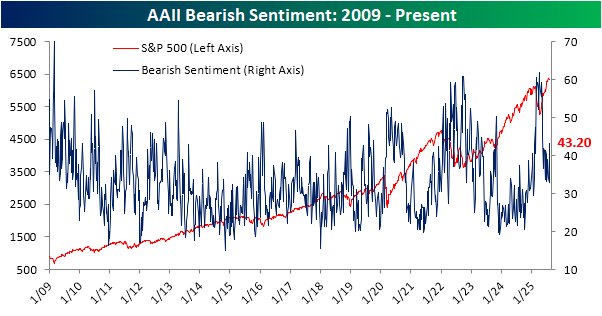
The drop in bulls corresponds with bearish sentiment picking up. Bearish sentiment has seen a more substantial increase, rising from 33% last week to 43.2% this week. That is now the highest reading for bears since the week of May 15, and the 10.2 percentage point leap week over week was the largest increase since the last week of February.
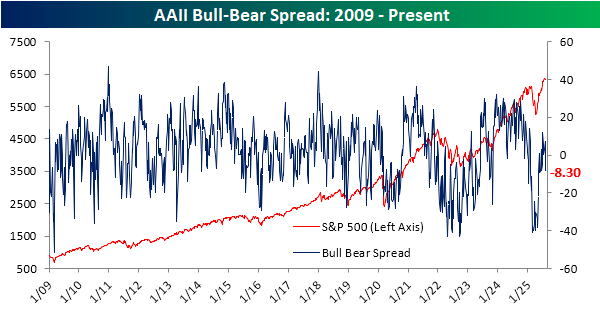
As shown below, the spread between bulls and bears has dipped back into negative territory and is at its lowest level since mid-May.

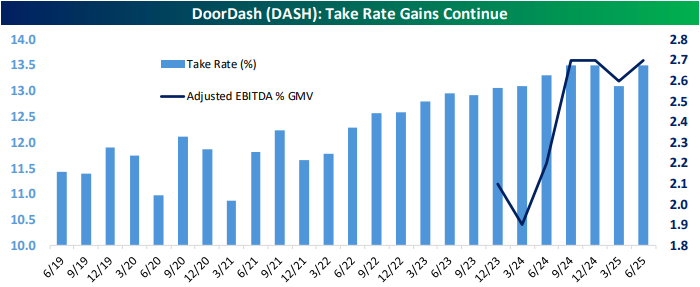
Q2 2025 Earnings Conference Call Recaps: DoorDash (DASH)
Bespoke’s Conference Call Recaps use AI to summarize lengthy earnings calls. The commentary below is AI-generated and then edited by Bespoke for quality control. As always, none of these summaries should be construed as recommendations to buy or sell any securities, and investors should do their own research and/or consult with a financial professional before making any investment decisions.
Our latest recap available to Bespoke subscribers covers DoorDash’s (DASH) Q2 2025 earnings call.
![]()
DoorDash (DASH) is a platform for local commerce, best known for connecting consumers with restaurants, convenience stores, grocers, and retailers through on-demand delivery. It operates across the US and internationally through its Wolt subsidiary and has grown into a multi-vertical logistics and commerce engine. Beyond delivery, DoorDash now serves merchants with SaaS tools, ads, and first-party logistics via its Drive and Storefront products. DoorDash’s Q2 call highlighted surging growth in non-restaurant categories, which are now growing faster than core food delivery and seeing record engagement. DashPass subscriptions continue to thrive, including strong cohort retention even five years in. The $1B+ advertising business is now bolstered by the Symbiosys acquisition, while AI was noted in improving operations, personalization, and engineering workflows. CEO Tony Xu emphasized that DoorDash is still early in penetrating total addressable usage occasions, including grocery and retail. International markets like Wolt hit record MAUs and frequency. Autonomous delivery and drone tests are ongoing, but real scale remains a future goal. DASH shares were trading about 5% higher in modday trading on 8/7 following its better than expected results after the close on 8/6…
Continue reading our Conference Call Recap for DASH by becoming a Bespoke Institutional subscriber. You can sign up for Bespoke Institutional now and receive a 14-day trial to read our newest Conference Call Recap. To sign up, choose either the monthly or annual checkout link below:
Chart of the Day: Strong Earnings
Tech’s Weight Loss in the S&P 493
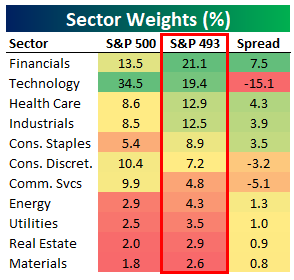
The Technology sector now has a weighting of 34.45% in the S&P 500, which is basically near record-highs only seen at the peak of the Dot Com Bubble in early 2000. Below is a pie chart showing current S&P 500 sector weights. Tech’s weighting is now more than 20 percentage points higher than Financials (13.53%), which is the second largest sector in the index.
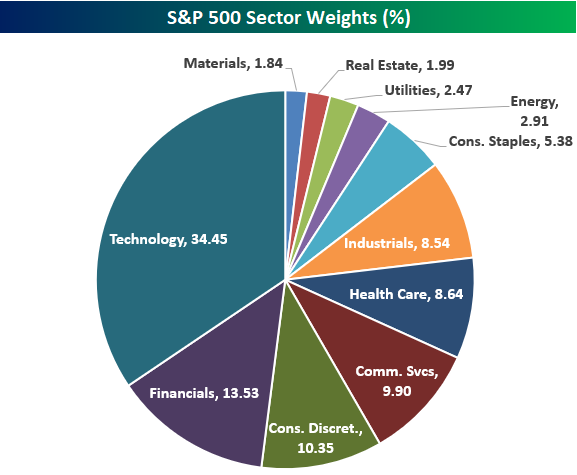
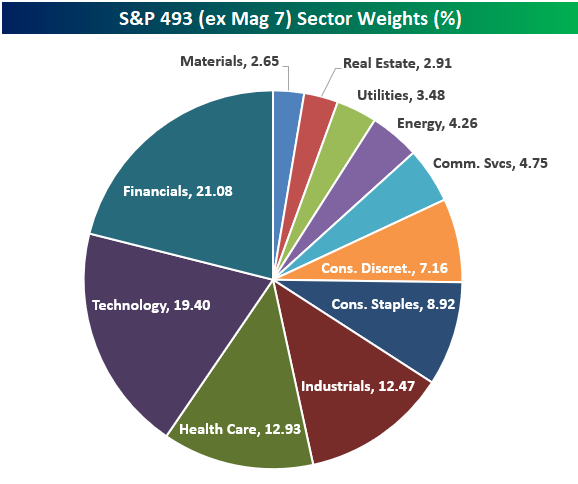
Things look significantly different if we remove the mega-cap Mag 7 stocks (AAPL, AMZN, META, MSFT, NVDA, TSLA) and only look at the “S&P 493.” As shown in the table and pie chart below, Tech is no longer the largest sector when looking at the S&P 500 ex Mag 7. Financials actually takes the top spot with a 21.1% weighting in the S&P 493. Tech moves down to second with a weighting of 19.4%, followed by Health Care (12.9%) and Industrials (12.5%) in third and fourth. Consumer Discretionary and Communication Services also become quite a bit smaller when looking at their weightings in the S&P 493. Consumer Discretionary is the 3rd largest sector in the S&P 500 at 10.4%, but it ranks as just the 6th largest in the S&P 493 at 7.2%. Communication Services sees an even bigger drop when going from the S&P 500 to S&P 493, falling from 9.9% down to 4.8%.
On the flip side, Consumer Staples jumps from the 7th largest sector in the S&P 500 to the 5th largest sector when looking at the S&P 500 ex Mag 7. Similar to how large-cap valuations look a lot less excessive when removing the Mag 7 from the equation, sector weightings also become a lot more balanced.
Bespoke’s Morning Lineup – 8/7/25 – Things are Not as They Seem
See what’s driving market performance around the world in today’s Morning Lineup. Bespoke’s Morning Lineup is the best way to start your trading day. Read it now by starting a two-week trial to Bespoke Premium. CLICK HERE to learn more and start your trial.
“If you absolutely can’t tolerate critics, then don’t do anything new or interesting.” – Jeff Bezos

Below is a snippet of commentary from today’s Morning Lineup. Start a two-week trial to Bespoke Premium to view the full report.
Stock futures have been rallying all night following the President’s announcement with Apple CEO Tim Cook that the company will invest up to $600 billion in the US over the next four years. Trump also announced 100% tariffs on all imports of semiconductors, but qualified that with the caveat that any companies investing in the US would be exempt from the tariff. We don’t know how this will be tracked or what constitutes significant enough investing, but the initial reaction of markets has been positive.
AAPL shares have also been screaming higher. Yesterday’s 5% gain was the biggest margin of outperformance relative to the S&P 500 since last year’s WWDC conference, and this morning, shares are up another 3%. One semiconductor stock not feeling the love this morning is Intel (INTC). Shares are down over 3% after the President called for the CEO’s resignation, saying in a Truth Social post that he is ‘conflicted’. We can’t remember the last time a U.S. president publicly called for the resignation of a CEO, but then again, there have been a lot of firsts under President Trump.
On the economic calendar this morning, the main reports are jobless claims at 8:30, but we’ll also get Non-Farm Productivity and Unit Labor Costs at the same time.
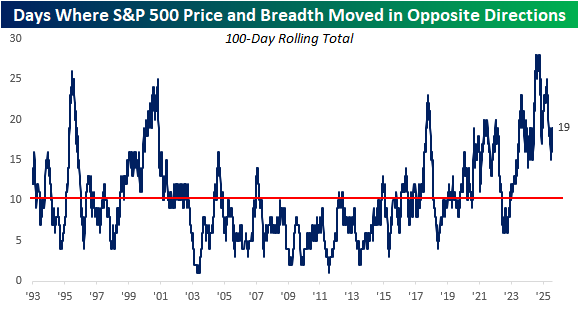
Yesterday was another one of those days when the S&P 500 moved one way, and breadth moved in the opposite direction. As the S&P 500 rallied more than 0.7%, there were 23 more stocks in the index that finished down on the day than up. As the S&P 500 has become increasingly top-heavy in recent years, the daily moves in the index have been increasingly less representative of the performance of the ‘average’ stock.
The chart below shows the rolling 100-day number of days when the S&P 500’s daily price change moved in the opposite direction as breadth. Beginning in the years right before Covid, this reading has been volatile, but the general trend has been higher. While the current level of 19 is well off the record high of 28 from last fall, right before the election, it is still nearly double the historical average of 10.
For most, the current elevated reading brings up memories of the dot-com boom (and subsequent bust), but it doesn’t have to end that way. Back in 2000, the largest stocks in the S&P 500 were incredibly overvalued, so when the bubble popped, they deflated quickly and pulled the index down with them. Today, the ten largest stocks in the index aren’t cheap, but their valuations are less out of step with the rest of the market than they were back in 2000. According to a report from SocGen, the top ten stocks in the S&P 500 account for 40% of the index’s market cap and a third of the profits. That’s an imbalance, but not an incredibly wide one.
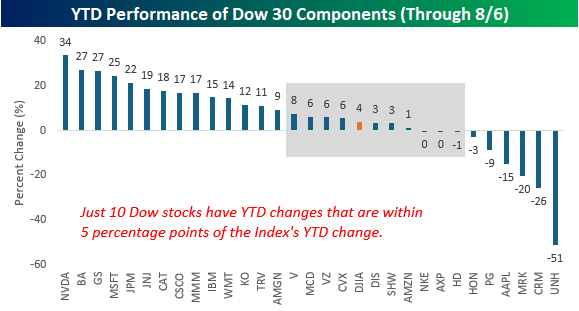
While the Dow Jones Industrial Average is hardly the most widely followed benchmark of US stock market performance, we found it interesting that the index’s 3.9% YTD gain is hardly representative of the YTD performance of the index’s 30 components. As shown in the chart below, just ten stocks in the index have YTD returns that are within five percentage points of the index’s change, and more than half (16) have YTD performances that are at least ten percentage points higher or lower than the index.
The Closer – A Dovish Turn, Picks & Shovels, Other Earnings – 8/6/25
Log-in here if you’re a member with access to the Closer.
Looking for deeper insight into markets? In tonight’s Closer sent to Bespoke Institutional clients, we begin with a rundown of recent Fed speakers and whether each one have given hints of dovishness or hawkishness (page 1). We then cap off with a look at the latest earnings (pages 2 and 3).
See today’s full post-market Closer and everything else Bespoke publishes by starting a 14-day trial to Bespoke Institutional today!