The Triple Play Report: 3/2/26 – 3/4/26
An earnings triple play is a stock that reports earnings and manages to 1) beat analyst EPS estimates, 2) beat analyst sales estimates, and 3) raise forward guidance. You can read more about “triple plays” at Investopedia.com where they’ve given Bespoke credit for popularizing the term. We like triple plays as an indication that a company’s business is firing on all cylinders, with better-than-expected results and an improving outlook. A triple play is indicative of positive “fundamental momentum” instead of pure fundamentals, and there are always plenty of names with both high and low valuations on our quarterly list.
Bespoke’s Triple Play Report covers what each company does, what this quarter’s results say about their growth outlooks, and their histories of delivering triple plays. Bespoke’s Triple Play Report is available at the Bespoke Institutional level only. You can sign up for Bespoke Institutional now and receive a 14-day trial to read today’s Triple Play Report. To sign up, choose either the monthly or annual checkout link below:
Bespoke Institutional – Monthly Payment Plan
Bespoke Institutional – Annual Payment Plan
Bespoke Investment Group, LLC believes all information contained in these reports to be accurate, but we do not guarantee its accuracy. None of the information in these reports or any opinions expressed constitutes a solicitation of the purchase or sale of any securities or commodities. This is not personalized advice. Investors should do their own research and/or work with an investment professional when making portfolio decisions. As always, past performance of any investment is not a guarantee of future results. Bespoke representatives or clients may have positions in securities discussed or mentioned in its published content.
Bespoke’s Morning Lineup – 3/5/26 – Back to Basics
See what’s driving market performance around the world in today’s Morning Lineup. Bespoke’s Morning Lineup is the best way to start your trading day. Read it now by starting a two-week trial to Bespoke Premium. CLICK HERE to learn more and start your trial.
“The world makes much less sense than you think.” – Daniel Kahneman

Below is a snippet of commentary from today’s Morning Lineup. Start a two-week trial to Bespoke Premium to view the full report.
The S&P 500 crept into positive territory for the week, which was incredible given the circumstances, but futures are set to erase those gains at the open. Both the S&P 500 and Nasdaq are indicated to open down by 0.25%. The biggest driver of weakness is crude oil, where prices are up another 3% to $77. It’s simple at this point: the more crude oil rises, the bigger a headwind it will be for equities.
In Asia, stocks were higher across the board, with the biggest gains coming from South Korea, where the KOSPI rallied 9.6% following the 12% decline on Wednesday. Talk about a rational market! In Europe, the tone is less positive. While markets in the region started the day higher, they have been giving up those gains as the UP open approaches and are now all broadly looking at modest declines.
It’s been a busy morning for economic data, and most of it was better than expected. Initial jobless claims were slightly weaker than expected, and continuing claims were modestly higher. Import Prices were lower than expected, while both Non-Farm Productivity and Unit Labor Costs came in higher than expected.
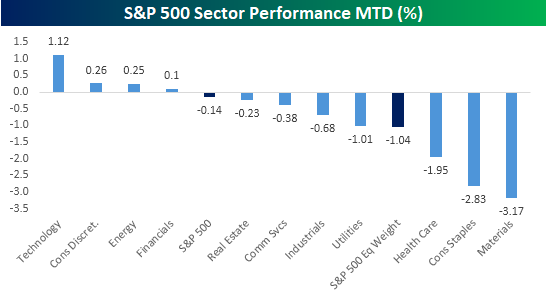
We’re less than a week into the war in Iran, but it’s never too early to see what trends within the equity market may be starting to emerge. At the sector level, you would expect to see a rush into defensive areas as investors rein in risk at the expense of cyclicals. So far, we’ve seen nearly the opposite play out. While the S&P 500 is up so far this week, which is surprising in itself, the four sectors outperforming the market are Technology, Consumer Discretionary, Energy, and Financials. If you had asked most people what sectors would outperform the market following a full-scale breakout of war in the Middle East, the only one of those four sectors that would come to mind is Energy.
The sectors you would expect to outperform in the event of war would be defensives like Utilities, Consumer Staples, and Health Care. But guess what? They’re three of the four worst-performing sectors with declines of at least 1% each! While the S&P 500 is surprisingly higher this week, the rally is primarily due to the 1%+ gain in the Technology sector. On an equal weight basis, the index is down 1.04%, and 60% of its components are down MTD.
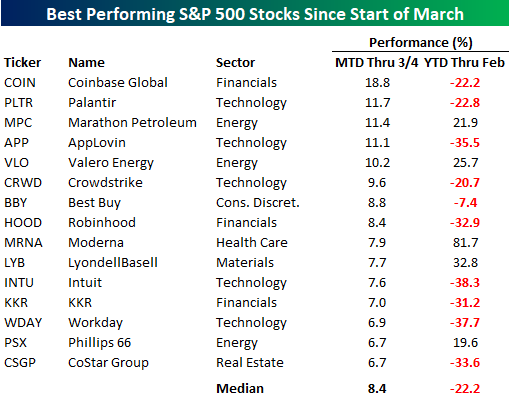
At the individual stock level, the list of winners is mostly devoid of defensive stocks. Instead, it’s littered with stocks that were recently considered some of the hottest growth stocks in the market before falling on hard times in late 2025 and earlier this year. Of the 15 top-performing stocks in the S&P 500 since the war broke out, their average YTD change in the first two months of the year was a decline of 22.2%, and ten of them were in the red. The two top-performing stocks – Coinbase (COIN) and Palantir (PLTR) – were both down over 20% in the first two months of 2026. While PLTR, with its military contracts, benefits from geopolitical instability, it’s hard to look at most of the other non-Energy stocks and see the obvious reason as to why they would benefit.
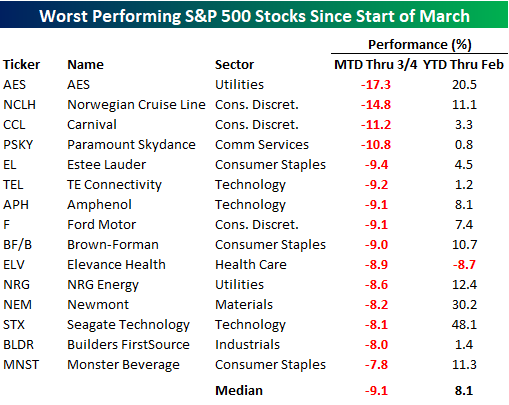
While the list of winners is mostly stocks that were down sharply YTD, all but one of the stocks on the list of losers were up YTD heading into March. Their average YTD gain was 8.1%, and seven were up by double-digit percentages. Leading the way lower, AES was up 20%+ YTD heading into March, but it has given most of that back in the first few days of March. Behind AES, cruise operators Norwegian Cruise Line (NCLH) and Carnival (CCL), along with Paramount Skydance (PSKY), are the only other stocks down by double-digit percentages. The declines in NCLH and CCL make sense given the geopolitical uncertainty, but the drop in PSKY is company-specific and tied to the merger with Warner.
Looking both at sector and individual stock performance since the war broke out, it seems as though investors have taken a back-to-basics approach, focusing on what had been working rather than what was working at the time that hostilities broke out. Whether that’s due to trade unwinds and short-covering given the heightened uncertainty or a reversion to tech remains to be seen, but in the early going, market performance and internals have done what they always do – surprise nearly everyone.
The Closer – Korea Crushed, Beige Book, Trucking – 3/4/26
Log-in here if you’re a member with access to the Closer.
- Korean stocks have fallen close to 20% in the past three days; one of the largest declines on record.
- The Beige Book has seen a drop off in the number of mentions of tariffs, uncertainty, and layoffs.
- The situation in Iran has sent diesel prices exploding higher when trucking per mile prices are already rising rapidly.
See today’s full post-market Closer and everything else Bespoke publishes by starting a 14-day trial to Bespoke Institutional today!
Q4 2025 Earnings Conference Call Recaps: Brown-Forman (BF/B)
Bespoke’s Conference Call Recaps use AI to summarize lengthy earnings calls. The commentary below is AI-generated and then edited by Bespoke for quality control. As always, none of these summaries should be construed as recommendations to buy or sell any securities, and investors should do their own research and/or consult with a financial professional before making any investment decisions.
Our latest recap available to Bespoke subscribers covers Brown-Forman’s (BF/B) Q3 2026 earnings call.
![]()
Brown-Forman (BF/B) is one of the largest American-owned spirits companies, best known for Jack Daniel’s Tennessee Whiskey, the world’s most widely sold American whiskey. Its portfolio spans bourbon, tequila, rum, gin, and a growing ready-to-drink segment, with products sold in over 170 countries. Brown-Forman reaffirmed its full-year fiscal 2026 guidance despite a challenging backdrop, projecting a low single-digit organic net sales decline trending toward the stronger end of the range. The US spirits market remains in low single-digit decline, though management pointed to modestly improving Nielsen trends over the past two months as a potential green shoot. Canada remains a major drag, with organic net sales down nearly 60% as American products stay off most provincial shelves. Jack Daniel’s Tennessee Blackberry has been a standout, ranking as the second largest new spirits product by value in Nielsen, while New Mix is being tested across seven to eight US states. Management flagged 100–150 basis points of gross margin compression over roughly two years from barrels produced during the early 2020s, and pushed back firmly against expectations of industry-wide price cuts. Despite better-than-expected results, BF/B shares fell as much as 8.3% on 3/4, though shares rebounded some intraday…
Continue reading our Conference Call Recap for BF/B by becoming a Bespoke Institutional subscriber. You can sign up for Bespoke Institutional now and receive a 14-day trial to read our newest Conference Call Recap. To sign up, choose either the monthly or annual checkout link below:
Q4 2025 Earnings Conference Call Recaps: Best Buy (BBY)
Bespoke’s Conference Call Recaps use AI to summarize lengthy earnings calls. The commentary below is AI-generated and then edited by Bespoke for quality control. As always, none of these summaries should be construed as recommendations to buy or sell any securities, and investors should do their own research and/or consult with a financial professional before making any investment decisions.
Our latest recap available to Bespoke subscribers covers Best Buy’s (BBY) Q4 2026 earnings call.
![]()
Best Buy (BBY) is the largest US specialty retailer of consumer electronics, computing, mobile phones, appliances, and related services, operating over 1,000 stores alongside a major e-commerce platform. With $13.8 billion in Q4 revenue and more than 80,000 employees, the company serves as a bellwether for consumer technology spending, replacement cycles, and the real-world commercialization of AI hardware. Management reported Q4 comparable sales down 0.8%, below estimates, but delivered better-than-expected profitability, with an adjusted operating income rate of 5% and EPS of $2.61. The dominant theme was rising memory component costs, pressuring computing supply and pricing. Management outlined a five-point mitigation playbook and framed the guidance range of -1% to +1% comps around varying severity of constraints. Best Buy Ads hit $900 million in collections (up 7%), with 10% growth guided for FY27, while Marketplace reached $300 million in Q4 GMV. AI was discussed, with new partnerships with OpenAI, Google, and Meta positioning BBY for agentic commerce. The company plans to open six new stores, its first domestic expansion in over a decade, and expects FY27 to be the last major Ads/Marketplace investment year before material profit contributions in FY28-29. Shares rallied 7.1% on 3/3 in reaction to the report…
Continue reading our Conference Call Recap for BBY by becoming a Bespoke Institutional subscriber. You can sign up for Bespoke Institutional now and receive a 14-day trial to read our newest Conference Call Recap. To sign up, choose either the monthly or annual checkout link below:
Q4 2025 Earnings Conference Call Recaps: Target (TGT)
Bespoke’s Conference Call Recaps use AI to summarize lengthy earnings calls. The commentary below is AI-generated and then edited by Bespoke for quality control. As always, none of these summaries should be construed as recommendations to buy or sell any securities, and investors should do their own research and/or consult with a financial professional before making any investment decisions.
Our latest recap available to Bespoke subscribers covers Target’s (TGT) Q4 2025 earnings call.
![]()
Target (TGT) is one of America’s largest general merchandise retailers, operating nearly 2,000 stores within 10 miles of 75% of the US population. The company specializes in six core categories: apparel, home, beauty, food and beverage, hardlines, and essentials. Management was candid on the call that recent performance “has not met expectations” and outlined a more than $2 billion incremental investment plan that includes $1 billion in CapEx for 30+ new stores and 130+ remodels, and $1 billion in P&L spending on store labor, marketing, and technology. The company is funding this partly by lapping roughly $500 million in one-time tariff and inventory costs from 2025 and $200 million in savings from headcount reductions. Guidance calls for about 2% net sales growth and adjusted EPS of $7.50–$8.50. Management highlighted accelerating sales trends in February, food and beverage growing at 8%+ annually since 2019, and same-day delivery surpassing $14 billion. Tariff uncertainty remains a key variable. TGT reported an EPS beat on weaker revenue as the stock rose 6.8% on 3/3…
Continue reading our Conference Call Recap for TGT by becoming a Bespoke Institutional subscriber. You can sign up for Bespoke Institutional now and receive a 14-day trial to read our newest Conference Call Recap. To sign up, choose either the monthly or annual checkout link below:
Six-Month Short Interest Swings
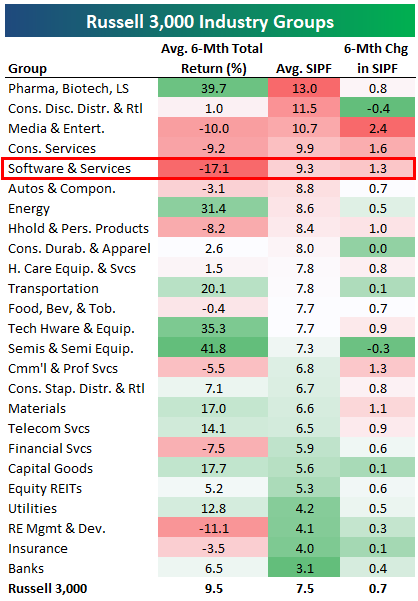
Below is an updated look at changes in short interest levels for Russell 3,000 stocks over the last six months. The average Russell 3,000 stock currently has 7.5% of its float sold short. That’s up 0.7 percentage points from six months ago at the end of August 2025.
The Pharma, Biotech & Life Sciences group has the highest average short interest as a percentage of float (SIPF) at 13%, followed by Consumer Discretionary Distribution & Retail (11.5%) and Media & Entertainment (10.7%).
The average stock in the Software & Services group is down 17.1% over the last six months, the worst of any group, and the average Software stock’s SIPF now sits at 9.3%. That’s up 1.3 percentage points from six months ago, which is elevated but not the most extreme jump across the 25 industry groups. Media & Entertainment has seen the biggest jump in SIPF at 2.4 percentage points.
Unsurprisingly, less volatile groups like Utilities, REITs, Insurance, and Banks have the lowest short interest levels.
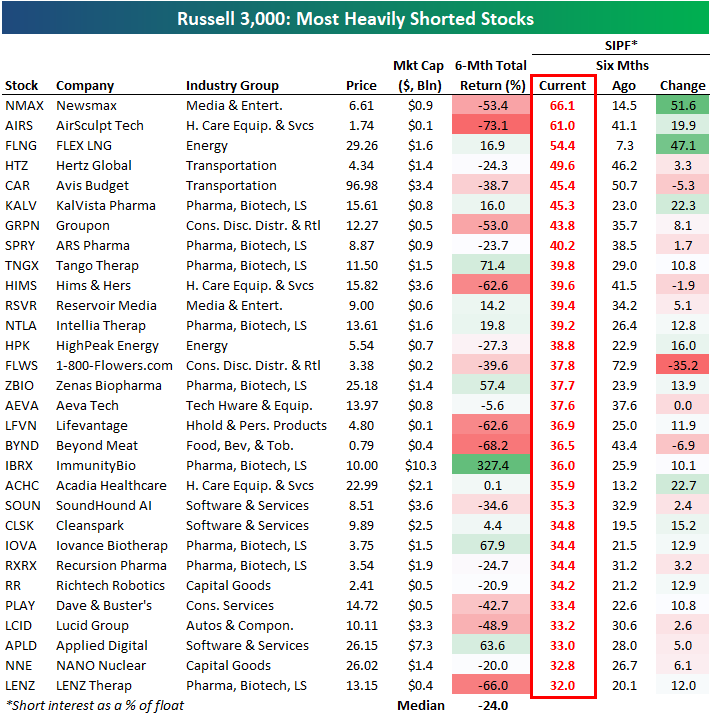
Below is a table highlighting the 30 stocks in the Russell 3,000 that currently have the highest short interest levels (as a percentage of float).
Conservative media outlet Newsmax (NMAX) is at the top of the list with nearly two-thirds of its float sold short, followed by AirSculpt Tech (AIRS) at 61% and FLEX LNG (FLNG) at 54.4%.
Most of the stocks on the list of heavily shorted names have market caps below $10 billion, but some of the names you may know include Groupon (GRPN), Hims & Hers (HIMS), Beyond Meat (BYND), SoundHound AI (SOUN), Dave & Buster’s (PLAY), and Lucid (LCID).
Both Hertz (HTZ) and Avis (CAR) are near the top of the list as well, while robotics company Richtech (RR) and small nuclear reactor company NANO Nuclear (NNE) also make appearances.
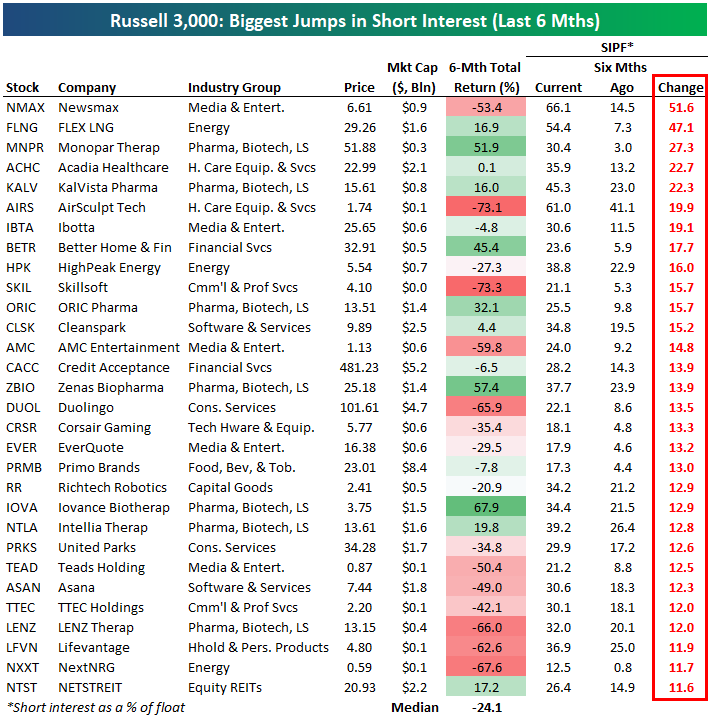
Below is a list of the 30 Russell 3,000 stocks that have seen the biggest increase in short interest over the last six months. Newsmax (NMAX) tops the list with SIPF jumping from 14.5% to 66.1%, followed by FLNG, MNPR, ACHC, and KALV. Other notables on the list include AMC Entertainment (AMC), Credit Acceptance (CACC), Duolingo (DUOL), Primo Brands (PRMB), and Asana (ASAN).
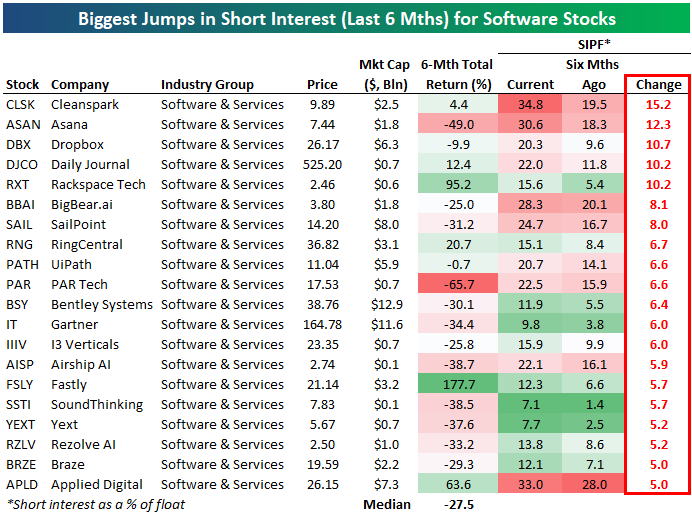
Looking just at software stocks, below are the stocks in the group that have seen the biggest jumps in short interest over the last six months.
Cleanspark (CLSK), Asana (ASAN), Dropbox (DBX), Daily Journal (DJCO), and Rackspace (RXT) top this list. Other names include SailPoint (SAIL), RingCentral (RNG), Bentley Systems (BSY), and Gartner (IT).
Like this analysis? Join our premium members by starting a trial today! Click below for details on how to sign up:

Bespoke’s Morning Lineup – 3/4/26 – Worst to First and First to Worst
See what’s driving market performance around the world in today’s Morning Lineup. Bespoke’s Morning Lineup is the best way to start your trading day. Read it now by starting a two-week trial to Bespoke Premium. CLICK HERE to learn more and start your trial.
“In wartime, truth is so precious that she should always be attended by a bodyguard of lies.” – Winston Churchill
Below is a snippet of commentary from today’s Morning Lineup. Start a two-week trial to Bespoke Premium to view the full report.
It’s been an up-and-down overnight session for US equity indices, and as we type this now, both the S&P 500 and Nasdaq futures are basically flat with moves of less than 10 bps to the upside. Treasury yields are slightly higher, crude oil is flat, and gold is up less than 1%. Pretty quiet day, huh?
Iran will have the potential to continue dominating market action for the day, but don’t forget about the ADP Employment report, ISM Services, and then Broadcom (AVGO) earnings after the close. Earlier this week, the ISM Manufacturing report had the highest Prices Paid reading since 2022, so that will be a key metric to watch in today’s report for the services sector.
The bottom fell out of Asian stocks overnight as the Nikkei fell 3.6%, and every other major benchmark index in the region fell at least 1%. The real damage, though, was in South Korea, where the KOSPI fell over 12% for its worst day on record. There have been major market panics over the last 40 to 50 years, but none of them featured a day when South Korean stocks had a worse one-day decline. Fallout from the war in Iran was the primary driver of the declines, but Chinese PMI data for the Manufacturing and Services sectors also came in weaker than expected.
European stocks are following a different path than Asia, as the STOXX 600 is up over 1%, and the only major country up by less than 1% is the UK. Spanish stocks have managed a gain of 1.4% despite threats from the Trump Administration to cut off trade with the country. Service sector PMIs for the Eurozone and individual countries were basically in line with or slightly better than expected.
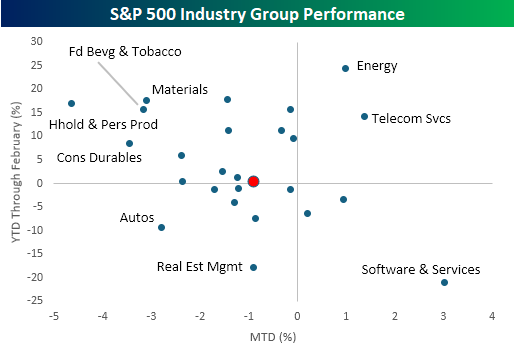
After two full sessions of trading since the war in Iran started, the overall market reaction has been subdued, but there have been some larger moves among individual industry groups. While the S&P 500 is down less than 1%, 16 out of 25 industry groups are up or down more than 1%.
This morning, we wanted to focus on some of the extremes. Starting with the winners that have continued winning, the only two groups that were up YTD heading into the conflict and have continued higher since are Energy and Telecom Services. Along with those two groups, the only others that are up this week are Software & Services (3.0%), which took the opposite path of South Korea by going from worst to first, Commercial Services (0.9%), and Banks (0.2%).
To the downside, some of the worst-performing sectors this week were some of the best YTD performers heading into the conflict. Household & Personal Products, Food Beverages & Tobacco, and Materials were all up over 15% YTD heading into the week, and they’re all down over 3% this week. As painful as the declines may feel this week, they’re coming off of a high base. It’s also worth noting that while Software stocks have bounced, Autos and Real Estate Management- the second and third worst performing groups YTD heading into the conflict have continued lower.
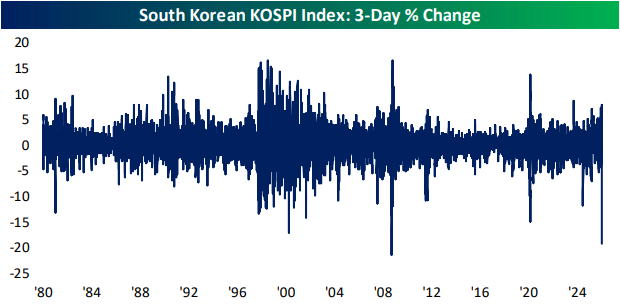
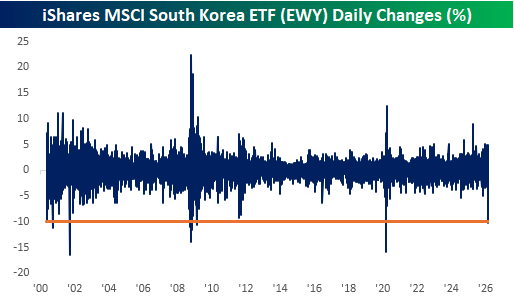
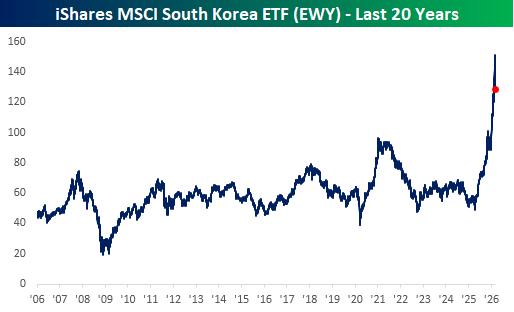
Outside of the US, we’ve also seen some major reversals this week. In yesterday’s Chart of the Day, we noted the outperformance of US stocks relative to the rest of the world. Nowhere has this reversal been more evident than in the performance of South Korean stocks. On Monday, the iShares MSCI South Korea ETF (EWY) fell more than 10% for its largest one-day decline since the Covid crash (South Korea’s KOSPI last night had its worst day on record). As shown in the chart below, declines of this magnitude have only been seen during periods of major crises like Covid, the Financial Crisis, and the dotcom bust.
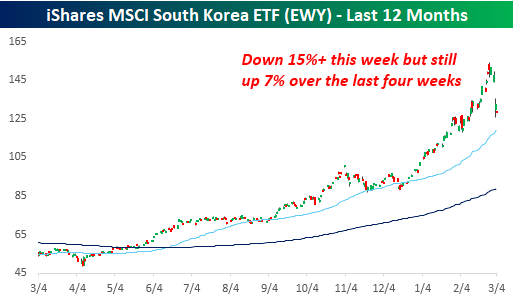
Besides Monday’s decline, EWY continued lower yesterday and is indicated down by another 3% this morning. That takes its decline this week to over 15%, and as sharp as that may sound, the ETF is still up over 7% in the last four weeks. It’s been a rocky few sessions, but if someone told you four weeks ago that you’d have a 7% gain in a month despite a major war in the Middle East, who wouldn’t have signed up for that?
From a longer-term perspective, EWY still looks extremely extended relative to its historical range. After breaking out above its 2021 highs late last year, it is still up over 32% YTD, making it the top-performing major country ETF, so it’s hardly oversold.
The Closer – Leverage, Oil Vol, KISS Basket – 3/3/26
Log-in here if you’re a member with access to the Closer.
- US equity leverage is currently modest at 0.8x, but bond markets are showing elevated leverage levels.
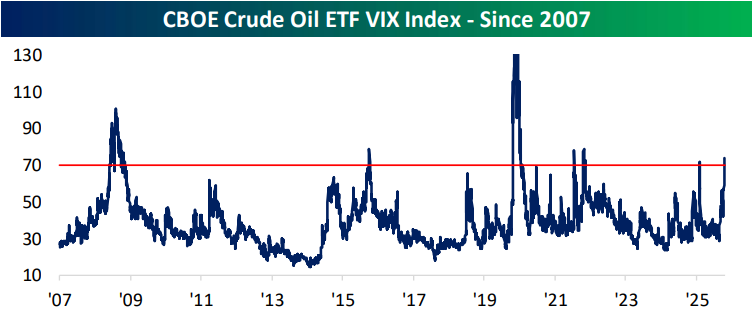
- Volatility is rising across assets with crude oil being the most pronounced example as the oil VIX is now at the highest level since the onset of the Russia-Ukraine war.
- The Logistics Managers Index showed significant expansion in transportation prices.
See today’s full post-market Closer and everything else Bespoke publishes by starting a 14-day trial to Bespoke Institutional today!
Country ETFs Hit Again Pre-Market
Last night we highlighted the big drop in global equity ETFs to start the week after the US/Israel attack on Iran caused energy prices to spike.
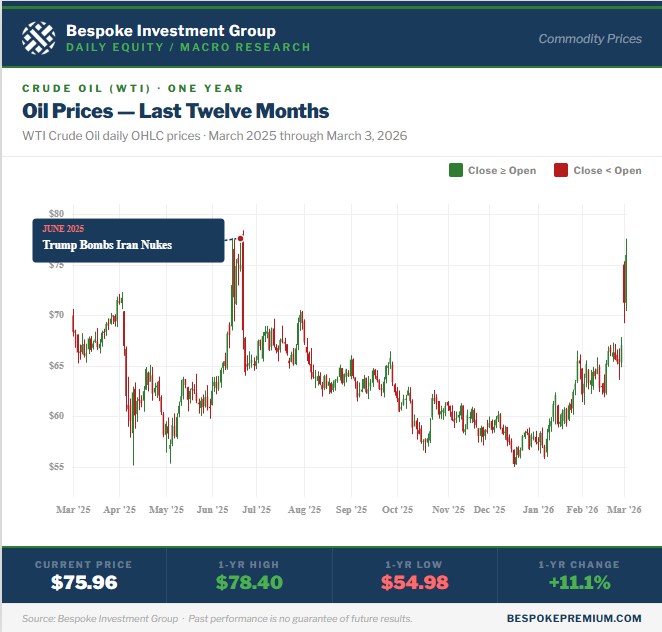
This morning, energy prices are trading sharply higher once again as investors begin to fear a more prolonged conflict in the Middle East. While oil traded up to $75/barrel yesterday, it finished the day just below $72. This morning, crude has gotten as high as $77.50, and it’s currently trading right around $76.
Notably, oil prices are currently right near the levels they peaked at last June when the US and Israel attacked Iran’s nuclear facilities.
Stock markets around the world are trading sharply lower once again today.
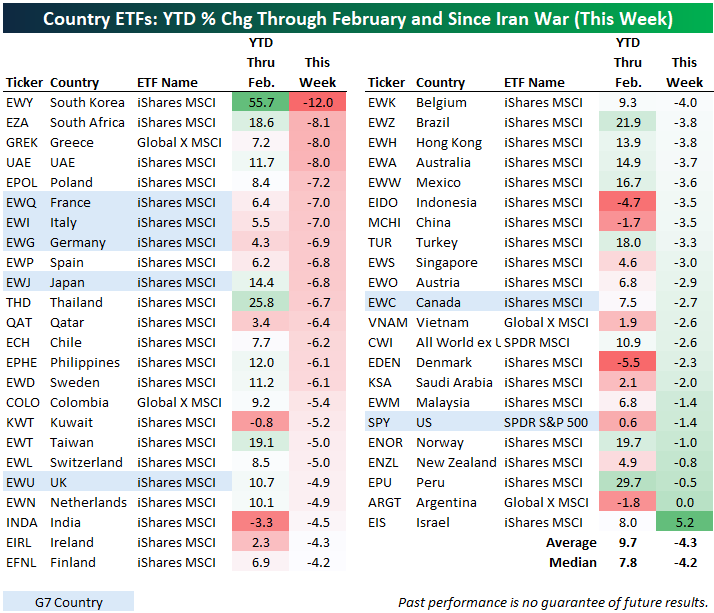
Below is a snapshot of 45 country ETFs traded on US exchanges, along with the all-world ex-US ETF (CWI). On average, these ETFs were up 9.7% year-to-date through February, but based on where they’re trading in the pre-market, they’re down an average of 4.3% already this week since the weekend attack on Iran.
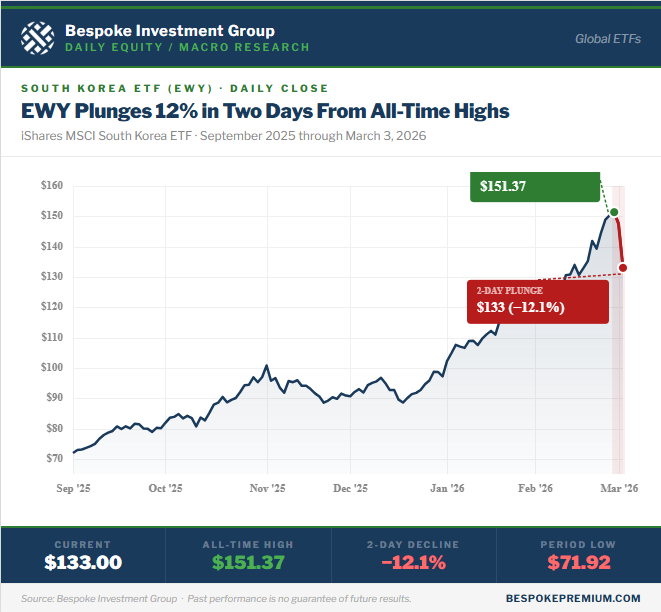
The four hardest hit country ETFs have been South Korea (EWY), South Africa (EZA), Greece (GREK), and the UAE (UAE). All four of these are down 8% or more this week, with South Korea (EWY) down the most at 12%.
Israel (EIS) is the only country ETF that is up since the Iran attack with a gain of 5.2%, while the US (SPY) is down just 1.4%, the sixth best performer. Other country ETFs that have yet to get hit hard include Argentina (ARGT), Peru (EPU), New Zealand (ENZL), Norway (ENOR), and Malaysia (EWM).
Below is a six-month price chart of the South Korea ETF (EWY), which was easily the best performer of the group recently through the end of February. Its 2-day drop of 12.1% only brings it back to levels it was trading at a couple of weeks ago.
Like this analysis? Join our premium members by starting a trial today! Click below for details on how to sign up: