Q3 2025 Earnings Conference Call Recaps: American Express (AXP)
Bespoke’s Conference Call Recaps use AI to summarize lengthy earnings calls. The commentary below is AI-generated and then edited by Bespoke for quality control. As always, none of these summaries should be construed as recommendations to buy or sell any securities, and investors should do their own research and/or consult with a financial professional before making any investment decisions.
Our latest recap available to Bespoke subscribers covers American Express’ (AXP) Q3 2025 earnings call.
![]()
American Express (AXP) is a global payments and financial services company known for its premium credit cards, travel services, and expansive merchant network. It serves affluent consumers, small businesses, and corporate clients through charge and credit cards, lending, and travel-related offerings. The company’s closed-loop network, where it issues cards, processes transactions, and acquires merchants, provides rich data on consumer and business spending trends. Amex is especially strong in the premium segment, catering to high-income customers who spend roughly three times more than the average cardholder, offering insights into discretionary spending, global travel demand, and broader consumer confidence. AXP posted record quarterly revenue of $18.4B (+11% YoY) and EPS of $4.14 (+19%). The refreshed US Platinum Card drove a surge in new accounts (2x pre-launch levels) and strong engagement across retail (+12%) and travel (+14% in premium airfare). Millennials and Gen-Z now represent 36% of spend, transacting 25% more than older cohorts. Credit quality remained pristine, with delinquencies still below 2019 levels. International spend rose 13% FX-adjusted, and non-US Platinum volumes climbed 24%, signaling durable global demand. The stock rose 7.2% on 10/17 in reaction to better-than-expected results…
Continue reading our Conference Call Recap for AXP by becoming a Bespoke Institutional subscriber. You can sign up for Bespoke Institutional now and receive a 14-day trial to read our newest Conference Call Recap. To sign up, choose either the monthly or annual checkout link below:
Q3 2025 Earnings Conference Call Recaps: Interactive Brokers (IBKR)
Bespoke’s Conference Call Recaps use AI to summarize lengthy earnings calls. The commentary below is AI-generated and then edited by Bespoke for quality control. As always, none of these summaries should be construed as recommendations to buy or sell any securities, and investors should do their own research and/or consult with a financial professional before making any investment decisions.
Our latest recap available to Bespoke subscribers covers Interactive Brokers’ (IBKR) Q3 2025 earnings call.
![]()
Interactive Brokers Group (IBKR) is a global electronic brokerage firm offering direct-access trading and clearing services. With operations spanning over 160 markets and more than 3 million accounts globally, it serves individual investors, prop traders, advisors, and hedge funds. Offering products such as overnight global trading, forecast contracts and crypto solutions, IBKR gives insight into the intersection of retail and institutional trading, macro flows and technology-driven brokerage trends. In Q3, IBKR delivered net revenues up 21%, client equity rising 40% YoY and new accounts topping 790k to push total accounts past 4 million. The firm benefitted from a favorable interest-rate backdrop, yet warned that each 25 bp cut in Fed funds could reduce annual net interest income by about $77 million. Securities-lending and margin balances grew strongly, driven by short activity, M&A/IPO catalysts and leverage appetite. The crypto business surged (volumes up 87% QoQ and 5x YoY), with European rollout via partner Zero Hash and stable-coin funding in motion. IBKR also advanced its tech-platform strategy via AI-powered tools (“Connections”, “Investment Themes”) and expanded its prediction-market product set (ForecastEx). The stock fell 3.3% despite stronger EPS and revenue than estimates…
Continue reading our Conference Call Recap for IBKR by becoming a Bespoke Institutional subscriber. You can sign up for Bespoke Institutional now and receive a 14-day trial to read our newest Conference Call Recap. To sign up, choose either the monthly or annual checkout link below:
S&P 500 and Gold Volatility Traits
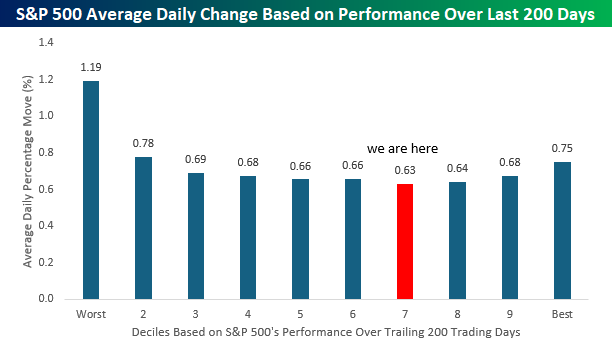
When it comes to the stock market, investors quickly learn of the inverse relationship between performance and volatility. When prices rise, the VIX usually declines, and when the VIX surges as it did back in April, or any other market emergency, stocks crater. The chart below illustrates that relationship. In it, we grouped every 200-trading day window of the S&P 500 since 1975 into deciles based on the index’s performance during those periods. The weakest periods were grouped into decile one while the best 200-day periods went into decile ten. For each of those periods, we then calculated the S&P 500’s average absolute daily move.
The S&P 500’s average absolute daily move during its worst 200-day trading periods was 1.19%, and just experiencing the weakness of April, that makes perfect sense. More interestingly, outside of decile one, the average daily move immediately plummets to 0.78% in decile two, and from there, it remains at or around that level (at least relative to the 1.19% level from decile one) for every decile out to ten. For the current environment, we’re currently in decile seven where the average daily move is lower than any other decile.
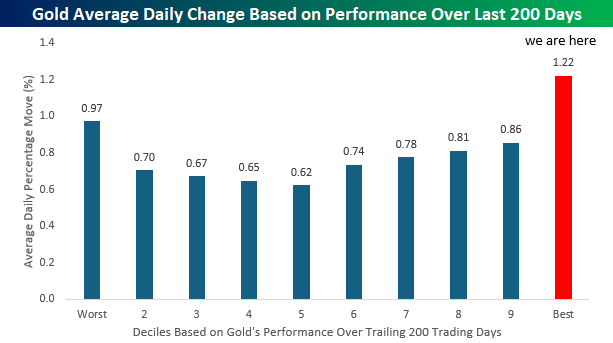
While there’s an inverse relationship between the S&P 500’s performance and volatility, for gold, it’s nearly the opposite. The chart below shows the same analysis for gold. While gold has also historically been volatile during periods when its performance has been the weakest, the strongest returns have historically come during periods when its trailing 200-day performance has been the strongest. During the strongest 200-day periods for gold since 1975, its average daily move has been +/-1.22%, or 25 basis points more than any other decile. Maybe not what you would expect, but for gold to be an uncorrelated asset, when stocks go crazy in one direction, it should go crazy in the opposite way. What makes the current period interesting is that while the S&P 500 falls into decile seven in terms of its trailing 200-day performance, gold’s performance over the last 200 trading days ranks among the best on record since 1975. In other words, they’ve actually been correlated assets so far this year!

Bespoke’s Morning Lineup – 10/20/25 – Unchanged Since the Shutdown
See what’s driving market performance around the world in today’s Morning Lineup. Bespoke’s Morning Lineup is the best way to start your trading day. Read it now by starting a two-week trial to Bespoke Premium. CLICK HERE to learn more and start your trial.
“It’s unbelievable how much you don’t know about the game you’ve been playing all your life.” – Mickey Mantle

Below is a snippet of commentary from today’s Morning Lineup. Start a two-week trial to Bespoke Premium to view the full report.
The government remains shut down this morning as the stalemate between the two parties nears the start of its fourth week. As has been the case nearly the entire time, though, the markets seem indifferent as the S&P 500 will open today pretty much right where it was when the shutdown started. Interest rates are little changed this morning as the 10-year yield remains right at 4%. Crude oil is trading about 1% lower, right at $57 per barrel, and as has been the case for seemingly every day, gold prices are 1.5% higher, but still over 2% off record highs after Friday’s sharp reversal lower. Along with higher gold prices, crypto is also strong this morning with Bitcoin back above $110K and Ethereum back above $4,000. There’s not much economic data due to the shutdown, but the pace of earnings this week will really fill the void.
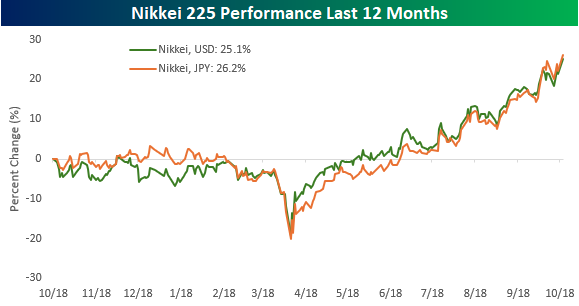
In Asia overnight, Japan surged more than 3% to new record highs after the LDP and Innovation Party agreed to form a coalition government, paving the way for Takaichi to become Prime Minister effective tomorrow. Elsewhere in the region, Chinese GDP rose more than expected, while Unemployment in Hong Kong rose more than expected.
Japan’s rally overnight pushed the index’s ‘marathon’ gain over the last 12 months to 26.2% in local currency terms, and interestingly enough, for all the fluctuations in global currencies this year, the dollar and yen haven’t moved much relative to each other, so on a dollar-adjusted basis, the Nikkei is up slightly less at 25.1%.
European markets aren’t as strong as Asia this morning, but they have a positive bias nonetheless. The STOXX 600 is up 0.6% to start the week. The CAC-40 is the only major benchmark not in the green as S&P lowered the country’s credit rating and an adverse legal ruling against BNP Paribas has that stock trading down over 5%.
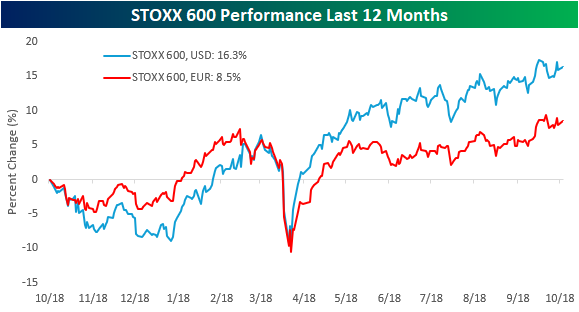
Not only is Europe up less than Japan in early trading today, but the STOXX 600 is also lagging over the last year. As shown in the chart below, on a local-currency basis, Europe’s benchmark index is up a relatively modest 8.5% and trading just shy of new highs. After accounting for the weakness in the dollar this year relative to the dollar, though, it’s up nearly twice that at 16.3%. Depending on which side of the Atlantic you’re on, the performance of European stocks looks a lot different.
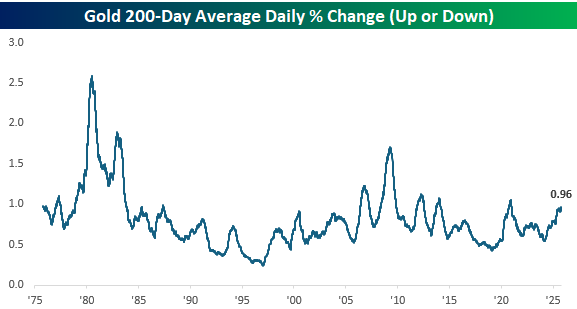
The weakness in the dollar against currencies like the euro has helped to drive the rally in gold, but in addition to being so strong lately, gold has also been volatile. Over the last 200 trading days, gold’s average daily move has been just under 1% which is the most volatility over a trailing 200-day period since Covid, but nowhere near historical extremes like we saw in the 1980s.
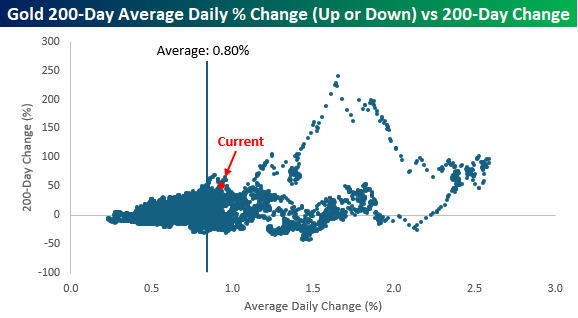
In the equity markets, volatility and large daily moves tend to occur during periods of market weakness, but for gold, that hasn’t necessarily been the case. In periods when gold has rallied 30%+ in 200 days, its average daily change was 1.27% whereas in all other periods, its average daily change was much less at just 0.76%.
Brunch Reads – 10/19/25
Welcome to Bespoke Brunch Reads — a linkfest of some of our favorite articles over the past week. The links are mostly market-related, but there are some other interesting subjects covered as well. We hope you enjoy the food for thought as a supplement to the research we provide you during the week.
Be Kind. Rewind: On October 19, 1985, the very first Blockbuster Video store opened in Dallas, Texas, changing how Americans watched movies. Blockbuster wasn’t just another mom-and-pop video rental shop, but a sleek, systematized operation that could stock thousands of titles at once, all neatly arranged by genre and alphabetized for easy browsing. At a time when most video stores carried only a few hundred tapes, walking into Blockbuster felt like entering a movie lover’s paradise. By the 1990s, those blue-and-yellow storefronts were everywhere. There were more than 9,000 locations worldwide at its peak. Families made Friday night trips to Blockbuster a ritual, hoping the latest release hadn’t already been rented out (imagine if you couldn’t watch a movie on your favorite streaming service because too many people wanted to watch at once!).
Unfortunately for all of us who held Blockbuster near and dear, its reign didn’t last forever. Netflix’s rise and the overwhelming transition to streaming hit the rental giant hard, and by the early 2010s, its empire collapsed. Blockbuster was a place to discover films in a shared, physical space, which is a nostalgic experience that today’s younger generations miss out on, despite its inconvenience compared to streaming. We’ll never forget wandering the aisles, looking at cover art, and finding a movie we would’ve never otherwise watched with our friends and family.

Markets & Investing
Gundlach Sees Private Credit As Top Candidate To Start Next Financial Crisis (Financial Advisor Magazine)
Jeffrey Gundlach warned that private credit could trigger the next financial crisis, calling it the top risk in today’s markets. He said competition among lenders has turned cutthroat and compared private credit ETFs to “square pegs in round holes.” Gundlach argued the industry’s marketing misleads investors about risk and volatility, drawing parallels to the pre-2008 buildup of toxic debt. [Link]
Continue reading our weekly Brunch Reads linkfest by logging in if you’re already a member or signing up for a trial to one of our two membership levels shown below! You can cancel at any time.

The Bespoke Report – Long and Hedged – 10/17/25
To read our weekly Bespoke Report newsletter and access everything else Bespoke’s research platform offers, start a two-week trial to Bespoke Premium.

Bespoke’s Morning Lineup – 10/17/25
See what’s driving market performance around the world in today’s Morning Lineup. Bespoke’s Morning Lineup is the best way to start your trading day. Read it now by starting a two-week trial to Bespoke Premium. CLICK HERE to learn more and start your trial.
“The main purpose of the stock market is to make fools of as many men as possible.” – Bernard Baruch
Below is a snippet of commentary from today’s Morning Lineup. Start a two-week trial to Bespoke Premium to view the full report.
Equity markets have seen volatility tick up as we enter the second half of October, which is very typical for this time of year. US index futures were down more than 1% a few hours ago, but they’ve rallied back to the flat-line after President Trump made comments diffusing trade drama with China.
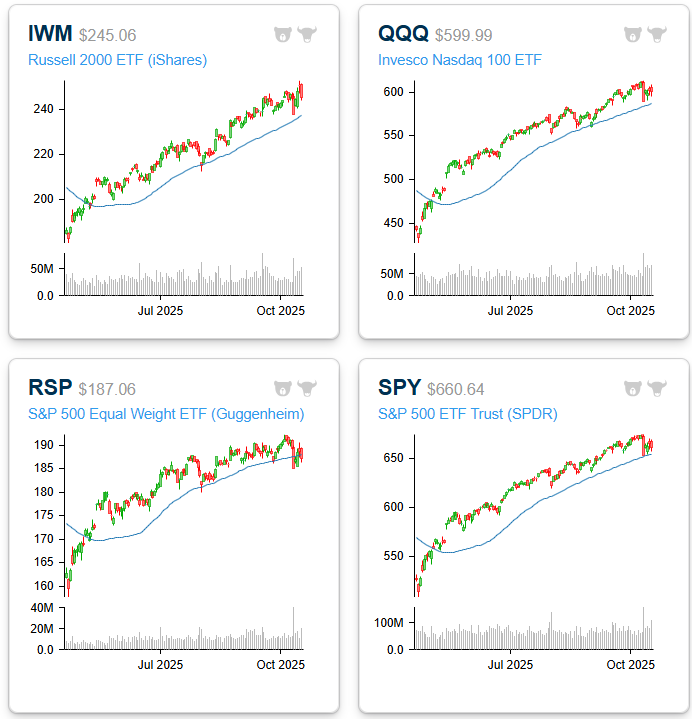
As shown below, key index ETFs remain within their long-term uptrends above their 50-day moving averages, with the exception of the S&P 500 Equal Weight.
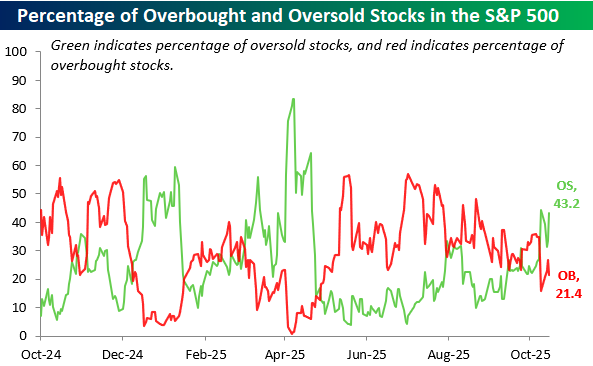
While cap-weighted large-cap indices remain strong on the surface, a much higher percentage of stocks in the S&P are now oversold (43.2%) than overbought (21.4%).
The Closer – Data Center Credit, Homebuilders, Margins – 10/16/25
Log-in here if you’re a member with access to the Closer.
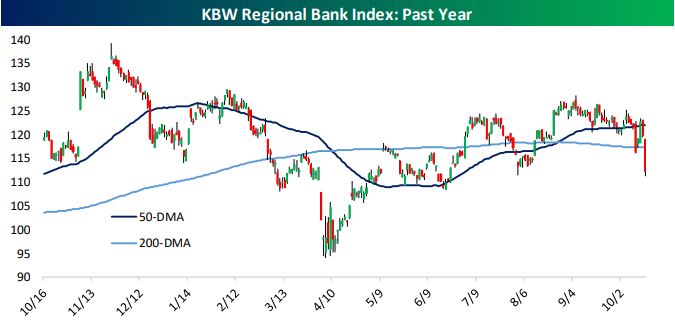
Looking for deeper insight into markets? In tonight’s Closer sent to Bespoke Institutional clients, we start with a look at the pain in regional banks (page 1) in addition to the happenings in data center credit markets (page 2). After that, we check in on homebuilders (page 3) before switching over to macro data that includes an update of our Five Fed Composite (page 4), New York area service sector data (page 5), and the close out with commentary on some macro trends playing out in earnings (page 6).
See today’s full post-market Closer and everything else Bespoke publishes by starting a 14-day trial to Bespoke Institutional today!
Q3 2025 Earnings Conference Call Recaps: Big Banks & Asset Managers
Bespoke’s Conference Call Recaps use AI to summarize lengthy earnings calls. The commentary below is AI-generated and then edited by Bespoke for quality control. As always, none of these summaries should be construed as recommendations to buy or sell any securities, and investors should do their own research and/or consult with a financial professional before making any investment decisions.
Our latest recap, available to Bespoke subscribers, covers Q2 2025 earnings calls from BlackRock (BLK), Citigroup (C), Goldman Sachs (GS), JPMorgan (JPM), Wells Fargo (WFC), Bank of America (BAC), and Morgan Stanley (MS).
The third quarter of 2025 showed steady, broad-based strength across Wall Street as capital markets regained momentum and consumer strength held firm. Goldman Sachs (GS) reported a 42% jump in investment banking fees, while JPMorgan Chase (JPM) and Bank of America (BAC) each saw double-digit growth as corporate confidence returned amid policy clarity on tariffs and taxes. Wells Fargo (WFC) gained 120 bps of US market share in investment banking and advised on the year’s largest deal, Union Pacific’s $85B acquisition of Norfolk Southern. AI adoption became a central theme. Citi (C) reported 7 million internal AI tool uses and BlackRock (BLK) projected $1.5 trillion in data-center investment needs over the next five years, signaling technology’s accelerating impact on efficiency and infrastructure demand. Credit quality remained healthy, deposit flows stable, and interest-rate sensitivity manageable despite expectations for further rate cuts in 2026. Regulatory recalibration, including anticipated Basel III and G-SIB relief, was seen as a tailwind. Overall, banks entered the final quarter with revived deal pipelines, strong household balance sheets, and a clear focus on turning AI enthusiasm into tangible productivity gains…
Continue reading our Conference Call Recap for BLK, C, GS, JPM, WFC, BAC, and MS by becoming a Bespoke Institutional subscriber. You can sign up for Bespoke Institutional now and receive a 14-day trial to read our newest Conference Call Recap. To sign up, choose either the monthly or annual checkout link below:
Bespoke’s Morning Lineup – 10/16/25 – Sentiment Weakens
See what’s driving market performance around the world in today’s Morning Lineup. Bespoke’s Morning Lineup is the best way to start your trading day. Read it now by starting a two-week trial to Bespoke Premium. CLICK HERE to learn more and start your trial.
“‘That didn’t work’ is cool, but ‘that won’t work’ is not a way to go through life.” – John Mayer
Below is a snippet of commentary from today’s Morning Lineup. Start a two-week trial to Bespoke Premium to view the full report.
A triple play from Taiwan Semiconductor (TSM)—beating on earnings, revenue, and guidance—is lifting US equity futures, with technology stocks at the forefront. This rally is notably happening despite the President stating yesterday after the close that, “We are in one now,” in reference to a trade war with China. There are also signs that China’s aggressive stance on rare earth exports could be backfiring, as it has started to cause a more unified front between the US and other international partners.
Today was supposed to be a busy one for economic data, but the government shutdown put the kibosh on that, and the only report released was the Philly Fed Manufacturing report, which came in weaker than expected. The pace of earnings, however, remains active, and once again this morning, we’re seeing generally strong results.
Outside of equities, crude oil is fractionally higher but still well below $59 per barrel, the 10-year yield is trying to hang on to 4%, gold and other precious metals are rallying (what else is new), and crypto is also rallying after what has been a rough week for the sector.
It’s been a somewhat rocky week for US equities, although by the standards of October, it’s hard to get too worked up. After trading at an all-time high intraday last Thursday, the S&P 500 closed modestly lower on the day. That modest decline was followed on Friday by a sharp 2.7% decline in the S&P 500 as trade issues with China and concerns over corporate credit in the auto sector nudged investors to take some risk off the table. This week started on a positive note as the S&P 500 erased half of the losses from last Thursday and Friday, but intraday trading has been more volatile, and there’s been more of a tendency to sell rips than buy dips.
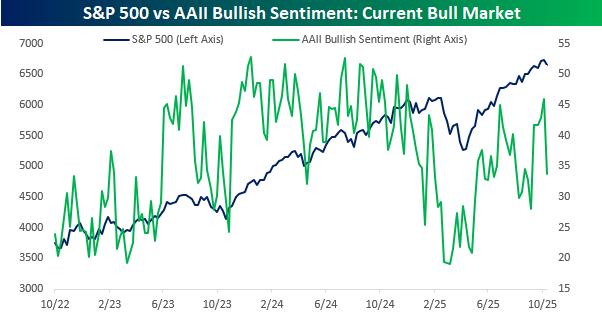
The skittishness showed up in investor sentiment this week as the weekly American Association of Individual Investors (AAII) survey showed that bullish sentiment dropped from 45.9% to 33.7% for the lowest reading in a month. The decline in bullish sentiment comes even as the S&P 500 closed within 2% of a record high yesterday. While bullish sentiment was routinely near 50% throughout 2024 as the market rallied, in the bounce off the April lows, investors have been much less willing to hop on the bandwagon.
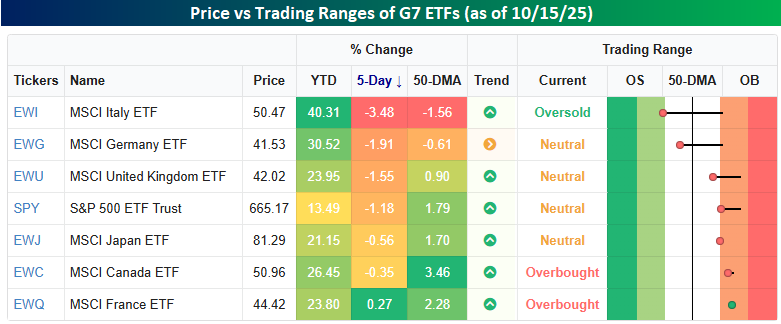
Along with the modest weakness in US stocks over the past five trading sessions, global equities have also been under pressure. Of the US-traded ETFs tracking the stock markets of the seven G7 countries, all but France (EWQ) traded lower in the five trading days ended yesterday, and the US was stuck right in the middle with a decline of 1.2%. The biggest laggards have been Italy (EWI) and Germany (EWG) as their the only two below their 50-DMAs. Markets have certainly been on a tear this year as six of the seven ETFs listed have rallied at least 20% this year, but in the short run, they’ve mostly worked off their overbought conditions as France is the only country still in extended territory.