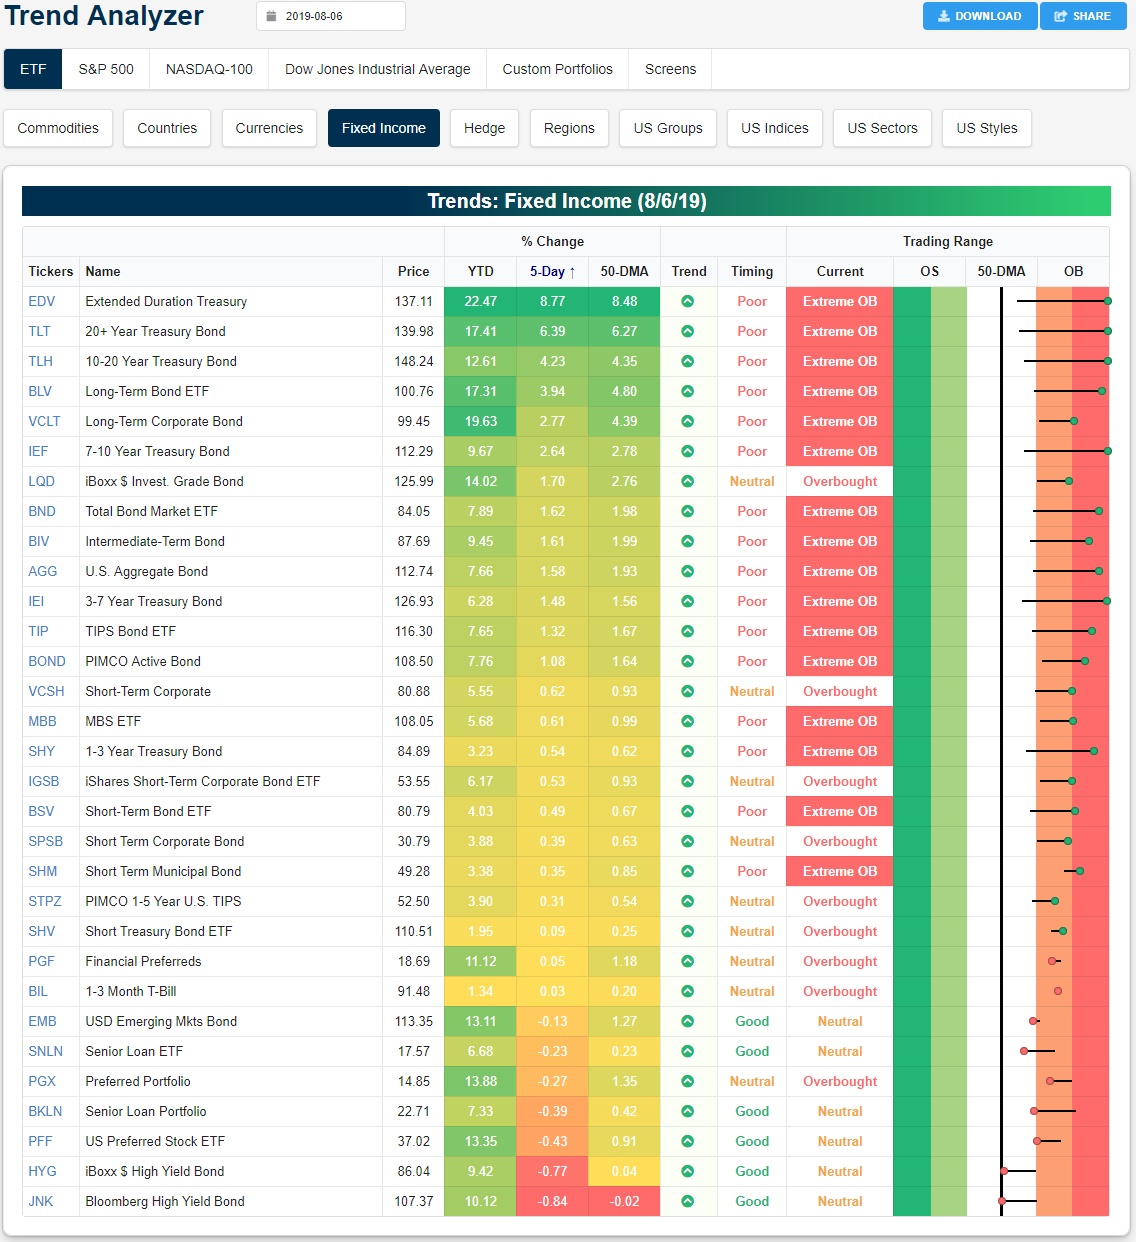
Trend Analyzer – 8/7/19 – Fixed Income Running Hot
Although major equity indices managed a modest rebound yesterday, they all still sit over 4% lower versus last week. The Micro-Cap (IWC) has seen even worse declines in this time with a decline of 6.52%. IWC is also the only major index ETF in extreme oversold territory and in a downtrend over the past six months. While the Russell 2000 (IWM) is also oversold, the rest of the ETFs have actually moved into neutral territory following yesterday’s gains. But keep in mind the fact that one week ago, all of these ETFs were overbought across the board.

While risk assets have gotten hit hard, fixed income has been surging. So much so that of the 31 fixed-income ETFs in our Trend Analyzer, 15 are now over 2 standard deviations above the 50-DMA. Medium to long term treasury ETFs tracking the 3-7 year (IEI), 7-10 year (IEF), 10-20 year (TLH), 20+ year (TLT), and the Extended Duration Treasury (EDV) are all even more extended at over 3 standard deviations above the mean. These have also gained the most in the past week with EDV seeing the largest gains at 8.1%. Meanwhile, high yield credit has declined. The Bloomberg High Yield Bond ETF (JNK) and iBoxx High Yield Bond ETF (HYG) have fallen 1.43% and 1.36%, respectively. Senior loans (SNLN) and Preferred Stock (PFF) have also fallen. Start a two-week free trial to Bespoke Institutional to access our interactive Trend Analyzer and much more.
Bespoke’s Morning Lineup – The Death of Yields
Global equities were trying to stabilize around the world overnight and this morning. Chinese equities were modestly lower, Japanese stocks were mixed, and Europe was rallying. US futures, for their part, were positive but have now given up all of those early gains and are firmly negative. Oil is modestly lower, precious metals like gold and silver are breaking out, while cyclical metals like copper are flat and iron ore is in free fall with a five-day decline of over 20% as trade fears hurt the outlook for global growth. The real story this morning is the collapse in yields both here in the US and around the world.
Continue reading in today’s Morning Lineup.
Bespoke Morning Lineup – 8/7/19

The Closer – Turnaround Holds True; Wither Energy – 8/6/19
Log-in here if you’re a member with access to the Closer.
Looking for deeper insight on markets? In tonight’s Closer sent to Bespoke Institutional clients, we cover quite a few topics including what led the bounce back today, S&P 500 sector weightings and the drop to multi-decade lows for Energy, analyst buy ratings by sector, and the average share price of stocks in the S&P 500.
See today’s post-market Closer and everything else Bespoke publishes by starting a 14-day free trial to Bespoke Institutional today!
Agriculture Data Lagging Stocks
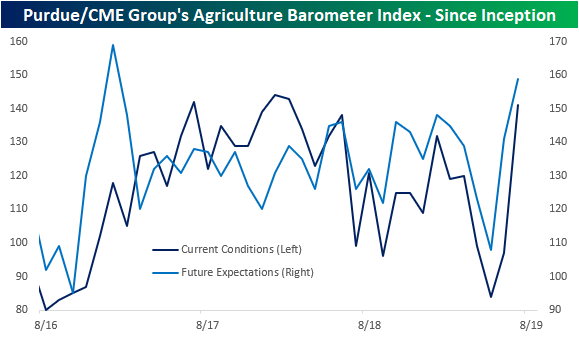
The Purdue University/CME Group’s Agriculture Barometer Index released today at its joint highest level since January 2017. The index—which surveys 400 agriculture producers on economic/industry sentiment— saw solid gains in both current and future expectations. In fact, the index for current conditions jumped 44 points to 141; the largest increase since the barometer’s inception. As with the headline reading, expectations rose to 159 which is the highest level since January 2017.
The major caveat to these numbers is the timing of the survey. The survey was conducted from July 15th to the 19th which would not pick up effects from recent trade developments. Throughout the ongoing trade war, US agriculture has been a major bargaining chip for China. The most recent spat has resulted in China officially ceasing the purchase of US agricultural products. Additionally, the effects of the USDA’s Market Facilitation Program which is essentially relief to farmers affected by tariffs is also likely to not be factored into this data. In other words, it is hard to put much weight on these numbers given all that has occurred since the data collection period.
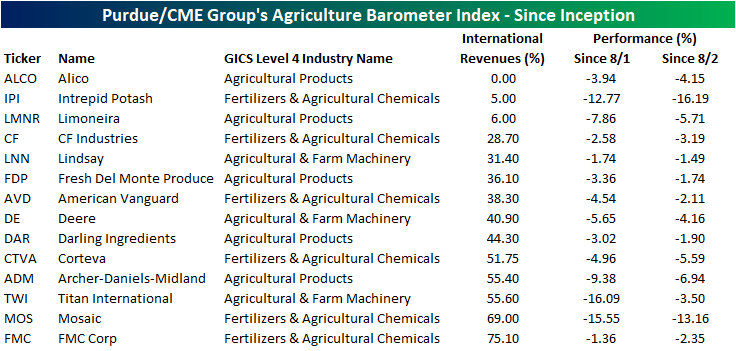
Although it is too early to show up in some economic data points, stock prices of agriculture-related business have underperformed since trade tensions ramped up last week. In the table below, we show the stocks in the S&P 500 and Russell 2000 with an agricultural focus. As shown, not a single one has risen since last Thursday when the President initially announced more tariffs, and each one has also fallen since Friday’s close (last price before China’s retaliation). While the broader market has also declined in this time, these agriculture stocks have more dramatically underperformed falling 6.4% on average since August 1st versus a 2.6% decline in the S&P 500 and 3.45% decline in the Russell. Some of these stocks that have seen the worst declines also boast the highest degree of international exposure. The three worst performers are Intrepid Potash (IPI), Titan International (TWI), and Mosiac (MOS) which have all fallen double-digits in just the span of a few days. They also have the added catalysts of weak earnings on top of headline news. TWI reported Thursday morning and MOS and IPI reported this morning. Start a two-week free trial to Bespoke Premium to access Bespoke’s most actionable research reports.
JOLTS Stronger Than Expected
This morning’s release of the Job Openings and Labor Turnover Survey (JOLTS) for the month of June showed a stronger than expected picture in terms of the number of job openings, while last month’s was revised higher. Economists were expecting the number of job openings to come in at 7.326 million but the actual level was 22K stronger at 7.348 million. Besides the fact that the June reading was higher than expected, the most notable aspect of the JOLTS report continues to be how there are more job openings than there are available workers. The shift in the jobs vs. available workers dynamic first shifted in February 2018 but has remained that way ever since and currently stands at 1.373 million more jobs than there are workers. While the ‘shortage’ of workers raised concerns that it would accelerate upward pressure on wages, at this point we have yet to see signs that wages are beginning to spiral out of control.
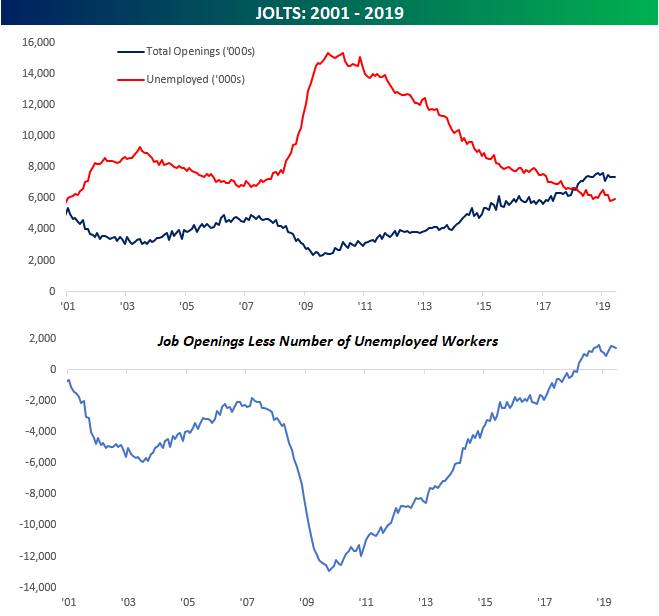
While the above picture portrays a jobs market that is red hot, we would note that there has been some slowing in recent months. As shown in the chart below, the last time the JOLTS survey made a new high was seven months ago in November. Things are far from falling off a cliff when it comes to the employment picture, but for the time being, they aren’t accelerating either. Start a two-week free trial to Bespoke Institutional to access our interactive economic indicators monitor and much more.
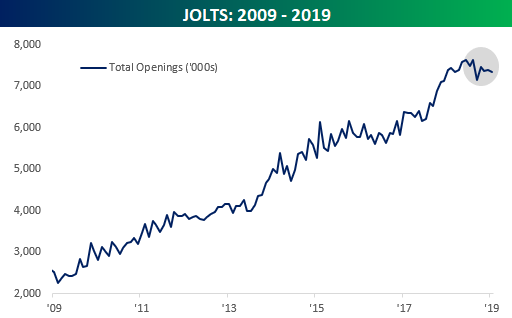
Chart of the Day: Summer Flops for Disney (DIS)
In today’s Chart of the Day, we preview Disney’s (DIS) upcoming earnings report and also highlight a key trend that has historically impacted the performance of its stock following prior August earnings reports.
To view the report and see how Disney tends to react to its August earnings reports, start a two-week free trial to any of our research membership levels.
Trend Analyzer – 8/6/19 – What A Difference One Week Makes
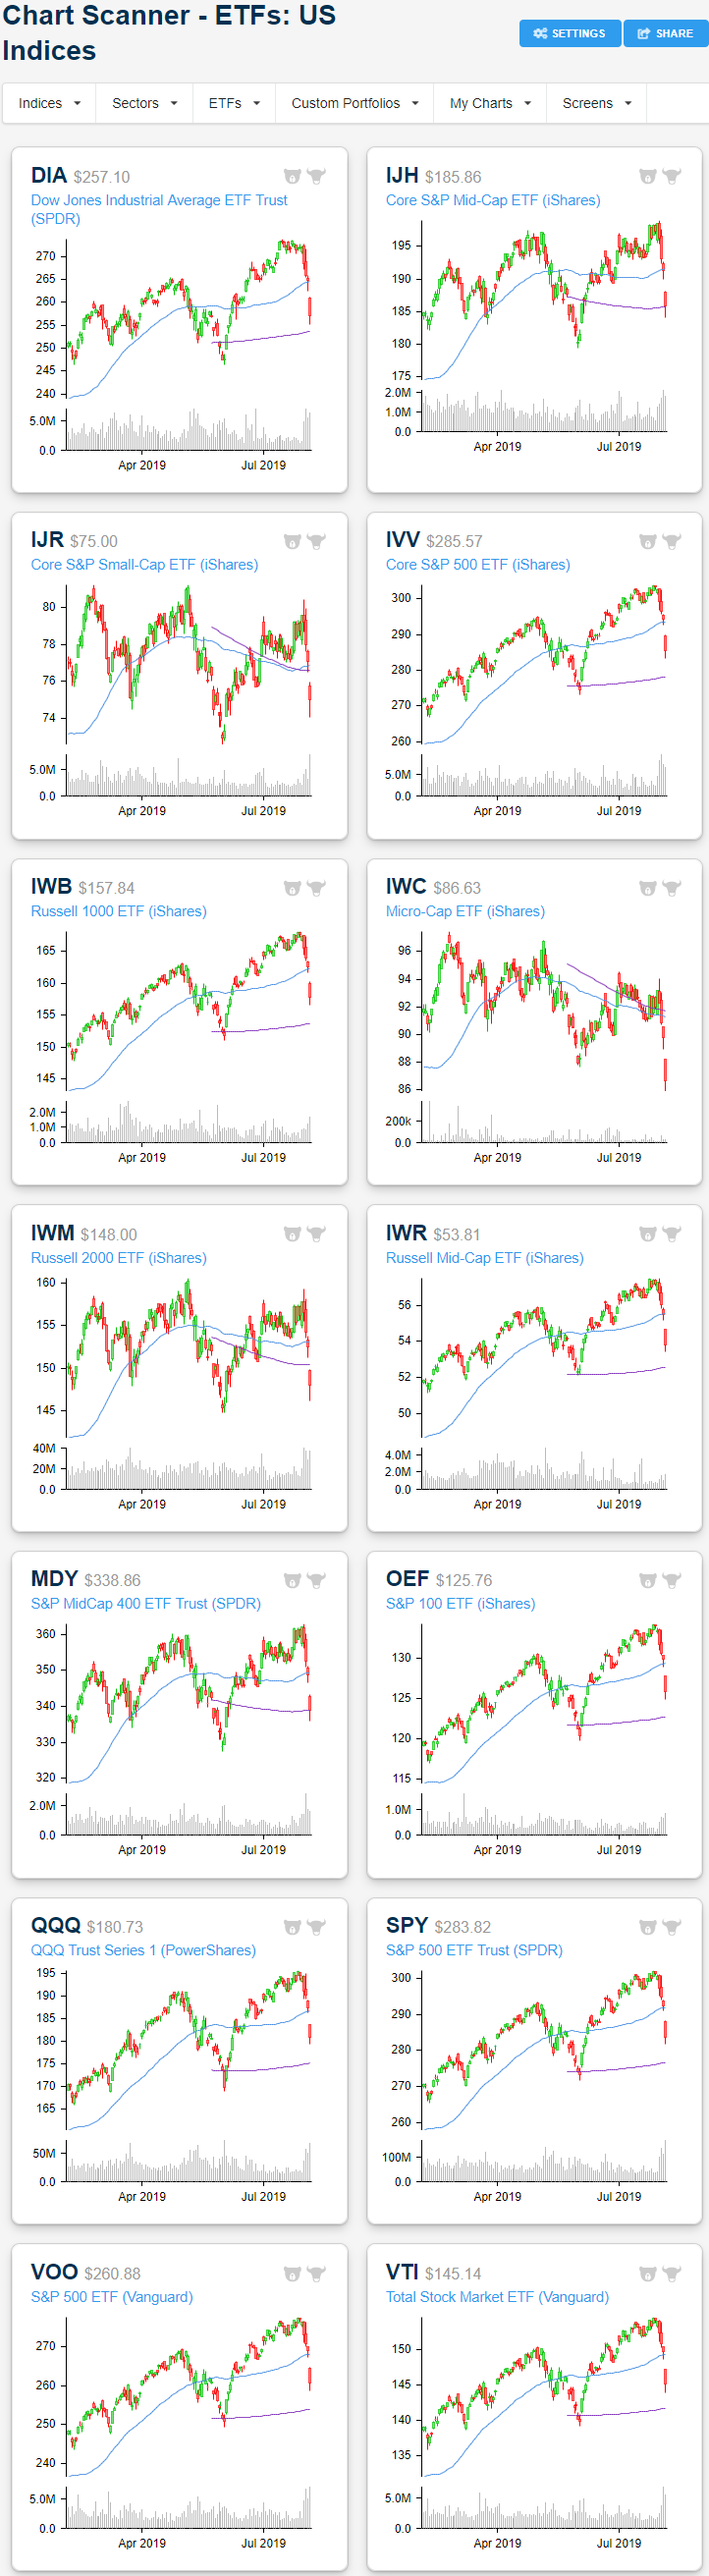
As we mentioned in a series of tweets earlier this morning, our Trend Analyzer one week ago looked a bit different than it does now. Last week, before the FOMC rate decision and the escalation of tariff tensions sent markets into a tailspin, almost all of the major US indices were overbought and had distanced themselves above their 50-DMAs. Now, in the Trend Analyzer, the reverse is true as every major index ETF has crashed through their respective 50-days, leaving ten of the fourteen oversold. Leading the way to the downside, the Micro-Cap (IWC) ETF is about as oversold as it gets as it has fallen over 3 standard deviations below the 50-DMA. With the most recent move lower, IWC is now showing a downtrend as well; the only one to show this. The four that are not oversold are just barely neutral and it would take only a little more downside for them to join the others. Ironically, one of these is the Nasdaq 100 (QQQ). While not by any significant degree, QQQ is just above oversold levels even after a 7.14% decline over the past week; the most of any major index ETF. The Nasdaq 100 has fallen more sharply than its peers as all of the others have seen declines of somewhere between 4.75% and just over 6% in that same time frame.

The past week’s steep declines have done some damage to the chart setups of these same ETFs. Across all of these ETFs, recent shorter-term uptrends have all been broken in addition to the 50-DMAs providing little to no support after yesterday’s steep gap lower at the open. For small caps like the Core S&P Small-Cap ETF (IJR) or the Micro-Cap (IWC), the 200-DMA did not provide any support either. But for mid-caps like the Core S&P Mid-Cap (IJH), buying during the day brought the ETFs off of the day’s lows and back near the 200-DMA. With equities seeing strong pre-market trading today, mid-caps could see a bounce off of this support at the open. Large caps, on the other hand, are more or less in no man’s land between the 50-DMA, 200-DMA, and prior highs and lows. While the past few days’ declines have been steep, we must also note that every major index ETF (except for IWC) is still above the lows from late May/early June. Start a two-week free trial to Bespoke Institutional to access our interactive economic indicators monitor and much more.
Bespoke’s Morning Lineup – Round and Round She Goes…
Where she stops nobody knows. US futures have moved all over the place overnight but are currently pointing to a modestly higher open after Monday’s plunge. Things looked like they would be a whole lot worse shortly after the close yesterday when the US Treasury officially designated China a currency manipulator in what was basically a “surprising-not surprising move.” Surprising in that the timing wasn’t entirely anticipated but not surprising as it’s nothing the President hasn’t been saying incessantly going all the way back to his days on the campaign trail. Well, the initial response from the algos was to sell spoos lower to the tune of 2%, but after the Chinese government fixed the yuan under 7 later on in the night, futures have been grinding higher, erasing all of the initial knee-jerk reaction.
With equity futures rallying, we’re seeing the usual risk-on assets rallying while treasuries and gold ease off their overnight highs. During rudderless times like this, though, it’s important to remember that up futures are as meaningless as down futures in terms of where things will be when we close out the day or even at the open for that matter.
Continue reading in today’s Morning Lineup.
Bespoke Morning Lineup – 8/6/19
The Closer – The Few, The Proud – 8/5/19
Log-in here if you’re a member with access to the Closer.
Looking for deeper insight on markets? In tonight’s Closer sent to Bespoke Institutional clients, as markets were sent reeling today in response to further escalations in the trade war, we show just how few stocks moved higher in today’s session and what performance has looked like following similar weak breadth readings. We also show how substantial the weakness has been across industry groups with a particular focus on semiconductors. We then look at some of the drivers and technicals of the yuan before finishing on some macroeconomic data including the ISM and Markit PMIs and the Sentix investor sentiment survey.
See today’s post-market Closer and everything else Bespoke publishes by starting a 14-day free trial to Bespoke Institutional today!
Investors Turning to Safe Havens
As equities sell-off sharply, cyclical and trade-sensitive businesses, in particular, have fallen on hard times as investors rotate into defensives. While still down today, sectors like Utilities, Consumer Staples, and Real Estate have held up slightly better. In commodities, this same dynamic has played out. Copper, which is a bellwether for global manufacturing activity, has fallen sharply in response to trade tensions and concerns over global growth. Meanwhile, gold’s safety status has led it to rally. In Monday’s session, gold has been one of the few assets to rally, rising 1.84% from Friday’s close. Looking at the ratio between the two commodities over the past few years shows just how much gold has been outperforming. While it has been rising slowly over the past year, the ratio has really ripped higher in the past week. In fact, over the past week, the relative strength of gold versus copper has seen its largest short-term move since February 2016.

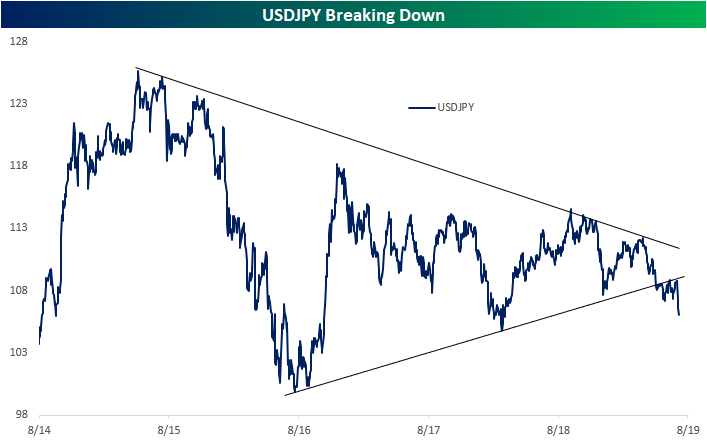
Similarly, the Japanese Yen which is commonly viewed as a safe haven currency has been surging versus the dollar. Over the past several years, USDJPY has been in consolidation. After bottoming this time of year in 2016, the cross made a series of higher lows and lower highs. Earlier this year, USDJPY failed to take out the downtrend line, continuing to move below the uptrend line. Now, over the past few sessions, the Yen has further appreciated as global trade tensions mount. Start a two-week free trial to Bespoke Institutional to access our interactive economic indicators monitor and much more.