
Bespoke CNBC Appearances (9/10 and 9/6)
Below are links to two recent CNBC segments with Bespoke co-founder Paul Hickey. To view the segments, click on the links below.
Trading Nation – 9/6/19 – Special Chart Suggest the Market is Starting a Hot Streak

S&P 500 Breakout Stocks
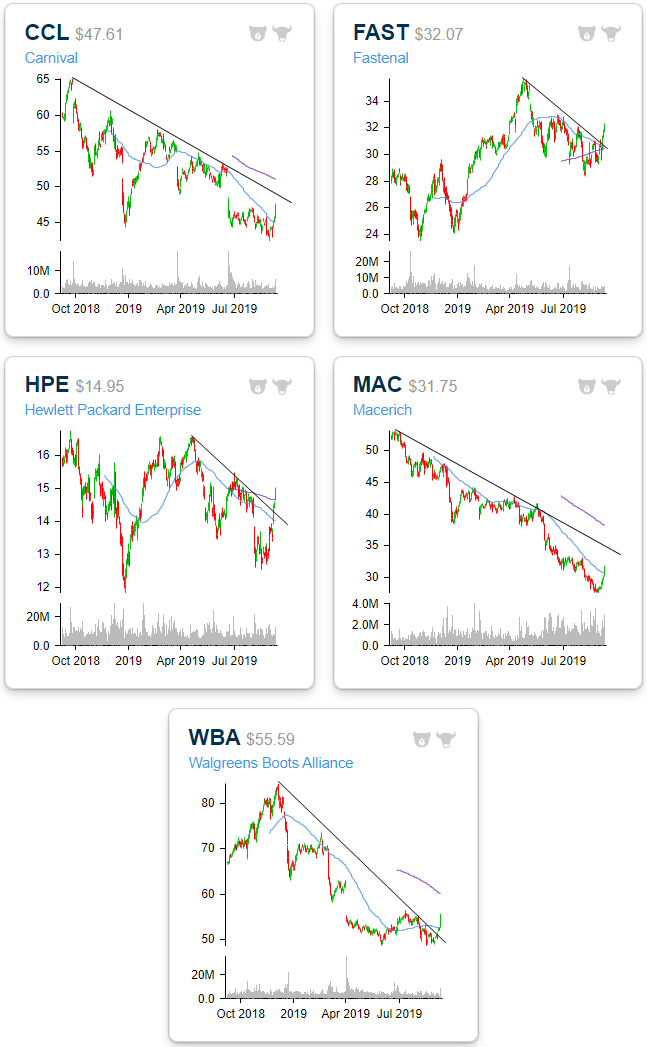
As we have previously noted, some of the stocks that have been the most beaten down this year have been experiencing distinct outperformance recently. While not necessarily the worst YTD performers in the index, below are a handful of charts taken from our Chart Scanner tool that have recently broken above the top of their downtrend channels. This does not necessarily mean that these stocks are looking to completely take a 180 in regards to their long term trends, but at least in the short term, they are showing promise. Notably, as it has been the top performing sector yesterday and today, multiple of these stocks are energy plays.
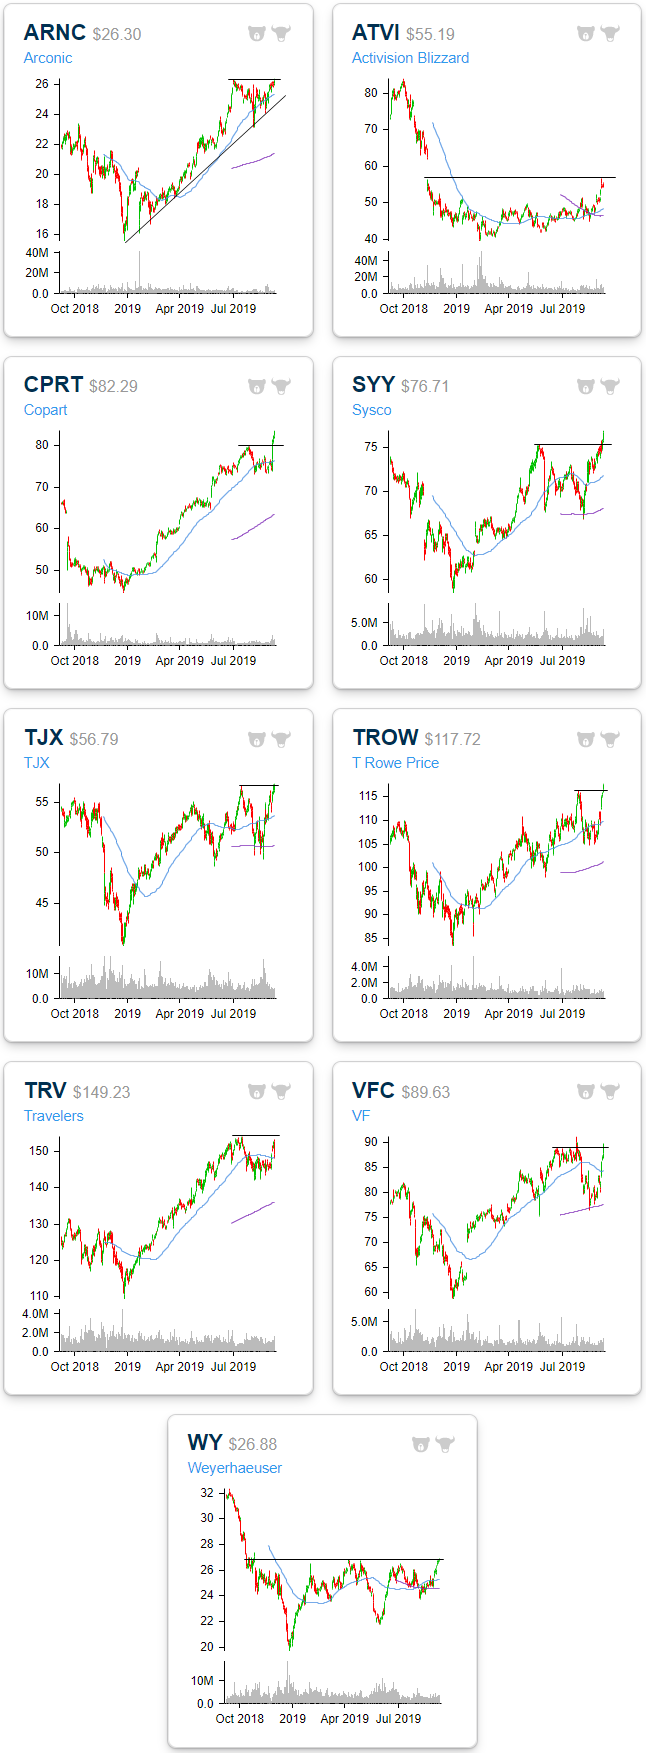
It is not just the stocks that are in downtrends that are showing signs of a breakout. Below are some more stocks that have been in healthy uptrends over the past year or have at least been sideways such as Activision Blizzard (ATVI) and Weyerhauser (WY). For ATVI and WY, both stocks have been in a range for most of the past year. More recently, these two have begun making higher lows and are now at the upper end of these ranges. For ATVI, it’s now looking to fill the large gap from earnings around one year ago. Similarly, Arconic (ARNC), Copart (CPRT), Sysco (SYY), TJX (TJX), T Rowe Price (TROW), and VF Corp (VFC) have all run up to resistance at prior highs, the only difference being these moves are in the context of long term uptrends. In the case of some like CPRT and SYY, the break out is already occurring while others like ARNC and TJX need a bit more work from the bulls. Start a two-week free trial to Bespoke Premium to access our interactive Chart Scanner and much more.
Small Business Sentiment — “Pessimism is Contagious”
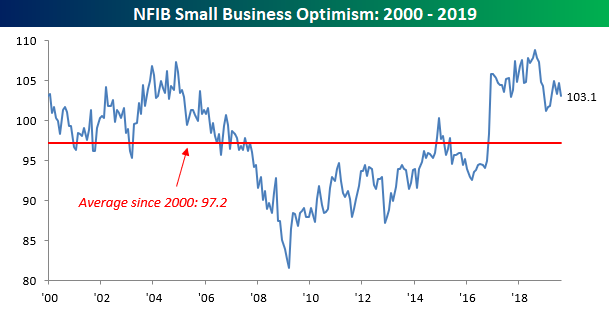
Sentiment on the part of small business owners declined in August and based on the steep drop in interest rates and escalation of the trade war with China, you can’t really blame business owners for becoming more cautious. Overall, the main index of sentiment dropped from 104.7 down to 103.1, which was 0.4 points lower than the 103.5 consensus expectation. In the commentary of the report, the NFIB noted that “in terms of real economic activity, August was a very good month,” and went on to say that “the decline in the index was driven by weakened expectations for the future.” One line that stood out from this month’s report was the statement that “Pessimism is contagious, even when the real economy is doing well, expectations can be infected and turn sour. Those rooting for a recession are having a psychological impact in spite of a strong Main Street economy.” While the statement isn’t entirely inaccurate, we would note that the escalation of tariffs and rhetoric from the President certainly hasn’t helped either.
Looking at the chart below, it has now been a full year since the NFIB Small Business Index made its peak for the cycle. While it isn’t far from that level now, it has shown signs of rolling over in the last few months. If the lows from January are breached, depending on your political perspective, that would suggest that either it’s more than just news headlines driving down sentiment or that the headlines actually won out.
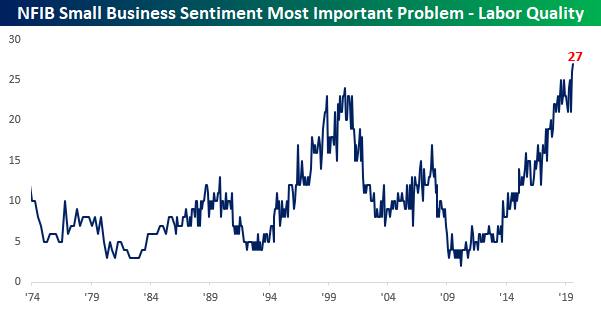
In terms of the biggest problems facing small business owners, Labor Quality remains at the top of the list, rising from 26% to 27%. Behind Labor Quality, Taxes and Red Tape are tied for second at 14% each. It wasn’t that long ago that these two problems topped the list and together totaled over 40%. Today, on a combined basis the two would barely top Labor Quality as the biggest problem. In last week’s ISM reports, we noted that the ISM Commodities surveys were increasingly showing fewer and fewer commodities rising in price. Today, that sentiment of benign inflation was further illustrated by the fact that only 1% of small business owners see Inflation as their most important problem.
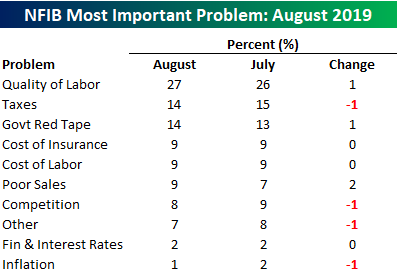
As mentioned above, Labor Quality remains the most important problem for small business owners these days, and in the entire history of the survey, it has never been a bigger problem. At 27%, the level is now comfortably above the 24% peak reached in 2000. While it only seems logical that labor costs would rise as Labor Quality becomes a bigger problem, to this point we have yet to see that play out as only 9% of small business owners noted wage costs as their most important problem. Start a two-week free trial to Bespoke Institutional to access our unparalleled research and interactive tools.
Momentum Massacre
Yesterday saw a nearly unprecedented collapse for stocks with high price momentum relative to stocks with value characteristics. These two baskets of stocks are most easily tracked using the iShares Momentum (MTUM) and Value (VLUE) factor ETFs.
Momentum stocks are those that have been going up; momentum refers to the upward trajectory of price. Value stocks are generally low multiple, and often have the opposite price attributes of momentum stocks. As shown in the chart below, yesterday was an absolutely catastrophic day for Momentum (MTUM) relative to Value (VLUE). Part of this was a function of rates, with recent upticks in short and long term interest rates driving utilities and other defensive stocks with strong trailing momentum lower, while banks rallied. But it was broader than that too: software got smashed while oil & gas stocks surged, automakers ripped while stable consumer staples names took a hit, and the market generally reversed all of the trends it has been operating on so far this year in a massive stop-out of successful (up to now) trading strategies. Start a two-week free trial to Bespoke Institutional to see more details on the blow up of growth-oriented momentum stocks versus value stocks in reports published yesterday.
Bespoke’s Morning Lineup – Quiet Tuesday
See what’s driving market performance around the world in today’s Morning Lineup. Bespoke’s Morning Lineup is the best way to start your trading day. Read it now by starting a two-week free trial to Bespoke Premium. CLICK HERE to learn more and start your free trial.

The Closer – Equity Market Mess, Consumer Credit Press – 9/9/19
Log-in here if you’re a member with access to the Closer.
Looking for deeper insight on markets? In tonight’s Closer sent to Bespoke Institutional clients, we first take a look at the heavy rotation away from defensives and into low multiple cyclicals. We then review the technical set ups of the overall S&P 500, industrials, and the tech sector. We finish with a recap of the Federal Reserve’s monthly update on consumer credit.
See today’s post-market Closer and everything else Bespoke publishes by starting a 14-day free trial to Bespoke Institutional today!
Apple (AAPL) and iPhone Releases
Apple (AAPL) plans to announce the newest version of their iPhone tomorrow (September 10th). Historically, the time leading up to these announcements has seen the stock down in the week and day before. With AAPL up over 2.25% over the past week and also up 0.6% today, the current situation is most similar (in terms of stock price) to 2016 when the company announced the iPhone 7. The stock is similarly weak on the day of new iPhone announcements. The only substantial gain on an iPhone announcement was in 2007 when the company unveiled the very first generation. Other than that, there were only two other times that AAPL moved higher when a new model of the iPhone was unveiled. Fortunately, over the following day and week, the stock’s performance is a little better with gains slightly more than half the time. One month later, though, a period that usually covers the entire span between the announcement and the time the phone typically hits shelves, the probability of a positive response is no better than a coinflip and AAPL is down an average 31 bps.
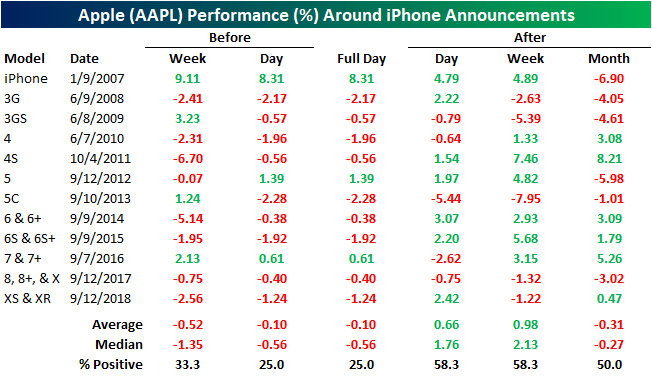
The release (when the phone is actually available for sale) of previous generations of the iPhone have typically come within the month that it gets announced. Following these releases, AAPL’s stock typically makes its way higher over 70% of the time in the week and day before. Immediately after the phone is available for sale, though, AAPL consistently falls. The first day the new version of the iPhone is for sale, AAPL stock averages a decline of a quarter percent while the median is even worse at -0.77%. AAPL also consistently is negative both that day and the following day. Performance one week and one month later is similarly weak, but it has also been positive a little more frequently. Even one month out, though, AAPL was only higher half of the time. Headed into tomorrow, AAPL is coming off of one of the worst post-release stock price responses to a new iPhone. Last October saw the release of the most recent iPhone, the iPhone XR. One month later, the stock was down over 20%. No other release has seen a subsequent decline of nearly that much.
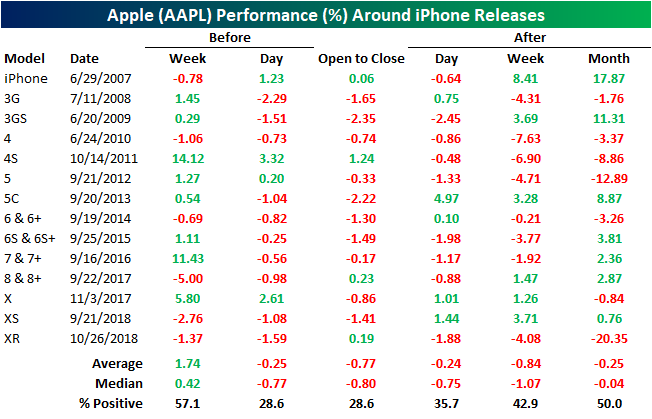
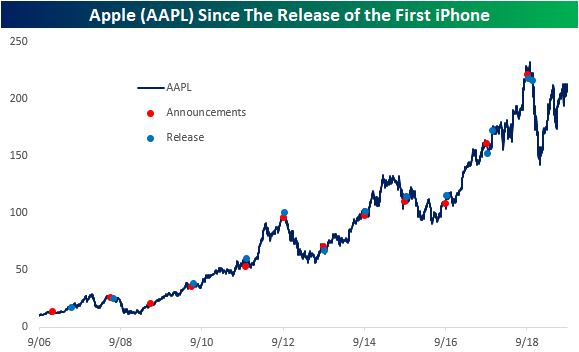
As shown in the chart below, since the company unveiled the very first iPhone back in 2007, iPhone announcements and releases for the most part, do not mark any major tops or bottoms for the stock. Only the aforementioned release of the iPhone XR and the iPhone 5 in 2012 resulted in a short to medium-term peak for the stock. Over the long run, even these poorly received products did little to completely break the stock’s long term uptrend that has been in place for many years now. Since the announcement of the first iPhone, AAPL has risen over 1500% which is more than ten times the gain in the S&P 500 over that same span. Start a two-week free trial to Bespoke Institutional to access our interactive Security Analysis tool and much more.
A Storm Beneath the Surface
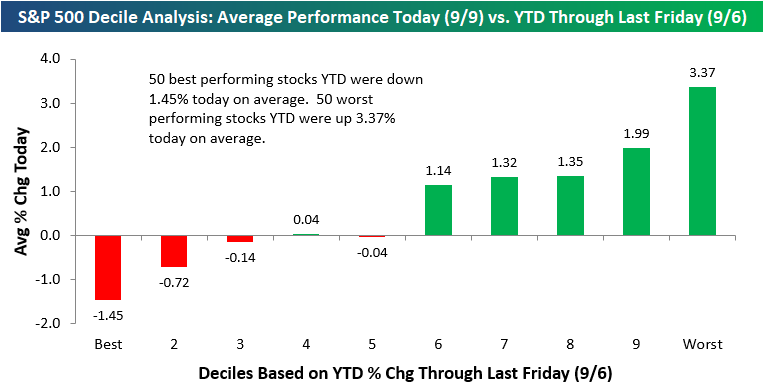
The S&P 500 traded almost exactly flat today (-0.01%), but we saw huge moves underneath the surface. Below we have broken up the S&P 500 into deciles (10 groups of 50 stocks each) based on YTD performance through last Friday. We then calculate the average performance today of the stocks in each decile.
As shown below, the 50 stocks in the S&P that were up the most YTD coming into today were down an average of 1.45% today. Decile two (the next 50 best performers YTD) saw an average decline of 0.72%, while deciles three through five were roughly flat. Once you get to deciles six through ten, though, the average performance today was greater than +1% for each decile! The 50 worst performing S&P 500 stocks of 2019 coming into today were up an average of 3.37% today.
Basically the bottom half of the S&P in terms of YTD performance exploded higher today, while the top half lagged badly. What’s the reason for the big divergence in performance? Find out by reading our Chart of the Day. You can read it with a two-week free trial to Bespoke Premium.
Nat. Gas (UNG) Heating Up
As we noted in Friday’s Bespoke Report, the US Natural Gas Fund (UNG) was the top-performing ETF in our asset class performance matrix last week with a 9.16% gain. That move higher is continuing today as UNG has rallied another 3.5% to its highest level since May after breaking above resistance (which also was previous support) around $21. All of this comes after the ETF made an all-time low on August 5th when it opened at $17.75. Since that open, UNG has surged 25.86%.
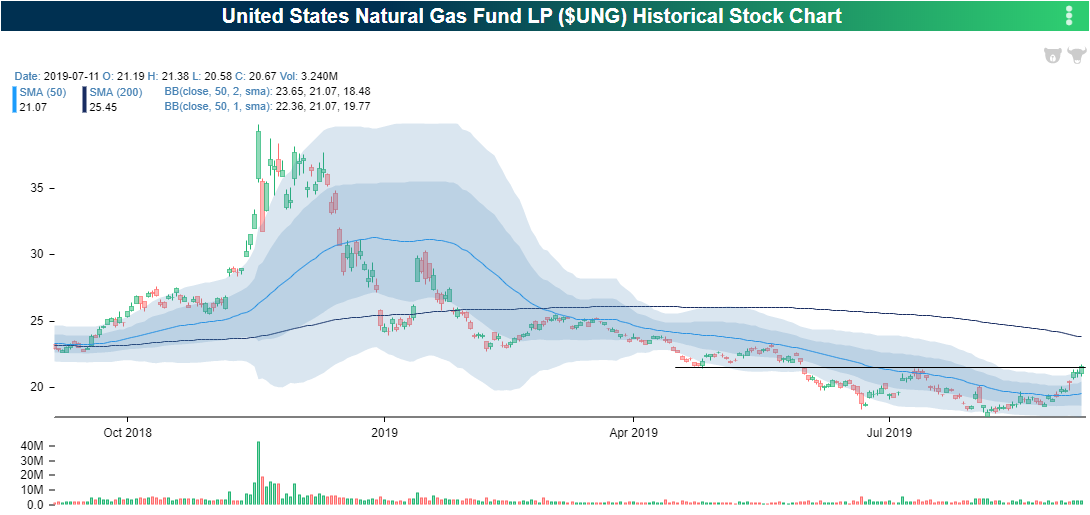
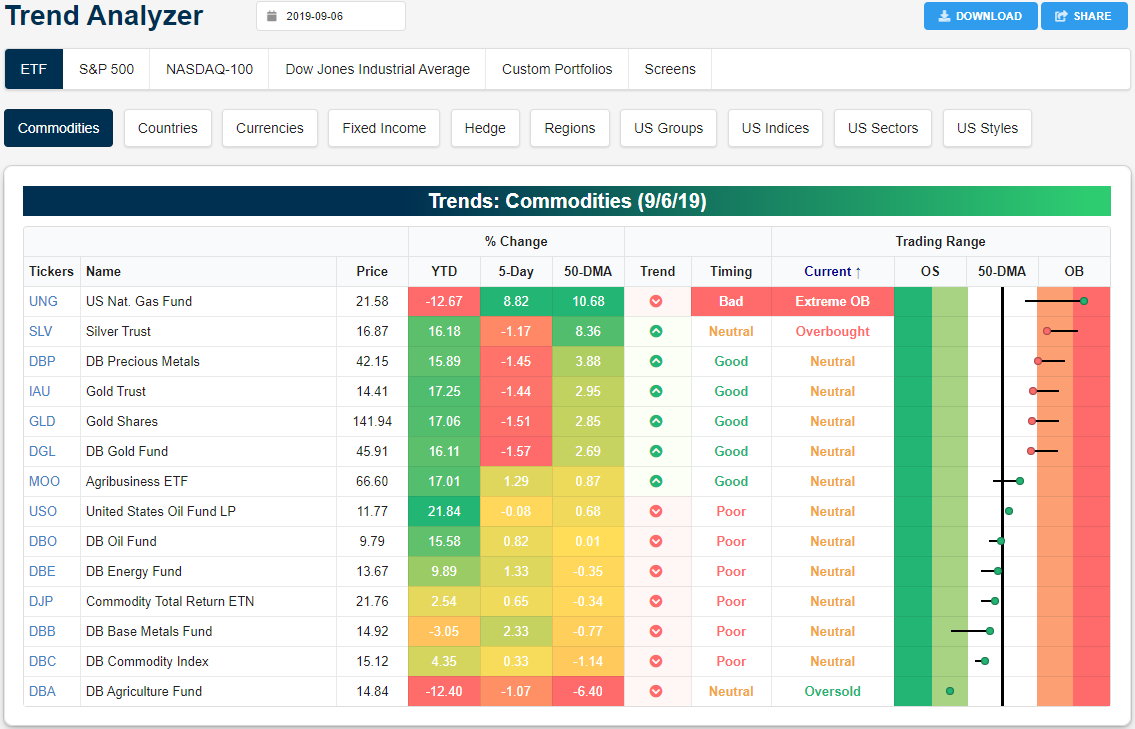
Following a volatile spike at the end of last year, UNG collapsed below its 50-DMA. Up until the end of August, this acted as stiff resistance for the commodity, but this most recent leg higher has sent UNG surging through these levels. UNG now sits over 10% above its 50-DMA and is moving deeper and deeper into extremely overbought territory (over 2 standard deviations above its 50-day). As precious metals have begun to experience a bit of mean reversion, UNG has become by far the most overbought commodity ETF in our Trend Analyzer. Start a two-week free trial to Bespoke Institutional to access our interactive economic indicators monitor and much more.
Trend Analyzer – 9/9/19 – Neutral and Sideways
Despite positive price action last week with most major index ETFs (other than small caps) up over 1.5% from five days ago, the longer-term trends have worsened in our Trend Analyzer. Over the past few months, fewer and fewer major index ETFs have held onto their long term uptrends. Headed into Friday, ETFs tracking the S&P 500 (SPY, VOO, IVV) had been the only ones left in uptrends, but today they have joined their peers and are trending sideways. Fortunately, only the Micro-Caps ETF (IWC) is in a downtrend. More near term, each of the major index ETFs has experienced mean reversion over the past couple of weeks as each one has now exited oversold territory. Large caps have also retaken their 50-DMAs and are now approaching overbought territory in the process.
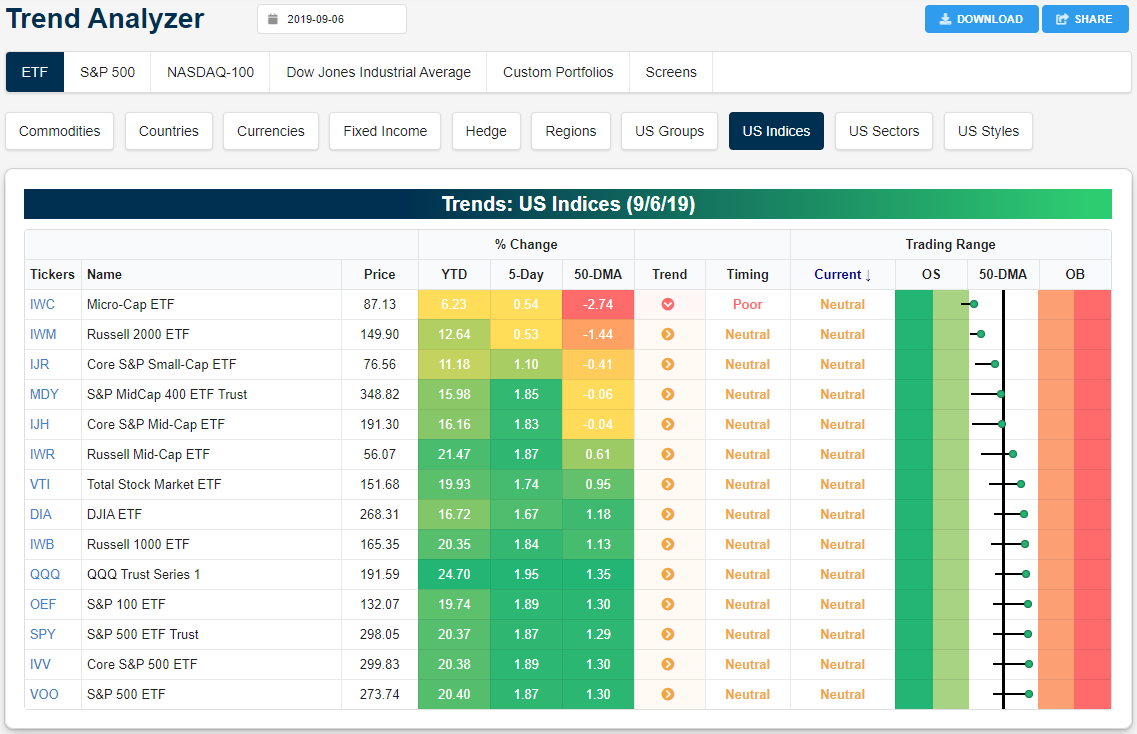
Last week, stocks finally managed to break out of the range that they had been in since the first days of August. Large caps like the Dow (DIA) saw the most distinct breakout above this range in addition to a move back above their 50-DMAs. On the other hand, although mid-caps like the Core S&P Mid-Cap ETF (IJH) and the S&P MidCap400 ETF (MDY) also managed to breakout above the short term downtrends that were established in August and their 50-DMAs, they did not hold above their 50-DMAs on Friday. The small-cap Russell 2000 (IWM) looks more or less the same, but rather than the 50-DMA, IWM failed to hold above its longer term 200-DMA. Start a two-week free trial to Bespoke Institutional to access our interactive Trend Analyzer, Chart Scanner, and much more.
