The Closer – Fed Independence, Confidence, Credit Cards – 8/26/25
Log-in here if you’re a member with access to the Closer.
Looking for deeper insight into markets? In tonight’s Closer sent to Bespoke Institutional clients, we start out with further commentary on the situation surrounding the possible firing of Fed Governor Cook and some implications of a less independent Fed (pages 1 and 2). We then pivot over to the consumer confidence readings followed by the latest Fed manufacturing (page 3) and services data (page 4 and 5). We finish with a look at credit card delinquencies and the performance of related stocks (pages 6 and 7).
See today’s full post-market Closer and everything else Bespoke publishes by starting a 14-day trial to Bespoke Institutional today!
Supply, Not Sun, Powers Housing Gains
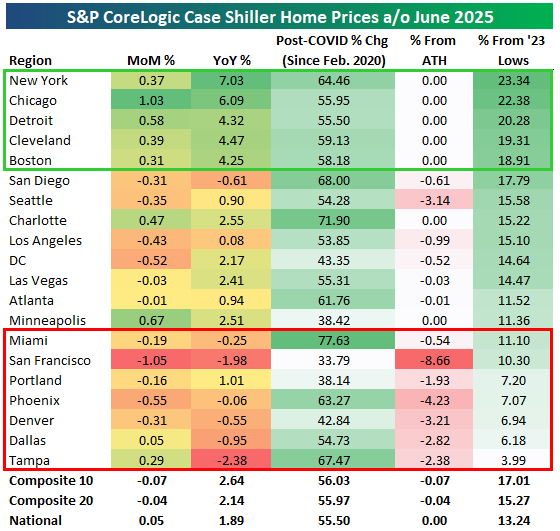
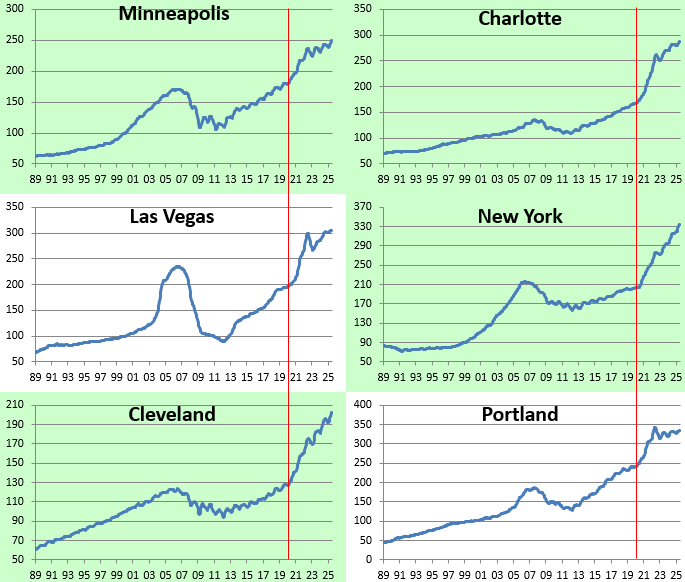
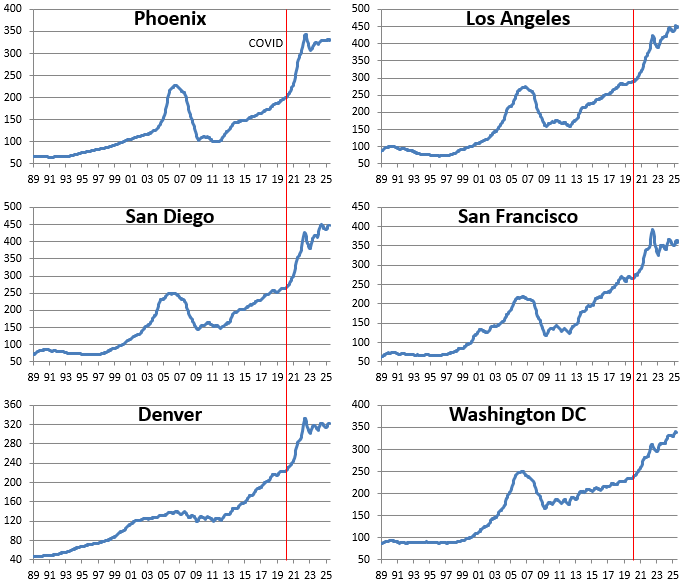
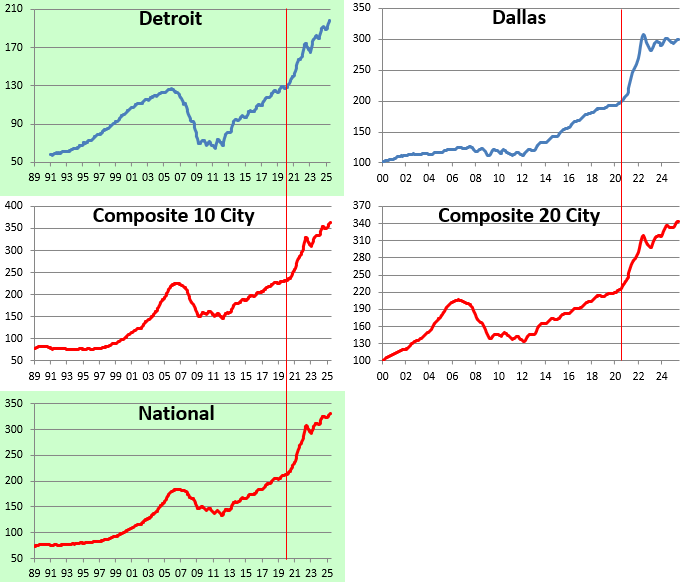
Below is an updated look at the most recent release of S&P/CoreLogic Case Shiller Home Price indices. As of June 2025, the data shows national home prices up 1.89% year-over-year and 55.5% since February 2020, with the Composite 20 index just 0.15% below all-time highs. On a monthly basis, price changes were mixed across regions, with Chicago (+1.03%), Detroit (+0.58%), and Minneapolis (+0.67%) posting the strongest gains, while San Francisco (-1.05%), Dallas (-0.92%), and Seattle (-0.35%) recorded declines. Year-over-year growth is most pronounced in New York (+7.03%), Chicago (+6.09%), and Detroit (+4.32%), while markets like San Francisco (-1.98%), Tampa (-2.38%), and San Diego (-0.61%) are down versus last year.
Since the onset of COVID, most markets remain significantly higher, led by Miami (+77.6%), Charlotte (+71.9%), and Tampa (+67.5%). By contrast, San Francisco (+33.8%), Minneapolis (+38.4%), and Portland (+38.1%) have seen the smallest increases. Relative to all-time highs, only a handful of markets are meaningfully below peak levels, including San Francisco (-8.7%), Portland (-4.2%), and Phoenix (-3.7%), while many regions like New York, Chicago, Detroit, and Boston are right at record highs. From their 2023 lows, markets like New York (+23.3%), Chicago (+22.4%), and Detroit (+20.3%) have rebounded sharply, while cities such as Tampa (+3.9%) and Denver (+6.9%) have recovered more modestly.
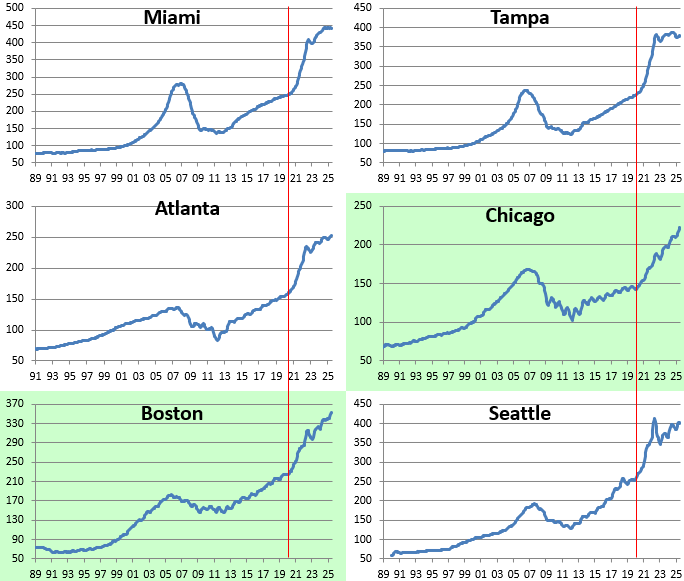
Below are price charts for each of the major cities tracked by Case Shiller going back to the end of 1989. Cities highlighted in green hit all-time highs in June. In looking at the charts, you’ll notice sideways action recently in previously hot markets in the sunbelt and out west, while supply-constrained areas like New York, Chicago, Boston, Cleveland, and Detroit continue to see home prices push higher and higher.

Bespoke’s Morning Lineup – 8/26/25 – Drama at the Federal Reserve
See what’s driving market performance around the world in today’s Morning Lineup. Bespoke’s Morning Lineup is the best way to start your trading day. Read it now by starting a two-week trial to Bespoke Premium. CLICK HERE to learn more and start your trial.
“If you can go through life without experiencing pain you probably haven’t been born yet.” – Neil Simon

Below is a snippet of commentary from today’s Morning Lineup. Start a two-week trial to Bespoke Premium to view the full report.
If last week’s rally to close out the week felt like a Friday, this morning’s futures feel a bit like a Monday as futures are modestly lower in what feels like a sluggish market. The big headline this morning is probably a story from Friday where the President threatened tariffs on furniture makers who import goods from overseas. Stocks like Wayfair and RG are trading sharply lower in response,
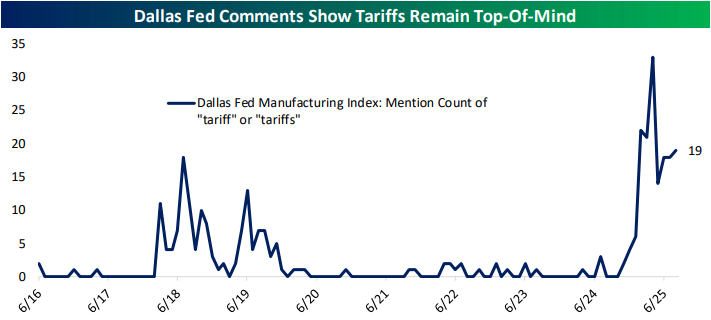
The only economic reports on the calendar are New Home Sales at 10 AM and the Dallas Fed report at 10:30. Earnings season is mostly over, except for the elephant in the room – Nvidia (NVDA)- which reports Wednesday after the close.
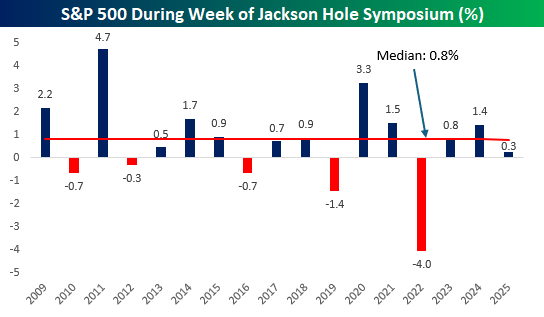
Friday’s gain wasn’t the first 1%+ rally this summer, but it was the largest gain for the S&P 500 since the day after Memorial Day. Even with that gain, the S&P 500 only managed to squeak out a gain of 0.3% for the week, owing to the five-day losing streak that the market was riding heading into Friday. Last week, we showed the chart of the S&P 500’s performance during the week of the Fed’s Jackson Hole symposium, and below we have updated it to include last week’s 0.3% gain. While it was a weaker-than-normal Jackson Hole week, last week was the third straight year of positive returns and the fifth in the last six.
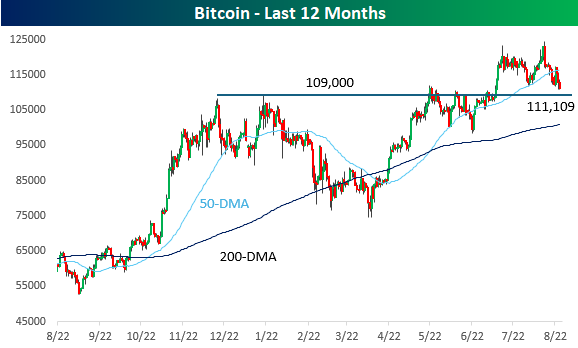
While most investors were checked out for the weekend, crypto markets had some major moves. Bitcoin, the world’s largest cryptocurrency, gave up all of Friday’s gains and fell to its lowest level since early July. The catalyst for the decline was a massive sale of 24,000 coins worth over $167 billion from a Bitcoin whale on Saturday. As shown in the chart below, for now, Bitcoin remains above support at the $109,000 level, but a break of that support within just two weeks of hitting a record high wouldn’t be a positive technical signal.
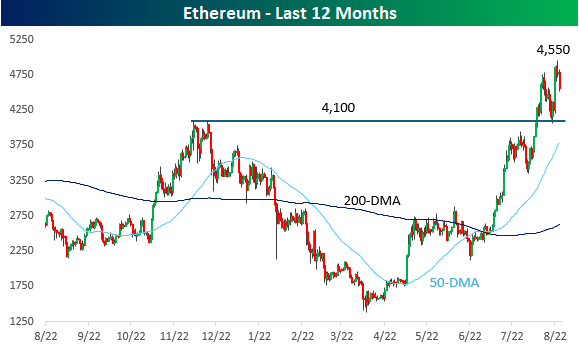
While Bitcoin investors may have been wishing that it didn’t trade on weekends after Saturday’s decline, Ethereum continues to gain attention and share in the crypto space. Around the time that Bitcoin was hitting record highs a couple of weeks ago, Ethereum was pulling back and testing support from its highs last fall. That support held, and over the weekend, Bitcoin broke out to new 52-week and record highs.
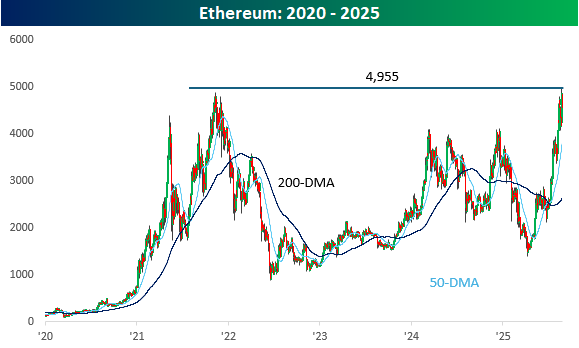
Looking at Ethereum from a 5-year time frame, its parabolic run over the last several weeks rocketed right through prior resistance in the low 4,000 range, right up to the highs from late 2021 and just under 5,000.
Exploring Trends Across Asset Classes, Mega-Caps, and Banks
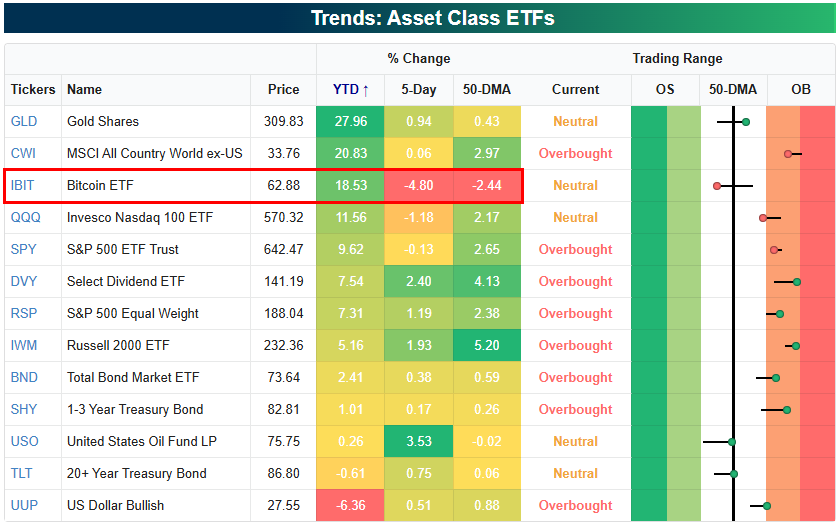
Equities have stalled out in the last half of August as a buyer’s strike ahead of the seasonally weak month of September takes hold. Below is a look at where equity ETFs and other asset-class ETFs stand within their trading ranges using our Trend Analyzer tool. Notably, gold (GLD) is now solidly in the lead in terms of year-to-date percentage change after Bitcoin (IBIT) has fallen off dramatically in the last week. Of the various asset class ETFs shown, Bitcoin (IBIT) is easily down the most week-over-week with a drop of 4.8%. On the flip side, oil (USO) is up the most with a gain of 3.5%.
Looking at the mega-caps, the best performer over the last week has been Tesla (TSLA), which remains the worst performer of the group on a year-to-date basis. Alphabet (GOOGL) is the only other mega-cap in the green over the last week, while the rest of them are down 1%+. So far, Microsoft (MSFT) is the only one that has moved back below its 50-day moving average.

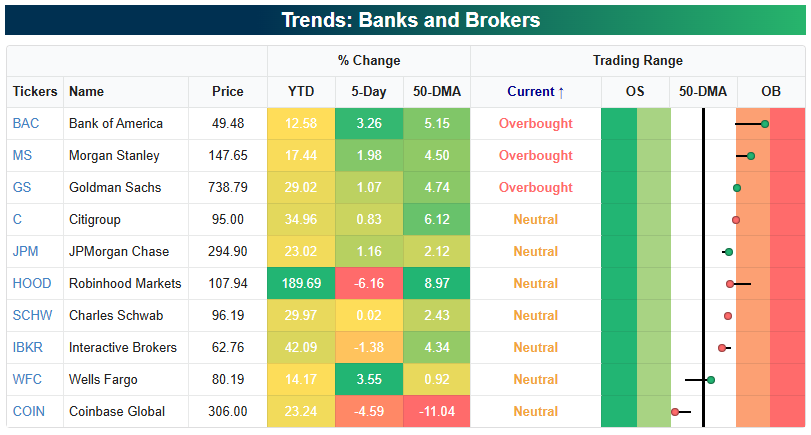
One other area of the market worth looking at is the banks and brokerage firms. While Bank of America (BAC) is up the least year-to-date of any of the stocks shown, it’s up the most over the last week with a gain of 3.3%. BAC is also now the most overbought stock of the bunch as it trades nearly two standard deviations above its 50-day moving average. On the flipside, Coinbase’s (COIN) 4.6% drop over the last week leaves it as the only name in the group that’s below its 50-DMA.
As a reminder, you can monitor trends across ETFs, sectors, groups, and indices using our Trend Analyzer tool, available to Bespoke members.
The Closer – Funding, New Homes, AI Dynamics – 8/25/25
Log-in here if you’re a member with access to the Closer.
Looking for deeper insight into markets? In tonight’s Closer sent to Bespoke Institutional clients, we start out with commentary on funding markets (page 1) followed by a look into the latest manufacturing data out of the Dallas Fed (page 2). We then shift over to the update on new home sales (page 3). Afterward, we review the differing performance in AI names (page 4) and close out with a rundown of the latest positioning data (page 5).
See today’s full post-market Closer and everything else Bespoke publishes by starting a 14-day trial to Bespoke Institutional today!
If Alphabet “Missed the AI Boat”, What Does That Mean for Microsoft?
Since the launch of ChatGPT, the consensus has been that Microsoft (MSFT) has been one of the AI winners while Alphabet (GOOGL) missed the boat. Some of the criticism towards GOOGL was earned as the company was late in launching a consumer AI product/tool, and then had a clumsy launch once it did. What many investors overlooked, though, was the fact that GOOGL branded itself an ‘AI first’ company way back in April 2016. Now, just because a company calls itself AI-first doesn’t mean it is. After all, anyone can say they’re an NFL-caliber quarterback, but only three dozen or so people are at any one time. In GOOGL’s case, though, missing the boat was hardly an accurate description of the situation.
Even now, nearly three years after the launch of ChatGPT, most investors view MSFT as the winner relative to GOOGL, if for no other reason than its investments in OpenAI that have given it a 49% share of the company’s future profits. Given the overall sentiment, how much do you think MSFT has outperformed GOOGL by since the launch of ChatGPT? The answer is that it hasn’t. As shown in the chart below, while MSFT has nearly doubled (+97.9%), GOOGL is now up nearly ten percentage points more with a gain of 107.6% and has just eclipsed MSFT in the back-and-forth race for outperformance.
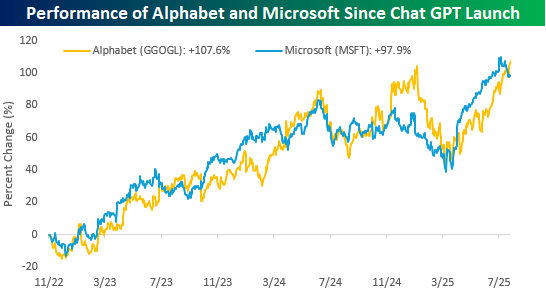
The chart below shows the performance spread between the two stocks since ChatGPT’s launch. For the most part, GOOGL has been moderately underperforming MSFT, but it hasn’t been consistent. Overall, the average margin of underperformance has been less than 3 percentage points, so it has hardly been a runaway train in favor of MSFT. Even more, the widest the performance spread has grown between the two stocks at any point since ChatGPT’s launch was 43 percentage points in GOOGL’s favor. For MSFT, there hasn’t been a point since ChatGPT’s launch where it outperformed GOOGL by more than 31 percentage points. If GOOGL missed it, what exactly was the boat it missed?

Bespoke’s Morning Lineup – 8/25/25 – While You Were Out
See what’s driving market performance around the world in today’s Morning Lineup. Bespoke’s Morning Lineup is the best way to start your trading day. Read it now by starting a two-week trial to Bespoke Premium. CLICK HERE to learn more and start your trial.
“Some people without brains do an awful lot of talking, don’t you think?” – The Wizard of Oz
Below is a snippet of commentary from today’s Morning Lineup. Start a two-week trial to Bespoke Premium to view the full report.
If last week’s rally to close out the week felt like a Friday, this morning’s futures feel a bit like a Monday as futures are modestly lower in what feels like a sluggish market. The big headline this morning is probably a story from Friday where the President threatened tariffs on furniture makers who import goods from overseas. Stocks like Wayfair and RG are trading sharply lower in response,
The only economic reports on the calendar are New Home Sales at 10 AM and the Dallas Fed report at 10:30. Earnings season is mostly over, except for the elephant in the room – Nvidia (NVDA)- which reports Wednesday after the close.
Friday’s gain wasn’t the first 1%+ rally this summer, but it was the largest gain for the S&P 500 since the day after Memorial Day. Even with that gain, the S&P 500 only managed to squeak out a gain of 0.3% for the week, owing to the five-day losing streak that the market was riding heading into Friday. Last week, we showed the chart of the S&P 500’s performance during the week of the Fed’s Jackson Hole symposium, and below we have updated it to include last week’s 0.3% gain. While it was a weaker-than-normal Jackson Hole week, last week was the third straight year of positive returns and the fifth in the last six.
While most investors were checked out for the weekend, crypto markets had some major moves. Bitcoin, the world’s largest cryptocurrency, gave up all of Friday’s gains and fell to its lowest level since early July. The catalyst for the decline was a massive sale of 24,000 coins worth over $167 billion from a Bitcoin whale on Saturday. As shown in the chart below, for now, Bitcoin remains above support at the $109,000 level, but a break of that support within just two weeks of hitting a record high wouldn’t be a positive technical signal.
While Bitcoin investors may have been wishing that it didn’t trade on weekends after Saturday’s decline, Ethereum continues to gain attention and share in the crypto space. Around the time that Bitcoin was hitting record highs a couple of weeks ago, Ethereum was pulling back and testing support from its highs last fall. That support held, and over the weekend, Bitcoin broke out to new 52-week and record highs.
Looking at Ethereum from a 5-year time frame, its parabolic run over the last several weeks rocketed right through prior resistance in the low 4,000 range, right up to the highs from late 2021 and just under 5,000.
Brunch Reads – 8/24/25
Welcome to Bespoke Brunch Reads — a linkfest of some of our favorite articles over the past week. The links are mostly market-related, but there are some other interesting subjects covered as well. We hope you enjoy the food for thought as a supplement to the research we provide you during the week.
The Walls Kept Tumbling Down: On the morning of August 24, 79 CE, life in the Roman towns of Pompeii and Herculaneum began like any other summer day. Merchants opened their shops, farmers tended their fields, and families prepared meals. But by midday, Mount Vesuvius, long thought to be just another mountain, erupted. A towering column of ash, pumice, and noxious gases shot twelve miles upward, more than twice the height of Mount Everest, darkening the daylight and raining fragments onto the towns below.
In Pompeii, streets quickly filled with debris as terrified citizens tried to flee. Roofs collapsed under the weight of falling pumice, and those who stayed behind struggled to breathe in the thickening air. Across the bay in Herculaneum, many believed they were safer, but hours later, superheated pyroclastic surges swept down the volcano’s flanks at speeds up to 70 miles per hour. The waves of ash, gas, and molten rock buried the town instantly, sealing its people in place.
By dawn the next day, both cities lay under about 16 feet of volcanic material. Pompeii was smothered in ash, and thousands died, frozen in plaster-like casts of their final moments. What had been bustling Roman communities were erased in less than 24 hours, only to be rediscovered nearly 1,700 years later. It is one of the most visited sites in the world today, as the ruins were preserved exactly as the people and buildings had been left.

AI & Technology
Brace for a crash before the golden age of AI (Financial Times)
Big Tech is pouring unprecedented sums ($750 billion this year and next from just four companies) into data centers to fuel AI, yet history suggests these spending frenzies often end in crashes before real gains arrive. Scholar Carlota Perez frames AI as part of a familiar cycle: a manic installation phase marked by bubbles and upheaval, which eventually lays the groundwork for broader prosperity. What’s different now is the software-driven scale of AI, the global reach of tools like ChatGPT, and the open question of whether today’s giants can capture the long-term rewards, or if instability, debt, and political fractures derail the path to a golden age. [Link]
Continue reading our weekly Brunch Reads linkfest by logging in if you’re already a member or signing up for a trial to one of our two membership levels shown below! You can cancel at any time.

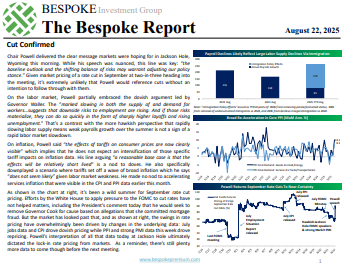
The Bespoke Report – 8/22/25 – Cut Confirmed
To read our weekly Bespoke Report newsletter and access everything else Bespoke’s research platform offers, start a two-week trial to Bespoke Premium. This week, Fed Chair Powell signaled a cut is almost a given at the next FOMC meeting. His embrace of dovish arguments on both the labor markets and inflation drove a massive rally in stocks to end the week, both in the US and Europe. Other markets are also performing well with investment grade corporate bonds trading at a record low risk premium this week. We also discuss earnings, AI stocks, custom baskets of stocks that tease out market narratives, and more in this week’s report. Give it a read!

A Whipsaw Week
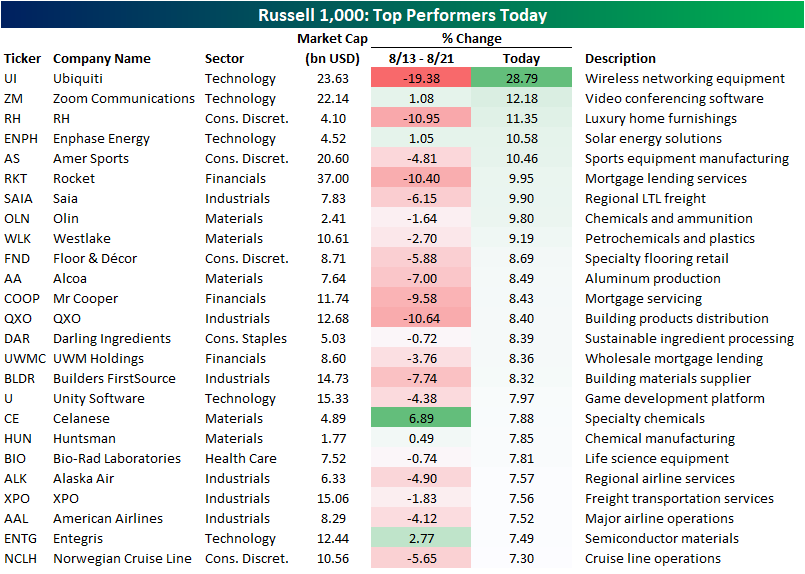
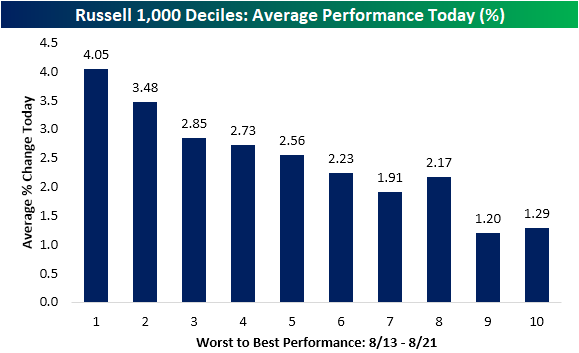
The first part of this week was driven by rotation out of the year’s winners into the year’s losers. Fast forward to Friday with Fed Chair Powell hinting at rate cuts in September, everything reversed. As shown below, breaking the Russell 1,000 into deciles (ten equal sized groups of 100 index members), today’s best performers were those that had been the worst performers from August 13th through yesterday’s close. The 100 stocks down the most from 8/13-8/21 gained over 4% today on average. Conversely, the deciles of the best performers from 8/13-8/21 still averaged gains today, but they were much weaker at just over 1%.
In the table below, we show the 25 best performing stocks in the Russell 1,000 today. As shown, wireless networking equipment maker Ubiquiti (UI) is experiencing the single largest gain of any stock in the index, up 28.8%. The stock’s surge comes after reporting a top and bottom line beat this morning with the announcement of a stock buyback and cash dividend. Earnings aside, the stock was a big decliner in the days prior, having fallen almost 20% since August 13. The next largest gain was another earnings story as Zoom Communications (ZM) rose 12.18% on its own top and bottom line beat.
On average, the stocks up the most today were down 4% from 8/13-8/21, with names like RH, Rocket (RKT), and QXO down 10%+ during this period. As Powell opened the door for another cut, many of the biggest gainers today were housing related or cyclical in nature. RH (RH) is a high-end home furnishing business whereas Rocket (RKT), Mr Cooper (COOP, and UWM (UWMC) represent mortgage lending. Homebuilder-adjacent names like Builders FirstSource (BLDR) and Floor & Decor (FND) likewise posted high-single digit gains today. Out of the transportation industry, travel and leisure names like Alaska Air (AIR) and Norwegian Cruises (NCLH) made the list in addition to logistics and goods transporters such as XPO (XPO).