Brunch Reads – 11/23/25
Welcome to Bespoke Brunch Reads — a linkfest of some of our favorite articles over the past week. The links are mostly market-related, but there are some other interesting subjects covered as well. We hope you enjoy the food for thought as a supplement to the research we provide you during the week.
A Hail Mary on the Hurricanes: On November 23, 1984, Doug Flutie etched his name into college football history books with a single throw. Boston College was locked in a Thanksgiving-week shootout against the Miami Hurricanes, a national powerhouse. BC trailed 45–41 in the final moments of the fourth quarter, sitting 48 yards from the end zone with time for one last snap. Everyone in the Orange Bowl expected a desperation heave.
Flutie took the snap, scrambled back against a strong Miami rush, and uncorked a Hail Mary that traveled more than 60 yards in the air, dropping just behind two defenders into the waiting arms of wide receiver Gerard Phelan, Flutie’s roommate and closest friend on the team. Touchdown. Ballgame. Instant legend.
It changed Flutie’s life and solidified his Heisman trophy bid. It also gave Boston College one of the most iconic moments in its sports history. For a program without many national headlines, the Miracle in Miami became a forever highlight.
Click the image below to watch the clip on YouTube.

AI & Technology
He’s Been Right About AI for 40 Years. Now He Thinks Everyone Is Wrong. (WSJ)
Yann LeCun, one of AI’s most influential researchers, is drifting away from Meta as the company doubles down on large language models he thinks are a dead end. He’s been open about his belief that future AI will come from “world models” that learn through perception, not text prediction, and he’s been laying the groundwork for a startup built around that idea. Inside Meta, his old research group has lost influence while newer teams chase rapid, product-focused breakthroughs. [Link]
Continue reading our weekly Brunch Reads linkfest by logging in if you’re already a member or signing up for a trial to one of our two membership levels shown below! You can cancel at any time.

The Bespoke Report – Marty Zweig’s Rules – 11/21/25
To read our weekly Bespoke Report newsletter and access everything else Bespoke’s research platform offers, start a two-week trial to Bespoke Premium.
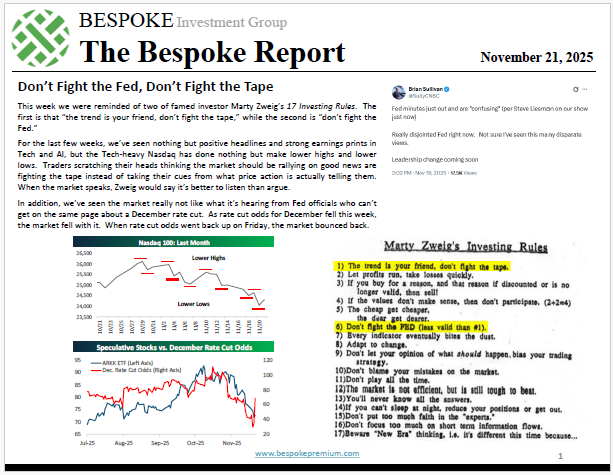
Two of famous investor Marty Zweig’s Investing Rules are “don’t fight the tape” and “don’t fight the Fed.” Both of these rules came into focus this week, which we cover in detail in this week’s Bespoke Report newsletter. Give the full report a read by starting a trial here.

Tracking Data Center Debt
Bespoke applies a cross-asset perspective to understanding financial markets and the economy. Below is one example published last week looking at the issuance of data center-backed securitizations and how they differ from the mortgage securitizations that drove the subprime meltdown and the Global Financial Crisis.
One common way that data centers borrow is via the asset-backed securities market. 26 of these deals have priced this year, but they’re relatively small in the grand scheme of things: just $17.5bn of face value. That’s two orders of magnitude smaller than investment grade corporate bond issuance. It’s also noteworthy that they’re relatively low leverage, with an LTV only slightly above 50 on a weighted average basis. The combination of ample current cashflows and modest leverage means this debt can absorb a lot of decline in data center demand without leading to defaults. To be sure, risk premiums aren’t huge, but these deals all priced at spreads significantly wider than, for instance, where Oracle (ORCL) spreads sit. In other words, this securitization is much smaller and priced more conservatively than subprime MBS ever were.
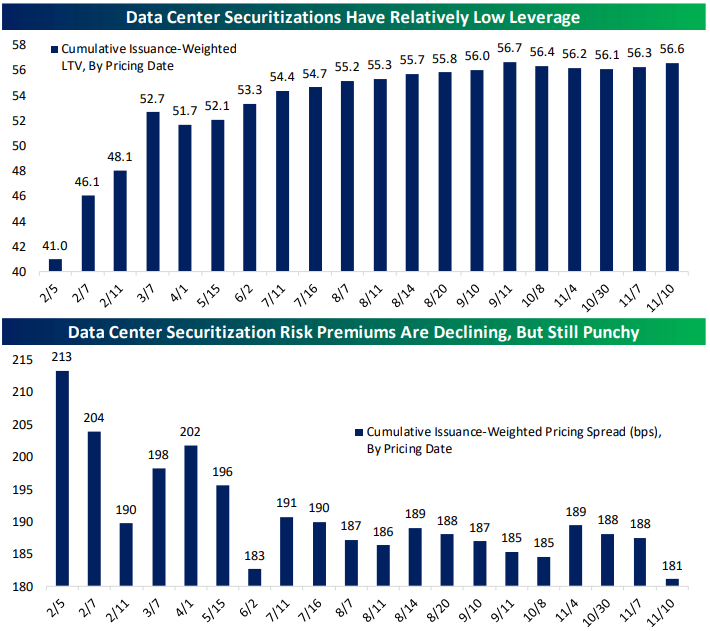
To be clear, there are absolutely credit risks swirling in the data center and AI infrastructure universe. The extreme complexity of the Beignet transaction is a good example. Meta (META) is forming a joint venture with funds controlled by Blue Owl (OWL) that also receive debt funding from PIMCO funds (via the RPLDCI 6.581 05/30/49 bond which is the single largest-ever corporate bond issue). That bond amortizes over time based on cash flows from META itself, which serves as a development partner, cross-guarantor, and tenant of the completed data center. That allows what amounts to debt financing (with some de-risking via the JV with OWL funds) without an impact on the META parent credit rating. These sorts of complex transactions aren’t necessarily a sign of bad things to come, but they do indicate risk.
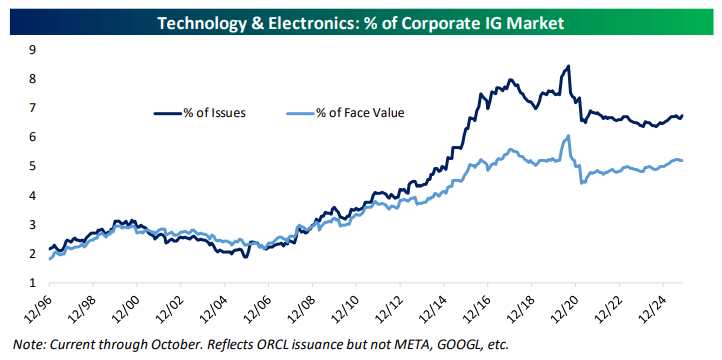
Looking at the IG bond market, we just haven’t seen the sort of sustained debt binge that is the hallmark of historical, financial system-threatening blow-ups like the subprime mortgage debacle was. That’s evidenced by relatively low Tech share of IG credit outstanding, or the relatively modest size of data centers in securitized transactions. If the AI trade does melt away and leave an investment bust, a debt crisis looks relatively unlikely without years more extreme investment rates funded by debt.

Bespoke’s Morning Lineup – 11/21/25 – Looking to Regroup
See what’s driving market performance around the world in today’s Morning Lineup. Bespoke’s Morning Lineup is the best way to start your trading day. Read it now by starting a two-week trial to Bespoke Premium. CLICK HERE to learn more and start your trial.
“To expect the unexpected shows a thoroughly modern intellect.” – Oscar Wilde

Below is a snippet of commentary from today’s Morning Lineup. Start a two-week trial to Bespoke Premium to view the full report.
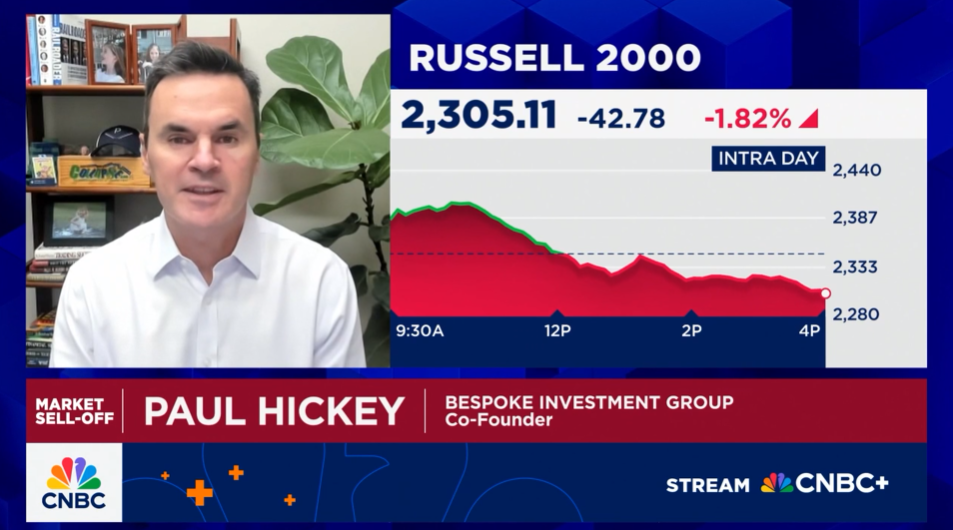
To view yesterday’s CNBC segment discussing yesterday’s sell-off and Nasdaq 5% pullbacks, in general, click on the image below.
After trading lower overnight, equity futures are higher across the board this morning following comments from New York Fed President John Williams, who says the Fed has room to lower rates in the short-term as weakness in the labor market poses a bigger risk than inflation. In response, S&P 500 futures are up 0.5% while Nasdaq futures are up slightly less. For both indices, the rebound is nowhere near enough to make up for yesterday’s declines, let alone getting us anywhere near the intraday highs from less than 24 hours ago.
Crude oil and 10-year yields are both lower, gold is basically flat, and crypto is seeing steep losses with Bitcoin and Ether both down about 4% while less ‘blue-chip’ coins in the space are down even more.
After yesterday’s weakness, it should come as no surprise that Asian stocks were creamed overnight, putting them all deep in the red for the week. European stocks are also lower, but not by the same degree, as the STOXX 600 is down 0.8%, but all major indices on the continent are on pace for weekly losses of at least 2%.
What started out yesterday as a Dr. Jekyll moment yesterday quickly turned into a Mr. Hyde event as the S&P 500, led by tech, turned a gain of nearly 2% into a decline of over 1.5%. Bulls started off the day strutting their stuff, got a little nervous as they headed out to lunch, and then came back ready to throw up.
Within the S&P 500, there were some major reversals. 13 stocks in the index closed more than 10% lower than their intraday high, which is nearly unheard of for large-cap stocks unless there’s a stock-specific event causing the move. Looking at the list of the biggest intraday reversals, not only were eight of them from the Technology sector, but most of the ones that aren’t were still AI-adjacent stocks.
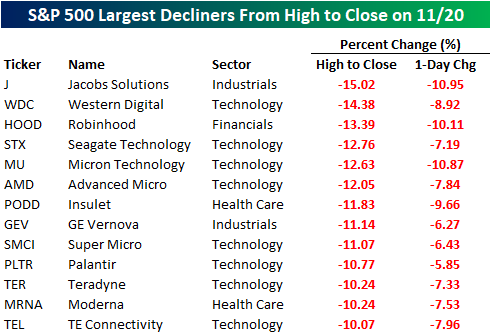
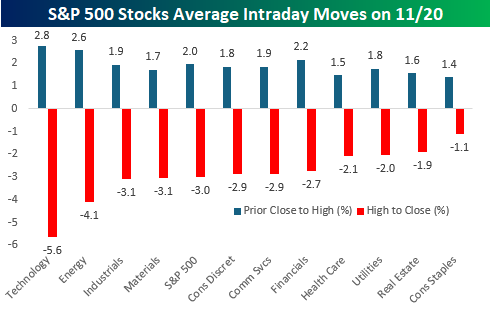
While tech led the reversal, it wasn’t solely about Tech. Within the S&P 500, 420 stocks traded down from the open to close, and the average stock in the S&P 500 finished the day down more than 3% from its intraday high. The chart below shows the average change of individual stocks yesterday from Wednesday’s close through the intraday high and then the intraday high to the close.
Tech stocks rallied the most initially, with an average gain of 2.8% and then reversed an average of 5.6% from the open to close. Besides Technology, though, the only two sectors where the average decline from the intraday high to the close was less than 2% were Consumer Staples (-1.1%) and Real Estate (-1.9%). In three sectors besides Technology (Energy, Industrials, and Materials), the average decline was more than 3%. So, again, Tech led the way but it had plenty of company.
The Closer – Reversals and Rejections – 11/20/25
Log-in here if you’re a member with access to the Closer.
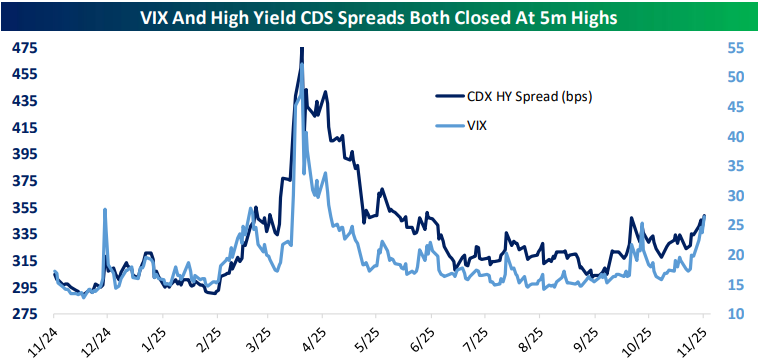
Looking for deeper insight into markets? In tonight’s Closer sent to Bespoke Institutional clients, we start with a review of the latest earnings and rise in credit spreads and the VIX (page 1). We then review the huge intraday reversals in the S&P 500 (page 2). We then finish by providing a look into the latest employment statistics (pages 3 – 5).
See today’s full post-market Closer and everything else Bespoke publishes by starting a 14-day trial to Bespoke Institutional today!
The Triple Play Report — 11/20/25
An earnings triple play is a stock that reports earnings and manages to 1) beat analyst EPS estimates, 2) beat analyst sales estimates, and 3) raise forward guidance. You can read more about “triple plays” at Investopedia.com where they’ve given Bespoke credit for popularizing the term. We like triple plays as an indication that a company’s business is firing on all cylinders, with better-than-expected results and an improving outlook. A triple play is indicative of positive “fundamental momentum” instead of pure fundamentals, and there are always plenty of names with both high and low valuations on our quarterly list.
Bespoke’s Triple Play Report highlights companies that have recently reported earnings triple plays, and it features commentary from management on triple-play conference calls, company descriptions and analysis, and price charts. Bespoke’s Triple Play Report is available at the Bespoke Institutional level only. You can sign up for Bespoke Institutional now and receive a 14-day trial to read this week’s Triple Play Report, which features 23 new stocks. To sign up, choose either the monthly or annual checkout link below:
Bespoke Institutional – Monthly Payment Plan
Bespoke Institutional – Annual Payment Plan
Lemonade (LMND) is an example of a company that recently reported an earnings triple play before the opening bell on 11/5. In reaction to the strong earnings results, LMND shares surged 34.2% that day. After that move, the stock hit its highest level since the summer of 2021. The stock has had a great year thus far, up 93.4% YTD.
Here’s how AI describes the company: Lemonade (LMND) is a fully digital, AI-driven insurance company that sells renters, homeowners, pet, and car policies directly through its app and website rather than through agents or legacy systems. The company’s entire model is built around automation: AI guides the majority of its marketing spend, prices policies in real time, detects risk patterns, and handles most customer support and claims without human intervention. This approach allows Lemonade to operate with a much smaller workforce than traditional insurers while providing instant quotes and often instant claim payments. Because its technology platform collects detailed customer and behavioral data, Lemonade continually updates pricing, underwriting, and fraud models, and it uses reinsurance partners to manage volatility as it grows. The long-term strategy is to use AI and automation to offer lower prices, expand into more insurance categories, and eventually compete at scale with the largest consumer insurers in the market.
Lemonade delivered one of its strongest quarters to date, with a total book of insurance that reached $1.16 billion, up 30% from last year, and revenue jumped 42% to $195 million. That faster revenue growth came partly from keeping a larger share of premiums in-house instead of passing them to reinsurance partners, which means Lemonade now earns more money on each customer it already serves. Gross profit doubled to $80 million thanks to fewer claims relative to premiums and continued efficiency gains from automation. The company added more than 176,000 customers, and car insurance remained a major growth engine, rising about 40% with over half of new car policies coming from existing Lemonade users who cost little to acquire and tend to be more profitable. Europe performed especially well, growing about 170% as Lemonade expanded renters and home insurance and adjusted prices more quickly than it could in the US. The company also highlighted meaningful cost improvements from AI, including a drop in claims-handling expense to 7%, even though overall claim volume has increased.
Diving more in-depth into car insurance, Lemonade discussed a new direct integration with Tesla that lets the insurer pull driving data straight from Tesla vehicles, with customer permission, rather than relying on a phone app or plug-in device. This gives Lemonade far more detailed information about how the car is actually being driven, including things like seatbelt use and precise trip patterns, which helps the company price car insurance more accurately and settle claims faster. Management said this level of “car-native” data becomes increasingly important as cars take over more driving functions on their own, because insurers need to distinguish between miles driven by humans and miles handled by the vehicle’s autopilot or full self-driving systems. While Lemonade did not share updates on its goal of offering very low-cost coverage for autonomous miles, the company said this integration is a crucial building block for that future, allowing it to learn directly from Tesla’s systems and design pricing that reflects how quickly autonomy is developing.
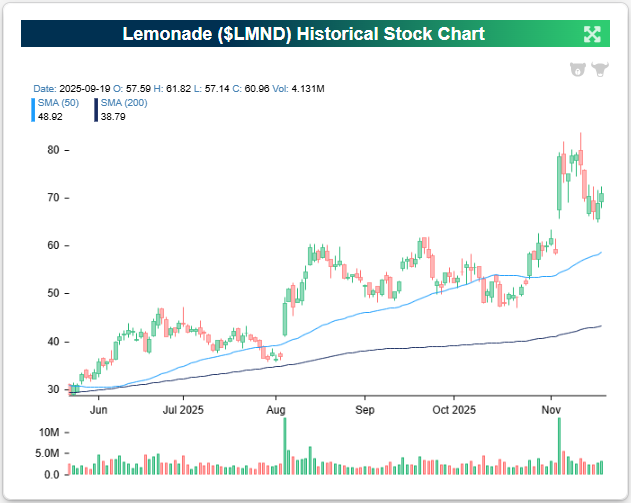
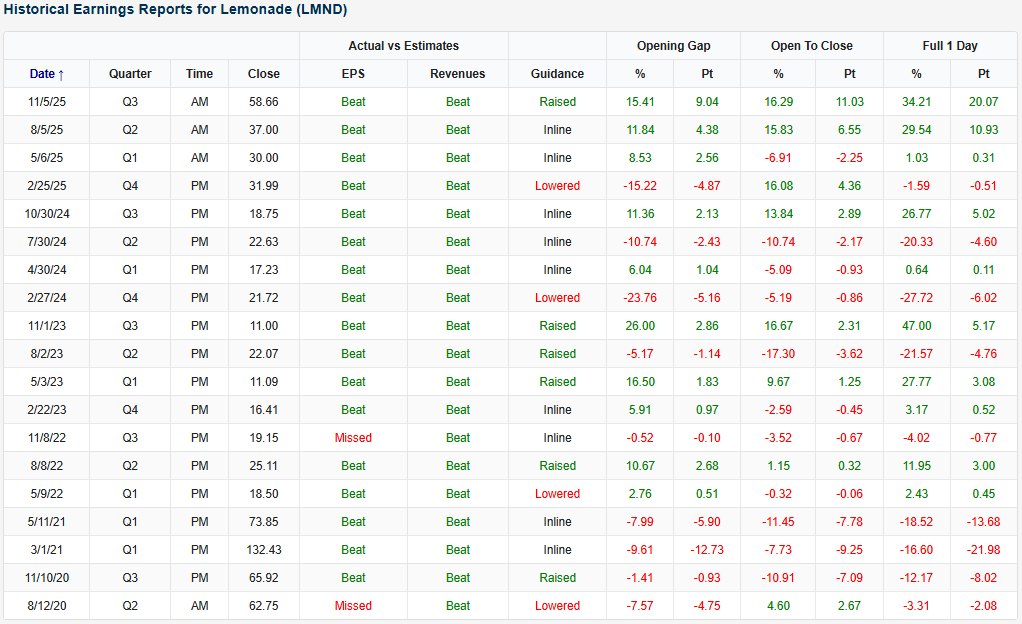
Looking at the snapshot below from our Earnings Explorer, Lemonade (LMND) has found success on earnings since it’s 2020 IPO. The company has beaten EPS and revenue estimates 89% and 100% of the time, respectively, with a running twelve straight quarters of top and bottom-line beats. Despite that consistency, the most recent report was LMND’s first triple play since a back-to-back-to-back string of them back in 2023. The moves for the stock in reaction to earnings have been somewhat of a mixed bag when looking back. After struggling in the first year after becoming a publicly traded company, the stock has seen some very positive, and very negative moves following earnings releases. The company’s last two reports, though, have been overwhelmingly positive in terms of how the stock has rallied.
You can read more about LMND and the 22 other triple plays we covered in our newest report by starting a Bespoke Institutional trial today.
Bespoke Investment Group, LLC believes all information contained in these reports to be accurate, but we do not guarantee its accuracy. None of the information in these reports or any opinions expressed constitutes a solicitation of the purchase or sale of any securities or commodities. This is not personalized advice. Investors should do their own research and/or work with an investment professional when making portfolio decisions. As always, past performance of any investment is not a guarantee of future results. Bespoke representatives or clients may have positions in securities discussed or mentioned in its published content.
Bespoke’s Morning Lineup – 11/20/25 – Jensen Saves the Day
See what’s driving market performance around the world in today’s Morning Lineup. Bespoke’s Morning Lineup is the best way to start your trading day. Read it now by starting a two-week trial to Bespoke Premium. CLICK HERE to learn more and start your trial.
“Great ideas come from everywhere if you just listen and look for them. You never know who’s going to have a great idea.” – Sam Walton
Below is a snippet of commentary from today’s Morning Lineup. Start a two-week trial to Bespoke Premium to view the full report.
Strong results from Nvidia (NVDA) have pushed global markets higher. The stock is trading up over 5% in the pre-market, and as a result, S&P 500 and Nasdaq futures are both trading more than 1% higher. Even Russell 2000 futures, which have no exposure to NVDA, are up over 1%. Heck, the Dow is even trading higher!
International markets were also higher overnight in Asia and this morning, with gains of mostly 1% or more. Treasury yields are basically unchanged, crude oil is back to $60 per barrel, gold is flat, and crypto assets are up at least 3%.
We’re finally getting some economic data this morning, and the main report was the September Non-Farm Payrolls report, which showed 119K jobs created versus forecasts for an increase of 50K. Despite the larger-than-expected increase, the Unemployment Rate ticked up to 4.4% versus estimates of 4.3%. More timely data on jobless claims came in at a relatively benign 220K.
In his last press conference following the Federal Reserve’s October meeting on 10/29, Fed Chair Powell made comments regarding the consumer, noting that “Data available prior to the shutdown show that growth in economic activity may be on a somewhat firmer trajectory than expected, primarily reflecting stronger consumer spending.” He then went on to simply state, “Consumers are still spending.”
Based on data that the Federal Reserve has, consumer activity still looks strong, but the stock market seems to be sending a different message. The chart below shows YTD sector performance, and while the S&P 500 is still up close to 13% on the year, the Consumer Discretionary sector is the worst performer, and Consumer Staples is tied for the second worst. Both sectors are also two of just three sectors down on the year.
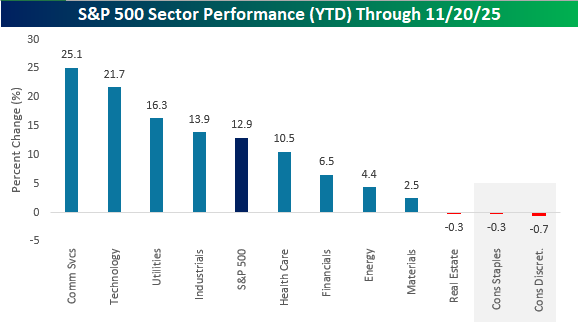
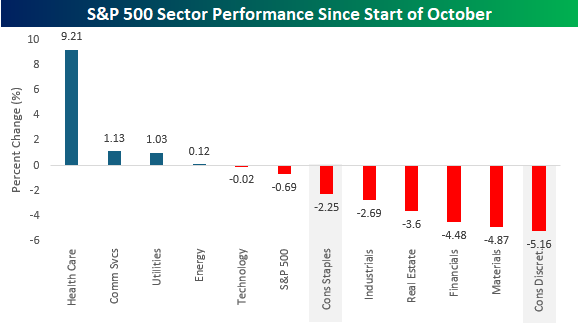
While neither consumer sector was a market leader at any point this year, both sectors have seen significant underperformance since the start of October, when the government shutdown started. While only four sectors are higher, Consumer Staples is down three times more than the S&P 500, and Consumer Discretionary is the worst-performing sector with a decline of 5.2%.
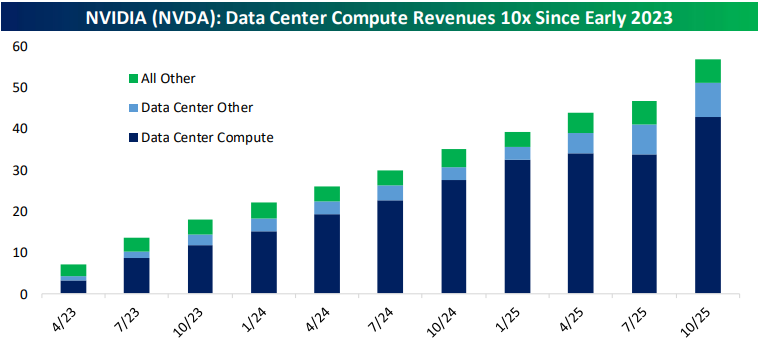
The Closer – NVDA, Morning Sell Offs, COST Low – 11/19/25
Log-in here if you’re a member with access to the Closer.
Looking for deeper insight into markets? In tonight’s Closer sent to Bespoke Institutional clients, we start with a dive into the much anticipated earnings report from NIVIDIA (NVDA) (page 1) followed by an updated look at our Picks and Shovels basket (page 2). After that, we check in on how the S&P 500’s intraday pattern has shaped up (page 3) before closing out with a look at Costco (COST) which hit a rare 52-week low today (page 4).
See today’s full post-market Closer and everything else Bespoke publishes by starting a 14-day trial to Bespoke Institutional today!
Bespoke’s Morning Lineup – 11/19/25 – Waiting
See what’s driving market performance around the world in today’s Morning Lineup. Bespoke’s Morning Lineup is the best way to start your trading day. Read it now by starting a two-week trial to Bespoke Premium. CLICK HERE to learn more and start your trial.
“What we anticipate seldom occurs, what we least expected generally happens.” – Benjamin Disraeli
Below is a snippet of commentary from today’s Morning Lineup. Start a two-week trial to Bespoke Premium to view the full report.
After rallying off the morning lows yesterday, the major averages rallied back near the unchanged line but then drifted lower in the final hour of trading. This morning, equity futures are fractionally higher, while the 10-year yield is unchanged. Crude oil is sharply lower with a decline of 2.7% down to $59 per barrel on reports that the US and Russia may be near an agreement to end the war in Ukraine. Lower oil prices should be a welcome signal for anyone worried about inflation.
In Asia overnight, it was a mixed session with no major index up or down 1%, so maybe we’re starting to see some stabilization following a couple of days of weakness. It was a similar picture in Europe, as the STOXX 600 is up 0.1% and no major country benchmark is up or down 0.5%. Eurozone CPI increased 0.2% m/m in October, which was slightly higher than the 0.1% forecast, but core CPI was right in line with expectations, rising 0.3%.
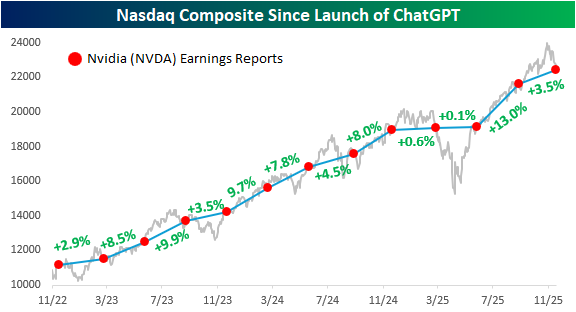
Tom Petty said, “waiting is the hardest part,” and the market and investors can’t wait for Nvidia (NVDA) earnings after the close in hopes that it will help to get the market rally back on track. While results are widely expected to be good, if not great, the stock’s reaction will say a lot about the market’s posture heading into year-end.
The chart below from yesterday’s Chart of the Day shows the performance of Nasdaq since the launch of ChatGPT, and each red dot indicates days when Nvidia (NVDA) reported earnings. The label between each pair of dots shows how the S&P 500 performed in that span. What’s amazing about the last three years is that in every period between NVDA earnings reports, the Nasdaq has traded higher. That kind of consistency is extremely uncommon and won’t last forever.
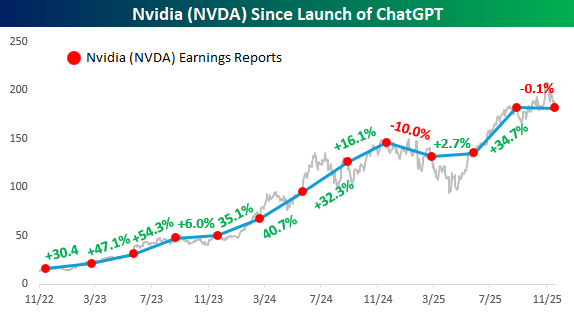
Below we show the same chart but have swapped out the Nasdaq for NVDA. While NVDA’s run has been impressive, it hasn’t traded higher between each of its earnings reports over the last three years. It fell 10% from last November to March of this year, and through yesterday’s close, it’s once again on pace for a decline, although a much more modest one than three quarters ago. If there’s one takeaway from the chart, the smooth, seemingly uninterrupted pace of gains since the launch of ChatGPT has ended.
The Closer – Jobs, CLO Quality, Credit – 11/18/25
Log-in here if you’re a member with access to the Closer.
Looking for deeper insight into markets? In tonight’s Closer sent to Bespoke Institutional clients, we begin with a look into how jobs data is shaping up (page 1) followed by a look into collateralized loan obligations (page 2), auto ABS, and office CMBS (page 3). Next up, we dive into credit card delinquencies (page 4) and New York Fed consumer credit data (pages 5 and 6).
See today’s full post-market Closer and everything else Bespoke publishes by starting a 14-day trial to Bespoke Institutional today!