B.I.G. Tips – Fed Days September 2019
We’ve just published our regular pre-Fed report ahead of an expected rate cut from Chair Powell tomorrow. If you’d like to see our analysis of Fed expectations for tomorrow and beyond, and how the stock market typically reacts to rate cuts, start a two-week free trial to Bespoke Premium. You won’t be disappointed!

Manic Market Moves
We’ve seen a lot of crazy moves in the market over the last couple of weeks. From the massive rotation into value stocks from momentum last week to the moves in oil yesterday and today, it’s really hard to tell how the underlying trend in markets is going to play out. With all this uncertainty, you may be tempted to park some cash in treasuries until things settle down. The only problem with that strategy is that moves in the treasury market have been just as chaotic.
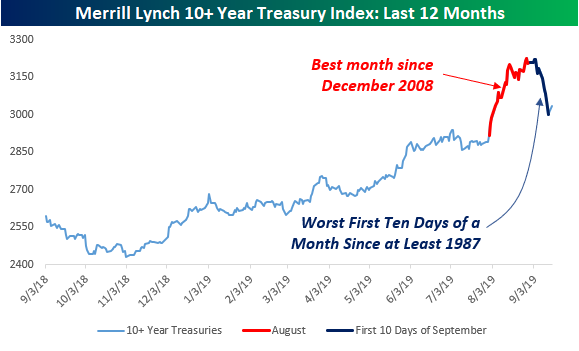
While risk-free rates are still at incredibly low levels relative to history, it masks the fact that long-term US Treasuries are having a horrible start to the month. Using the Merrill Lynch 10+ Year US Treasury Index as a proxy, in the first ten trading days of September, long-term US Treasuries fell 6.5% for their worst opening ten-trading day start to a month since at least 1987 (when daily data begins). In the span of about six weeks, long-term treasuries have seen their best monthly gain in nearly 11 years followed by their worst start to a month in at least 30 years. Perfectly rational. Start a two-week free trial to Bespoke Institutional to access our interactive economic, earnings, and seasonality tools.
Homebuilder Sentiment Reaches 11-Month High
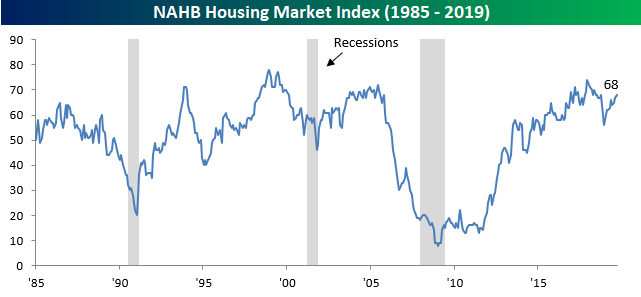
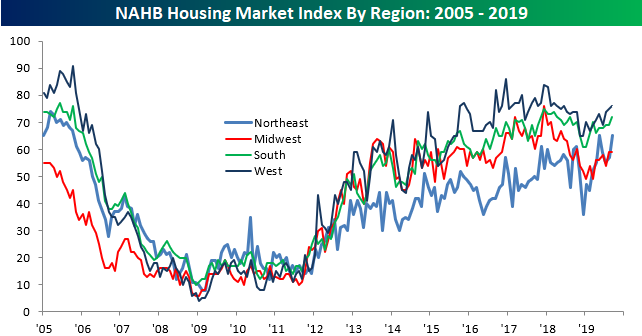
Treasury yields have started to move higher from the record low levels reached in August, but sentiment among homebuilders remains strong as even at these levels interest rates are making housing much more affordable. The latest release of sentiment from the National Association of Homebuilders (NAHB) came in stronger than expected, rising from 67 up to 68 versus estimates for a reading of 66. At the current level of 68, sentiment is the highest it has been since last October, just before the market swooned in Q4.
Looking at the internals of this month’s report, strength was pretty broad-based. In terms of the headline index’s components, Future Sales was the only one that declined, and the magnitude of that drop was only modest. Present Sales increased from 73 up to 75, while Traffic was unchanged right at the neutral mark.
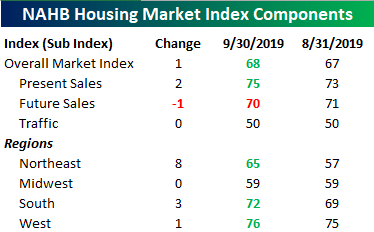
The chart below shows the regional breakdown of homebuilder sentiment going back to 2005. Sentiment in the Midwest was unchanged at 59 and is now the region of the country where sentiment is the weakest. That tag previously belonged to the Northeast, but after this month’s 8 point jump, sentiment in that region of the country is tied for its highest level since the Financial Crisis. Sentiment in the South and West saw smaller improvements in sentiment this month, but builders in those regions are still much more optimistic than they are in the Midwest and Northeast. Start a two-week free trial to Bespoke Institutional to access our interactive economic tools.
Citi Global Surprise Breaks Record Streak of Days in Negative Territory
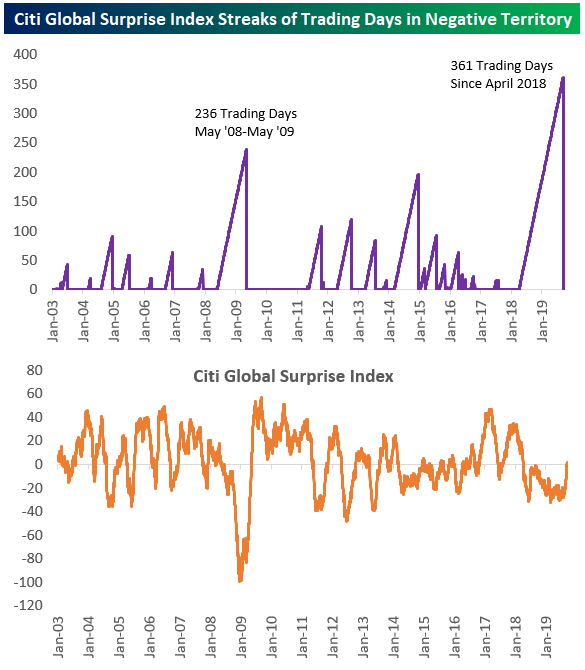
The Citi Global Surprise index measures the pace at which economic indicators around the world are coming in better than expected compared to economist estimates. As an example of how weak the global economy has been over the last 18 months, the Citi Global Surprise index was in negative territory for a record 361 trading days from April 2018 through last Thursday. But just in time for what will likely be another rate cut from the Fed this week, the Global Surprise index broke its record streak on Friday by closing in positive territory.
As shown below, not even during the Financial Crisis did the surprise index remain negative for so long. Back in 2008 and 2009, however, the Surprise index got much more negative than it did at any point during the streak that just ended. Start a two-week free trial to Bespoke Institutional to access our Biggest Movers tool, Trend Analyzer, Chart Scanner, and much more.
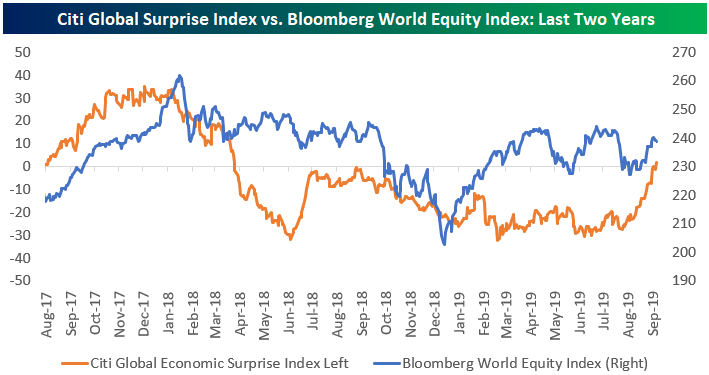
Below is a chart comparing the Citi Global Surprise index to the Bloomberg World equity market index over the last two years. The two don’t track each other very closely. In mid-2018, the Surprise index saw a spike similar to the one we’ve seen over the last couple of months, but that spike was followed by a very weak fourth quarter for the global stock market. The Surprise index didn’t predict the Q1 2019 bounce-back for stocks either.
Dividend Stock Spotlight: Phillips 66 (PSX)
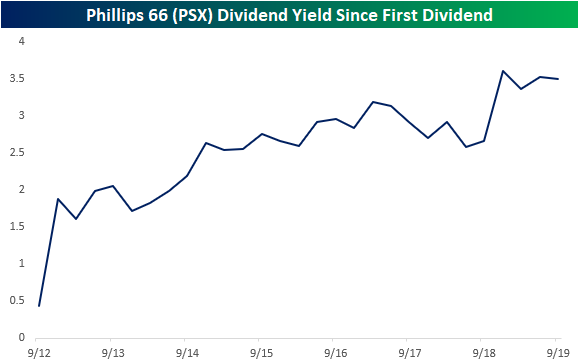
Crude oil, and as a result the energy sector, surged yesterday in response to attacks in Saudi Arabia which has damaged the country’s oil production. Crude rose over 14% while the Energy sector (XLE) rose 3.36%. Taking a more granular look at the sector, S&P 500 stocks across the GICS Level 4 sub-industries saw varied responses to the news. Drilling in addition to Exploration and Production companies were up the most, rising 14.3% and 7% respectively, while the Refining and Marketing industry, although still higher, only rose around 14 bps. Although this sub-industry did not explode higher on this news, Phillips 66 (PSX) in particular is looking attractive. Not only is the company’s 9.4 P/E below the median for the sub-industry (12.2) and sector (13.6), but PSX is also eyeing a nice technical breakout. Mid-summer and again in the past few weeks, PSX has stopped short of resistance around $105 which can be traced back to a short rally at the end of last year. in the past couple of days, it has come back up to these levels after putting in a higher low at the end of August.
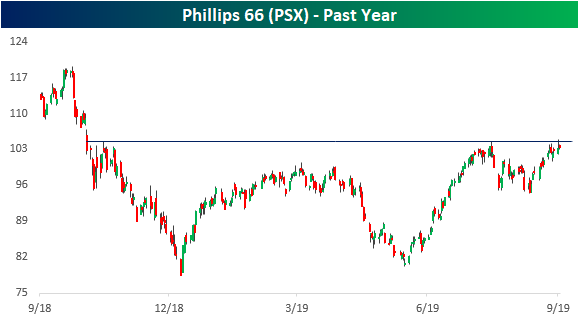
Even as the stock looks to breakout, at 3.5%, the current dividend yield is still near its highest level since PSX first began paying a dividend in 2012. This yield is also higher than the yield on the average S&P 500 energy stock which is currently at 3.05%. This dividend has been steadily growing at a rate of 13.8% over the past five years. The company has continued room to grow this dividend as the payout ratio is only at 28.67% and debt to equity only sits at 46.59%. For comparison, the average of these two ratios for all S&P 500 energy stocks is 73.64% and 58.4%, respectively. In other words, in addition to having technicals and valuation with potential, PSX also has a safe and sizable dividend to boot. Start a two-week free trial to one of our premium membership options to receive Bespoke’s most actionable stock market research.
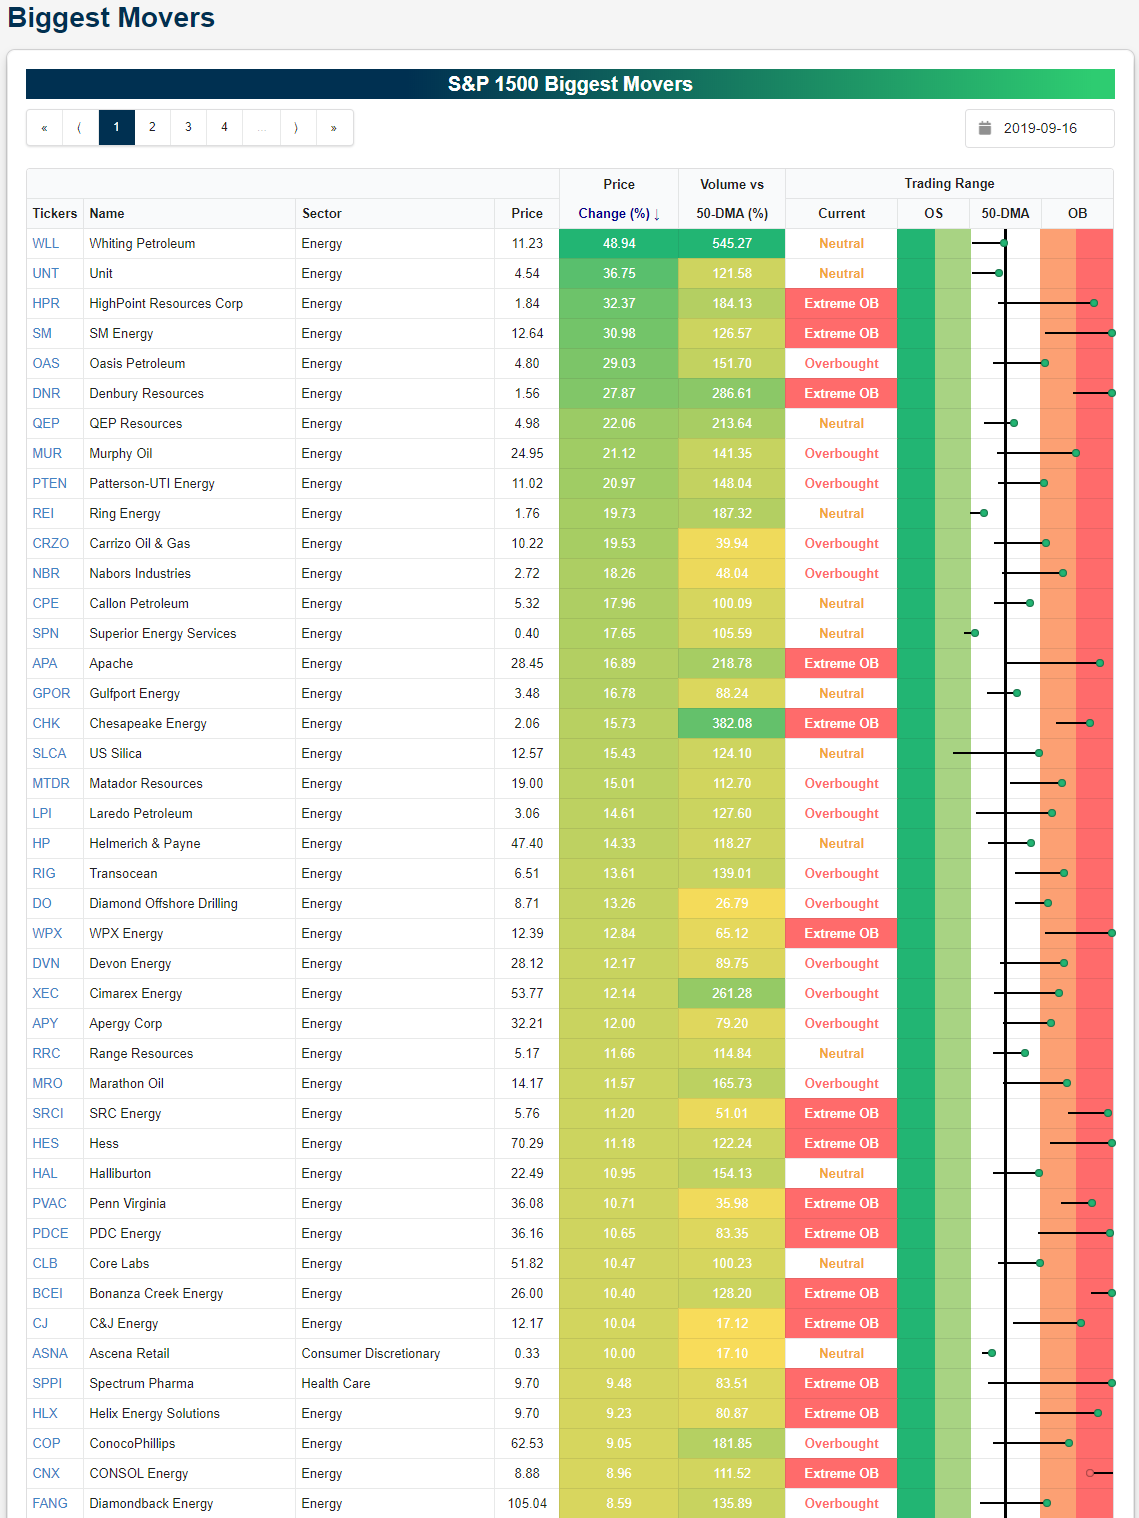
Energy Dominates Yesterday’s Biggest Movers
After crude oil surged over 14% yesterday, energy stocks unsurprisingly dominated the list of biggest movers as shown below. Of the S&P 1500’s stocks, Whiting Petroleum (WLL) gained the most yesterday with a nearly 50% gain. Volumes for WLL were also over 5 times higher than the average over the past 50 days.
While no other stock saw quite as large of a rally as WLL, 18 other stocks actually outperformed oil’s 14% gain on the day. Three of these rose over 30% and four rose over 20%. A large number also finished the day over 10% higher from Friday. For the most part, these were substantial moves within the individual stocks’ ranges as seen by the long tails in the Trading Range section of the tool shown below. Several finished the day in extreme overbought territory over two—for some over three—standard deviations above their 50-DMAs, but there are others that actually didn’t even manage to move back above their 50-DMAs even with these monster gains. WLL is one of these which finished just under half a percent below its 50-day. Start a two-week free trial to Bespoke Institutional to access our Biggest Movers tool, Trend Analyzer, Chart Scanner, and much more.
Bespoke Morning Lineup – Still Sorting Things Out
See what’s driving market performance around the world in today’s Morning Lineup. Bespoke’s Morning Lineup is the best way to start your trading day. Read it now by starting a two-week free trial to Bespoke Premium. CLICK HERE to learn more and start your free trial.

The Closer – Breadth, Decile Destroyed, GM Strike, Empire Manufacturing – 9/16/19
Log-in here if you’re a member with access to the Closer.
Looking for deeper insight on markets? In tonight’s Closer sent to Bespoke Institutional clients, we begin with a look at how breadth stacks up to the recent run-up in equities. We then show the evolution of our decile analysis based on YTD performance before showing the surge in crude oil in the context of EUR. Next, we review the GM strike and the historical implications on the market. We also show the remarkable uptick in strikes recently. We finish with a rundown of today’s Empire Manufacturing data..

See today’s post-market Closer and everything else Bespoke publishes by starting a 14-day free trial to Bespoke Institutional today!
Retail to Oil Ratio Drops Dramatically
Crude oil’s 10%+ jump today had a negative impact on consumer-related areas of the equity market. Given the concern that higher oil prices will be a drag on global activity, the RTH Retail ETF fell more than 1.3% on a day when the S&P 500 was down just 30 basis points. Below is a historical chart of the ratio between RTH and the oil commodity ETF — USO. When the line is rising, the retail sector is outperforming oil, and vice versa for a falling line. This ratio has been trending higher throughout the decade, and it just recently hit a new high. But today that ratio fell out of bed as USO jumped and RTH fell. In fact, the steep drop in the ratio is the largest one day decline on record going back to 2011 when RTH first began trading. Similarly, with RTH down over 1.25%, USO is also outperforming in terms of percentage gain by the widest margin ever.

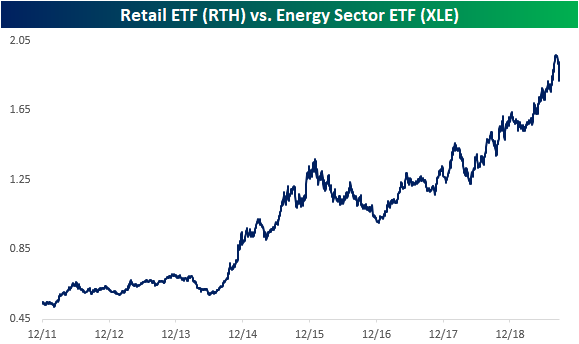
By that same vein, the ratio between retail and the energy sector (XLE) has also seen its largest single-day decline to date. Ironically, this is after the line went nearly vertical following retails’ massive run in August (around the time of earnings for these companies). This ratio has now pretty much given up that entire move upwards.
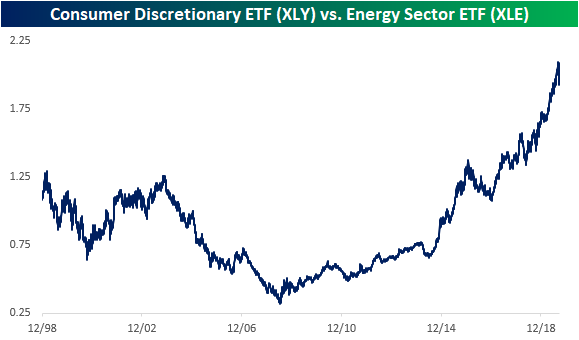
Even taking a broader scope, comparing the entire consumer discretionary sector to the energy sector, this ratio has also seen its largest single-day decline ever. But even though oil and energy are drastically outpacing other assets today, for most of the past several years that has not been the case.
It has been more than a decade since oil and the energy sector were long-term market leaders. Only time will tell if today’s huge drop in these ratios from record levels is the start of another extended period of outperformance for Energy. Start a two-week free trial to Bespoke Institutional to access our Security Analysis tool, Trend Analyzer, and much more.
Big Days Happen in….
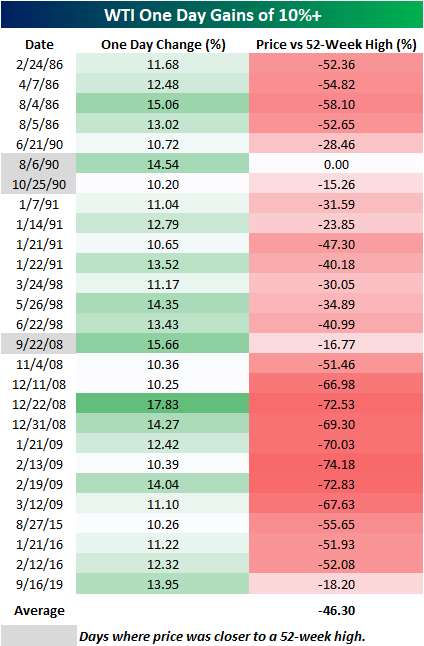
Crude oil rocketed higher today as WTI rallied just under 14% versus Friday’s close in what was the largest one-day gain since 2/19/09. There’s an old saying on Wall Street that big days happen in bear markets, and in the equity market that has tended to be the case as some of the largest percentage gains in stock market history were all during major bear markets. Looking at the largest one-day moves in crude oil shows a similar story as well.
The table below shows every one day gain of 10%+ in WTI going back to 1983, and for each day we have also shown how far crude oil was trading from its 52-week high after the one day gain of 10%+. In the case of today’s gain, WTI prices are still more than 18% below their 52-week high, and while that may sound like a lot, there have only been three other days of the 26 prior ones shown where crude oil rallied more than 10% and finished the day closer to a 52-week high than it did today (gray shaded dates). In fact, of all the days listed below, the average spread between WTI’s closing price on the day of the big gain and its 52-week high was over 46%! Talk about being in the hole! Start a two-week free trial to one of our three membership levels to receive Bespoke’s most actionable ideas.