Bespoke’s Morning Lineup – 1/29/20 – An Apple a Day Keeps the Doctor Away
See what’s driving market performance around the world in today’s Morning Lineup. Bespoke’s Morning Lineup is the best way to start your trading day. Read it now by starting a two-week free trial to Bespoke Premium. CLICK HERE to learn more and start your free trial.

After more than three months without a 1% move in either direction, the S&P 500 has now had back to back daily 1% moves. First Monday with a decline of over 1% and then yesterday with a gain of over 1%. In the S&P’s history, there have only been four prior periods where the index went more than three months without a 1% move and then followed that streak with back to back moves of 1%. Yesterday’s 1% rally, however, was the first time that one of the two days included a 1% move to the upside.
The Closer – Apple Earnings, Market Margins, Manufacturing Activity, CBO – 1/28/20
Log-in here if you’re a member with access to the Closer.
Looking for deeper insight on markets? In tonight’s Closer sent to Bespoke Institutional clients, we review two of the most widely anticipated earnings: Starbucks (SBUX) and Apple (AAPL). We then take a look at the record high price-to-sales ratio for the S&P 500 before turning to today’s manufacturing data. We finish by going over the CBO’s economic forecasts.

See today’s post-market Closer and everything else Bespoke publishes by starting a 14-day free trial to Bespoke Institutional today!
Dividend Stock Spotlight: State Street (STT)
Earlier today we updated our weekly Bespoke Stock Scores database, which takes a “fusion” approach to ranking every stock in the S&P 1500. Each stock gets a fundamental ranking, a technical ranking, and a sentiment ranking. These three scores are then combined to form our overall Stock Score. This week, State Street (SST) came in with the highest overall score for a second week in a row. The company’s current fundamental picture is attractive with a solid valuation relative to its S&P 1500 peers in the Capital Markets industry. The company’s PEG, P/B, P/S, and P/E ratios are all lower than those of similar companies.
In addition to strong fundamentals, State Street’s technicals also played into its high score these past couple weeks. Over the past two years, STT has remained in a downtrend off of its January 2018 highs. But the stock bottomed out in August around $48, finally breaking this downtrend later in the fall. The stock has gone on a significant rally in the time since having risen nearly 60% off of the August low through today. Given this strong run over the past few months, in recent days STT has experienced a bit of mean reversion after reaching extremely overbought levels (over two standard deviations above its 50-DMA). As shown in the chart below, this was the first major pullback for the stock since September/October but it has also provided a more opportune entry point. In fact, the stock currently has a “good” timing score in our Trend Analyzer.
In addition to the high stock score based on these metrics, adding to STT’s attractiveness is a high dividend yield which recent declines in the stock price have lifted to 2.71%. While not the highest yield, it is larger than the 2.27% yield of the overall Financial sector. Given the payout ratio remains very healthy at 29.7%, the company has plenty of room to continue to grow this dividend as it has every year of the past couple of decades outside of the Financial Crisis (2008-2010). Start a two-week free trial to Bespoke Premium to access our research platform, which includes our weekly Stock Scores rankings and much more.

Consumers Still Confident
Today’s report on Consumer Confidence for the month of January came in at 131.6 versus December’s reading of 128.2 and was handily above forecasts for a reading of 128.0. At this level, confidence remains stuck in the narrowing range it has occupied for the last 18 months and well above its historical average of ~95.
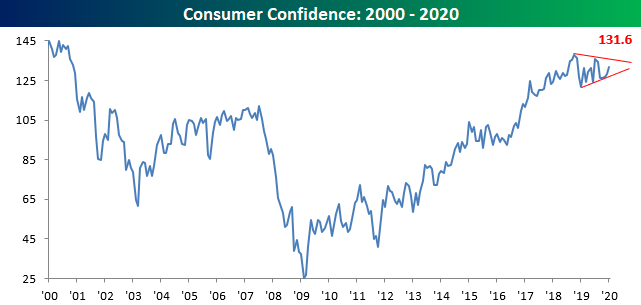
Breaking down this morning’s report by Present Situation and Expectations, the wide gap between the two remains well intact and near its widest levels on record. While consumers’ views toward the present are near twenty-year highs, sentiment towards the future has been stuck in a sideways range. For more than three years now, consumers have been expecting their optimistic views of current conditions to deteriorate in the future, but at this point those concerns have never materialized.

One reason the less optimistic outlooks have yet to materialize is that the job market remains strong. Despite some mixed signals towards the end of last year, nearly half of all consumers say jobs are ‘plentiful’ which is near the highest levels on record.

The strong job market is also fueling improved sentiment among the lowest paid US consumers. While sentiment levels have stalled out among consumers with incomes of $35K and above, confidence among consumers with incomes of $15K or less has surged in recent months. In fact, over the last seven months, confidence levels among this income cohort have seen two of their five largest m/m gains on record (January 2020 and July 2019). Start a two-week free trial to Bespoke Institutional for full access to our research and interactive tools.

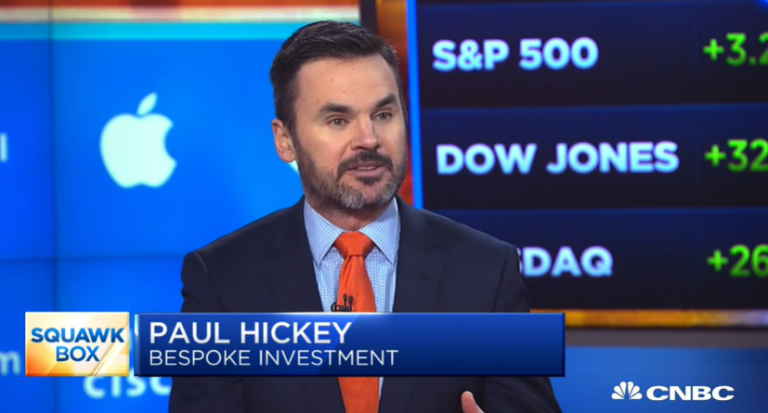
Bespoke CNBC Appearance (1/28/20)
Bespoke co-founder Paul Hickey appeared on CNBC’s Squawk Box today to discuss the upcoming earnings season and trends for stocks reporting. To view the segment, click on the image below.
Start a two-week free trial to Bespoke Institutional for full access to our research and interactive tools.
Bespoke’s Morning Lineup – 1/28/20 – Turnaround Tuesday?
See what’s driving market performance around the world in today’s Morning Lineup. Bespoke’s Morning Lineup is the best way to start your trading day. Read it now by starting a two-week free trial to Bespoke Premium. CLICK HERE to learn more and start your free trial.
In yesterday’s Chart of the Day we noted that Monday gaps down of 1%+ typically see the biggest bounce backs on the following day — the “turnaround Tuesday” effect. While it’s still early, futures are attempting a bounce this morning as news regarding the coronavirus hasn’t gotten materially worse. While the number of cases has ballooned, that trend is to be expected. What we haven’t seen overnight is an increase in the mortality rate. Relative to yesterday, in fact, it appears to have actually declined slightly. We caution, though, that it’s still very very early in the outbreak, and no one really knows how this is going to shake out. We can all make estimates and look at various models but in the end, they are only that. One thing we do know is that China is one of the world’s largest economies, and growth there is definitely going to take a hit.
The Closer – Commodities & Rates Plunge, Home Sales Soften, Five Fed Firms – 1/27/20
Log-in here if you’re a member with access to the Closer.
Looking for deeper insight on markets? In tonight’s Closer sent to Bespoke Institutional clients, we begin with a look at the drops in commodities and rates and what forward returns could look like. We also show the results of today’s’ 2-Year Treasury Note and 5-Year Treasury Note auctions. Turning to today’s macroeconomic data releases, we recap new home sales data for December. We finish tonight’s note with a review of regional Fed manufacturing data.
See today’s post-market Closer and everything else Bespoke publishes by starting a 14-day free trial to Bespoke Institutional today!
Market Cap Distinctions
In a client note earlier this morning, we noted that even after today’s declines, the S&P 500 is still well over 1% above its 50-day moving average. In other words, for large-cap stocks, there is still a decent amount of air between current levels and the S&P 500’s ‘normal’ range and for that matter, oversold levels. While the S&P 500 may not be oversold yet, it does look to have broken its steep uptrend that had been in place since the October lows.

Similar to the S&P 500, the Nasdaq remains well above both its 50 and 200-day moving averages. Additionally, even though it saw a steeper decline on Monday, the Nasdaq is still 3% above its 50-day moving average. Unlike the S&P 500, though, the Nasdaq’s uptrend off the October low still looks to be intact.

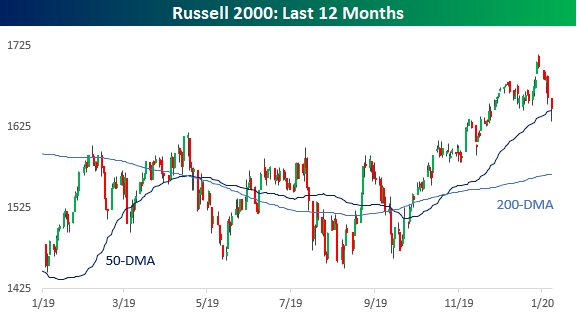
While the large-cap S&P 500 and Nasdaq indices are still trading at extended levels, when you move down the market cap ladder, mid and small-cap indices are trading at much less extended levels. The mid-cap S&P 400 actually briefly traded below its 50-DMA earlier today and is only just barely hanging out above that level heading into the close. Regarding the trend line off the October lows, that level didn’t even come into play today because that trend line broke on Friday!

Like the mid-cap S&P 400, the small-cap Russell 2000 also actually traded below its 50-DMA earlier today before rallying back above that level in the afternoon.
Finally, semis. The Philadelphia Semiconductor index was especially hard hit on Monday falling by more than 3.5%. Obviously, this index is a lot more volatile than the major indices highlighted above, but while most other indices rallied well off their early lows today, the magnitude of the move off the lows for semis was a lot more lethargic. With a large portion of the sector’s production based in China, it is understandable that the sector has been under pressure. For a sector that we consider to be a market leader, though, a bigger breakdown for the semis would be a troublesome signal for the broader market. Start a two-week free trial to Bespoke Institutional to access all of our market tools including the Earnings Explorer, Chart Scanner, Trend Analyzer, Custom Portfolios, and much more.

Stocks Yielding More Than Bonds Again
In the early summer of last year, the 10-Year Treasury Note was bid up considerably, resulting in it yielding less than the S&P 500’s dividend yield. In fact, at the point of the largest divergence between the two in late August, the dividend yield of the S&P 500 was 56.9 bps higher than the yield on the 10-Year Treasury. Although the disparity between the two has shrunk from that August peak, that trend has generally continued in the months since then, though equities’ surge into the end of the year saw bonds briefly yielding more in December. Since the start of the new year, stocks once again hold a higher yield, especially today as worries about the coronavirus have resulted in the selling of risk assets (raising the S&P 500’s yield) and subsequent buying of safe-havens (lowering the 10-Year Treasury yield). Now, the spread between the S&P 500’s dividend yield and that of the 10-Year is at its widest level in favor of the S&P 500 since October 10th. Start a two-week free trial to Bespoke Institutional to access our full library of research and interactive tools.


S&P 500 Energy Sector (XLE) Breaks Down
The S&P 500 Energy sector ETF (XLE) tried to break out of its downtrend in late 2019, but the bounce has been completely erased as of today with it plunging to new 52-week lows. Talk about an ugly chart. Start a two-week free trial to Bespoke Institutional to access our Bespoke Report, Chart Scanner, custom portfolios, and much more.

Remarkably, the Energy sector now has a weighting in the S&P 500 with a 3-handle – 3.97% to be exact. That’s less than 50 basis points larger than the Utilities sector, and less than 1.5 percentage points away from being the smallest sector in the entire index (which currently belongs to Materials at 2.52%).

Only twelve years ago, the Energy sector was less than 0.70 percentage points away from being the largest sector in the S&P 500. In mid-2008, the Energy sector’s weighting peaked at 15.96%, which was 67 basis points below Tech’s weighting of 16.63% at the time. Below is a long-term chart of the Energy sector’s weighting in the S&P 500 since 1990. The red line shows its average weighting of 9.03% over this time period. At current levels, Energy’s weighting is more than 50% below its historical average and easily at its lowest level of the last 30 years.

Below is a 10-year performance comparison of the S&P 500 Energy sector (XLE) versus the S&P 500 (SPY). As shown, XLE is now down 1.84% in price over the last ten years, while SPY is up 195.1%.

Below is a chart of XLE going back further to 1999 when the ETF began trading. From 1998 through mid-2008, the Energy sector was one of the best sectors to be in. It fell with everything else during the Financial Crisis and then managed to recover all of its losses and make new highs in 2014. It’s really only the last five years where the bottom has fallen out, especially relative to the rest of the stock market.

If we compare the price change of XLE to SPY since 1999, SPY has actually only recently overtaken the Energy sector in terms of performance. XLE is up 137% since the start of 1999 while SPY is up 169%. Just over five years ago, XLE was up more than 300% since 1999 versus SPY’s gain of 65%.
