Bespoke’s Sector Snapshot — S&P 500 Sector Weightings
S&P 500 sector weightings are important to monitor. Over the years when weightings have gotten extremely lopsided for one or two sectors, it hasn’t ended well. Below is a table showing S&P 500 sector weightings from the mid-1990s through 2016. In the early 1990s before the Dot Com bubble, the US economy was much more evenly weighted between manufacturing sectors and service sectors. Sector weightings were bunched together between 6% and 14% across the board. In 1990, Tech was tied for the smallest sector of the market at 6.3%, while Industrials was the largest at 14.7%. The spread between the largest and smallest sectors back then was just over 8 percentage points.
The Dot Com bubble completely blew up the balanced economy, and looking back you can clearly see how lopsided things had become. Once the Tech bubble burst, it was the Financial sector that began its charge towards dominance. The Financial sector’s sole purpose is to service the economy, so in our view you never want to see the Financial sector make up the largest portion of the economy. That was the case from 2002 to 2007, though, and we all know how that ended.
Unfortunately we’ve begun to see sector weightings get extremely out of whack once again.
If you would like to see the most up-to-date numbers for S&P 500 sector weightings, simply start a two-week free trial to our Bespoke Premium or Bespoke Institutional services. Click back to this post to see the numbers once you’re signed up!

Best and Worst Performing S&P 500 Stocks YTD
The average stock in the S&P 500 is currently down 0.65% year-to-date. There are 34 stocks in the index up 10%+ year-to-date, while there are 61 stocks that are down 10%+. As shown, L Brands (LB) ranks first at this point in 2020 with a year-to-date return of 26.2%. (Note that while Tesla (TSLA) is up 85% year-to-date and has a market cap that’s larger than 90% of the index, it’s not yet in the S&P 500.) Paycom (PAYC) and ServiceNow (NOW) rank 2nd and 3rd with gains of more than 20%, while Lennar (LEN) and TransDigm (TDG) round out the top five. Other notables on the list of this year’s biggest winners include Progressive (PGR), PulteGroup (PHM), salesforce.com (CRM), Albemarle (ALB), and Amazon.com (AMZN).

While there are three stocks up 20%+ YTD, there are four that are already down 20%+. TechnipFMC (FTI) is down the most at -21.85%, but Capri Holdings (CPRI) is not far behind at -21.32%. Diamondback Energy (FANG) and ViacomCBS (VIAC) are the other two stocks down 20%+. Other notables on the list of biggest losers so far in 2020 include DuPont (DD), Phillips 66 (PSX), Advance Auto Parts (AAP), Schlumberger (SLB), VF Corp (VFC), Dow (DOW), Kohl’s (KSS), Carnival Corp (CCL), and United Airlines (UAL).

ISM Manufacturing Soars
One month ago, ISM released its monthly reading on the manufacturing sector which we noted was fortunately overshadowed by the headlines surrounding the geopolitical tensions in the Middle East. That December ISM Manufacturing report fell to 47.2 which was the lowest headline level since June 2009. One month later, the headline number has more than bounced, rising 3.7 points to 50.9. As shown in the second chart below, that 3.7 increase is one of the largest one month increases of the past 20 years. Ironically, while last month saw the weakest reading since June 2009, the 3.7 point bounce off of those lows was the largest month-over-month jump for the headline number since May 2009.
The big jump in January far exceeded forecasts for a continued contractionary reading of 48.5. Now back above 50, this was not only the strongest but also the first expansionary reading for the headline index since July 2019. That five-month stretch from July to December was the longest run of consecutive contractionary readings since another five-month streak ending in February 2016; the longest such streaks of the current cycle.


Glancing at the commentary section, the index’s uptick certainly shows itself with Computer & Electronic Products mentioning suppliers are at or above capacity, though, there are also a fair share of negative comments. The headwinds that have been prominent for over a year now have by no means dissolved as multiple comments address adverse effects of tariffs and/or weakened demand. Computer and Electronic Products as well as Food, Beverage and Tobacco products make mention of hurt margins. In other words, although the data has improved dramatically, qualitatively there is still some weakness present.

In the table below, we break down the changes over the past month and year of the individual sub-indices. Breadth was very strong in January with every sub-index rising with the exception of Supplier Deliveries. Not only did a vast majority rise month-over-month, but now seven of the eleven indices have expansionary (>50) readings compared to just two last month. By far the biggest winner has been Production which follows it being one of the biggest decliners last month. But even with the surge it is still lower than where it stood one year ago. But that is more broadly the norm as Customer Inventories, Prices Paid, and Export Orders were the only ones to have risen since last January.
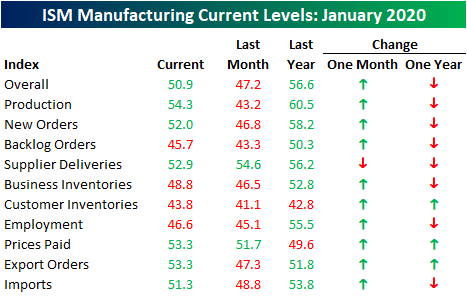
As previously mentioned, the 11.1 jump for production was a massive improvement. Now at 54.3, it is at its highest level since March 2019. As shown in the second chart below, these types of massive moves in one month have been pretty rare. Over the past two decades, there has only been one other time, May 2009, that this sub-index has risen by more than 10 points in a single month. Expanding the horizon and looking back to 1948 when data begins, there have been a total of just 11 (including this most recent occurrence) months in which the Production sub-index has risen by 10 points or more.


New orders was another sub-index that experienced a notable improvement rising 5.2 points to 52.0. Although the month-over-month rise was not nearly as large as that of production, for the New Orders index it was the largest one month increase since January of last year and it is now at its highest level since May of last year.

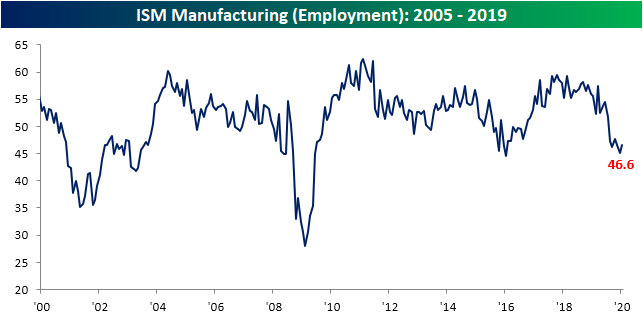
Employment for the manufacturing sector has been notably weak with last month’s reading the lowest since January of 2016. Although it improved to 46.6 from 45.1, the improvement was much more modest when compared to the headline number.
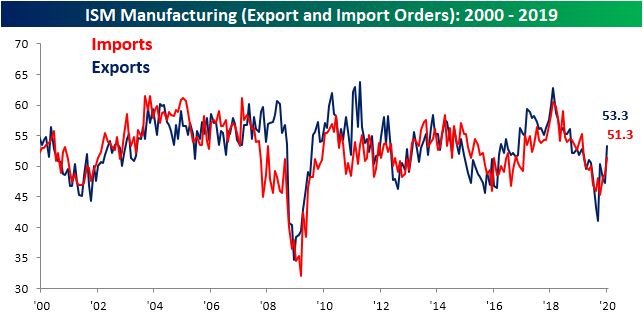
Given the recency of the issue, the full effects are unlikely to show in the January data, but the coronavirus has not yet put a damper on trade activity. Both export and import orders have been on the rise over the past few months and January was no exception as both sit at their strongest levels around a year or more. Start a two-week free trial to Bespoke Institutional to access our interactive economic indicators monitor and much more.
Bespoke’s Morning Lineup – 2/3/20
See what’s driving market performance around the world in today’s Morning Lineup. Bespoke’s Morning Lineup is the best way to start your trading day. Read it now by starting a two-week free trial to Bespoke Premium. CLICK HERE to learn more and start your free trial.

Go Niners!
Super Bowl LIV kicks off later this afternoon in Miami, and this year’s game is important for the AFC as a win by the Chiefs would put it in a tie with the NFC for Super Bowl victories at 27 each. Interestingly enough, the last time both conferences had the same number of Super Bowl wins was all the way back in 1990 when they each had twelve. That was also right in the middle of the 13-year stretch where the NFC defeated the AFC every year in what was the longest run of Super Bowl dominance by either conference. Looking at the chart, it’s interesting to see the various runs by each conference. From Super Bowl III to XV, the NFC only won twice. Then from XVI to XXXI, the AFC won only once, while in the twelve years from XXXII to XVIII, the NFC won only three times. It’s only in the last ten years that there has been some parity in the games as each conference has won five times.

Most people have already heard about the Super Bowl indicator and its implications for the stock market. While no one in their right mind would ever make stock market investments based on the outcome of a football game (although we’ve heard of crazier theories), it makes for good conversation while you’re watching the game.
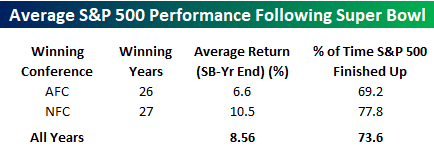
The table below summarizes the historical performance of the S&P 500 after the Super Bowl based on which conference came out on top. In the 26 years that the AFC hoisted the Lombardi trophy, the S&P 500 averaged a gain of 6.6% for the remainder of the year with positive returns 69.2% of the time. For the NFC, though, returns are more impressive with an average gain of 10.5% and positive returns 77.8% of the time. Broadly speaking, the NFC has been better for stocks, so as much as Andy Reid may be the sentimental favorite, your wallet should be rooting for the NFC.
Another reason you should be rooting for the 49ers tonight is because of their past record. In the five prior years where they won the Super Bowl, the S&P 500 was up for the remainder of the year every time by an average of 20.2%! The individual rest-of-year returns in those five years were 21.9% (1982), 23.3% (1985), 23.3% (1989), 1.4% (1990), and 30.9% (1995). Given all the concerns surrounding the coronavirus in the last two weeks, we think a number of investors would even sign up for 1.4%! Besides the 49ers, there are only three other teams who have won the Super Bowl at least three times and also seen positive market returns following each of their wins (Broncos-3, Steelers-6, and Redskins-3). The Chiefs, on the other hand, have not had such a lucky record. The one time they won the Super Bowl was back in 1970 (Super Bowl IV), and after that win, the S&P 500 was modestly down for the remainder of the year with a decline of 0.3%. Another positive? The Chiefs have also been on the losing end of the Super Bowl once. That was in the first Super Bowl when they lost to the Packers. After that loss, the S&P 500 went on to rally 14.1% for the remainder of the year. Go Niners! Start a two-week free trial to Bespoke Institutional for full access to our market research and interactive trading tools.

Bespoke Brunch Reads: 2/2/20
Welcome to Bespoke Brunch Reads — a linkfest of the favorite things we read over the past week. The links are mostly market related, but there are some other interesting subjects covered as well. We hope you enjoy the food for thought as a supplement to the research we provide you during the week.
While you’re here, join Bespoke Premium for 3 months for just $95 with our 2020 Annual Outlook special offer.
Social Statistics
The U.S. Housing Crisis Is Making Its Way to the Heartland by Jordan Yadoo and Noah Buhayar (Bloomberg Quint)
As home prices outpace the growth of economic activity in big swathes of the country and refugees of the coasts seek affordability, smaller and mid-sized cities are seeing affordability fade from the grasp of the middle class. [Link]
Life expectancy in the US rises for the first time in four years (New York Post/Associated Press)
After four years of declines that were driven by rising suicides and overdoses, declining death rates from cancer and lower rates of mortality related to drugs in 2018 helped push up overall life-expectancy for the first time in four years. [Link]
Bike Fatalities Are On The Rise by Phillip Reese (Kaiser Health News)
As more cyclists take to the roads and more drivers are distracted by their phones, the number of cyclists killed in accidents has trended steadily higher relative to the population both in California and across the rest of the country. [Link]
Screens
Collectors Are Spending Thousands on Video Games They Will Never Play by Jason M. Bailey (NYT)
Similar to other forms of artistic expression, video games are a collector’s dream even if they’ve never actually blown a cartridge off and slammed it into a console. [Link; soft paywall]
Modern Family: Average Parent Spends Just 5 Hours Face-To-Face With Their Kids Per Week! by Ben Renner (Study Finds)
A survey of UK households recently found that on average parents spend less than five hours per week in conversation with their kids, with a variety of strategies being pursued to reconnect including opting-in to kids’ activities including video games. [Link]
Big Tech
Facebook’s Relationship With Democrats Hits a Low Point by Deepa Seetharaman, Joshua Jamerson and Emily Glazer (WSJ)
In an effort to avoid the ire of the President, Mark Zuckerberg may have steered too far from Scylla and too close to Charybdis, as lawmakers see recent internal policy decisions as tipping the scales towards Republicans. [Link; paywall]
Sports
Race Is On to Cash In on Sports Betting by Katherine Sayre and Benjamin Mullin (WSJ)
A major gambling operator took a 36% stake in Barstool Sports, a blog best known for its irreverent and often misogynistic coverage of sports, in an effort to drive traffic to its gambling operations. [Link; paywall]
Cosmology
The Biggest Celestial Event of the Year Could Happen Tomorrow by Marina Koren (The Atlantic)
Given cosmic timelines, we’re never assured a view of the most spectacular events in the night sky, but the Betelgeuse supernova stands a real chance of taking place during our lifetimes. [Link]
Church Changes
German Bishops Rethink Catholic Teachings Amid Talk of ‘Schism’ by Francis X. Rocca (WSJ)
As European church officials push for a more modern church tradition, conservative American bishops are considering a revolt that could see a fresh schism in the church of St. Peter. [Link; paywall]
Scams
The Telephone Is A Lifeline For Prison Families. And Calls Are Outrageously Expensive by Bonita Tenneriello and Elizabeth Matos (WBUR)
With extreme price points for basic services, Massachusetts is considering laws that would prevent prisons from gouging the families of incarcerated persons. [Link]
Everything Old Is New Again: The Continuing Saga Of Bioscam Nanoviricides (Buyers Strike)
A stock that has long been known as a biotech fraud has come surging back in the wake of 2019-nCov’s surge across China. [Link]
Read Bespoke’s most actionable market research by joining Bespoke Premium today! Get started here.
Have a great weekend!
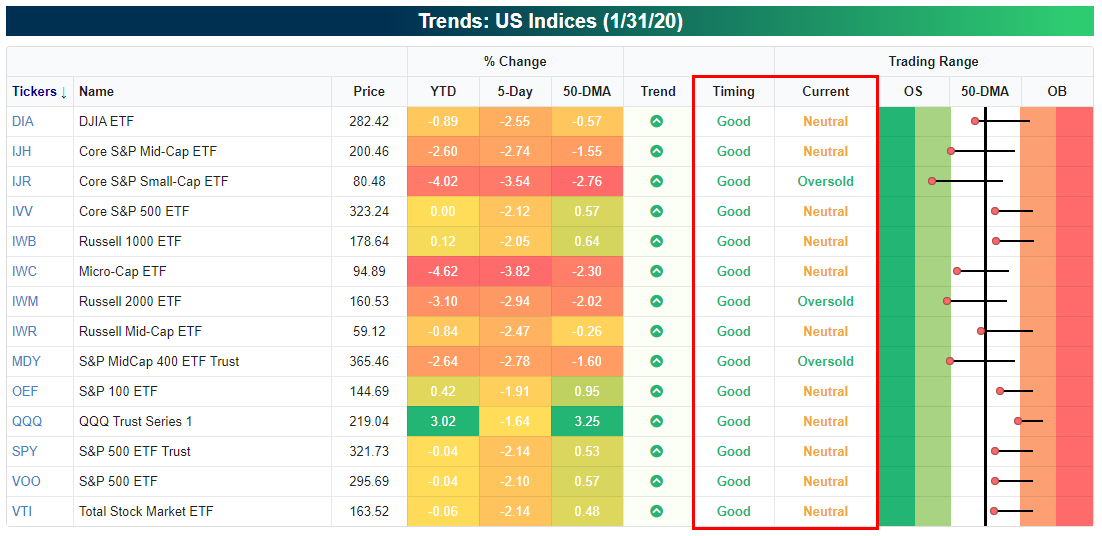
What a Difference Two Weeks Makes!
The tone of the market sure did change over the last two weeks! The image below is from our Trend Analyzer screen of US indices as of the close two weeks ago on 1/17. Heading into that weekend, the major US averages were all at ‘Overbought’ or ‘Extreme Overbought’ levels, and while their Trend ratings were all positive, the Timing scores for nearly all of them was ‘Poor’.

Fast-forwarding to the present, it’s a completely different picture for the major US indices. Today, not a single one of the major US index ETFs headed into this weekend overbought at overbought levels, and a few of them are even oversold. Here’s the silver lining, though; since all of their Trend ratings are still positive, their timing scores all rank as ‘Good’. While not what we would classify as a ‘Perfect’ set up right now, for investors who have been waiting for a pullback, the window is starting to open. Start a two-week free trial to Bespoke Institutional for full access to our Trend Analyzer tool, so you can track the key trends of major indices and individual stocks.
The Bespoke Report — 1/31/19
This week’s Bespoke Report newsletter is now available for members.
Along with in-depth analysis of the 2019-nCov outbreak and its potential impact on global financial markets, this week we take a deep dive into recent earnings results from a dozen or so of the largest US companies (see pages 29-31). We also provide our thoughts on potential 2020 election outcomes and whether the market is not yet pricing in the real possibility of socialist Senator Bernie Sanders winning the nomination.
In this week’s Bespoke Report, we provide our take on everything going on in the market this week, including the action in international markets, global economics, and cross-asset price action. To read the report and access everything else Bespoke’s research platform has to offer, start a two-week free trial to one of our three membership levels. You won’t be disappointed!

The Closer: End of Week Charts — 1/31/20
Looking for deeper insight on global markets and economics? In tonight’s Closer sent to Bespoke clients, we recap weekly price action in major asset classes, update economic surprise index data for major economies, chart the weekly Commitment of Traders report from the CFTC, and provide our normal nightly update on ETF performance, volume and price movers, and the Bespoke Market Timing Model. We also take a look at the trend in various developed market FX markets.

The Closer is one of our most popular reports, and you can sign up for a free trial below to see it!
See tonight’s Closer by starting a two-week free trial to Bespoke Institutional now!
Bespoke Market Calendar — February 2020
Please click the image below to view our February 2020 market calendar. This calendar includes the S&P 500’s average percentage change and average intraday chart pattern for each trading day during the upcoming month. It also includes market holidays and options expiration dates plus the dates of key economic indicator releases. Start a two-week free trial to one of Bespoke’s three research levels.
