Reservations. It’s What’s for Dinner.
When it comes to monthly retail sales, one trend we have highlighted repeatedly over the years is the shift in American shopping habits from bricks and mortar to online establishments. Ten years ago, General Merchandise retailers accounted for 14.4% of total retail sales. At the same time, online sales which had already risen sharply over the years accounted for only 7.9% of total sales. Fast-forwarding to the present, online retail has continued to surge at the expense of General Merchandise retailers (among others) and now ‘clicks’ account for a larger share of total sales than ‘bricks’.
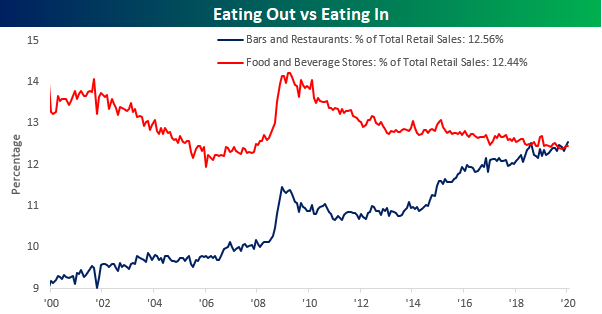
Another less discussed trend in American shopping habits is the shift from eating at home to eating out. While there was a time not so long ago when going out for dinner was considered a treat, for a lot of Americans today, home-cooked meals are out of the norm. The chart below shows the historical share of total sales that both Food and Beverage Stores and Bars and Restaurants have accounted for since 2000. Twenty years ago, sales at Food and Beverage stores accounted for 13.3% of total sales while Bars and Restaurants accounted for just 9.2%. As Americans increasingly eat out, though, sales at Bars and Restaurants have risen to 12.56% while sales at Food and Beverage Stores have been drifting lower to the current level of 12.44%. While both groups have been moving back and forth in recent months regarding which one has the lead in total share, in January, Bars and Restaurants overtook Food and Beverage Stores by the widest margin on record (0.12 percentage points). In most modern houses, the idea of a formal dining room has become obsolete, and who knows, the way things are going now, in fifty years the idea of a kitchen may sound just as quaint. Start a two-week free trial to Bespoke Institutional to access our interactive economic indicators monitor and much more.
Bespoke CNBC Appearance (2/14)
Bespoke co-founder Paul Hickey appeared on CNBC’s Squawk Box this morning to discuss the current market and the roads to 30K for the Dow and 10K for the Nasdaq. To view the segment, please click on the image below. Start a two-week free trial to Bespoke Institutional to access our interactive economic indicators monitor and much more.

Bespoke Morning Lineup — 2/14/20 — Semis Nearly Automatic
See what’s driving market performance around the world in today’s Morning Lineup. Bespoke’s Morning Lineup is the best way to start your trading day. Read it now by starting a two-week free trial to Bespoke Premium. CLICK HERE to learn more and start your free trial.
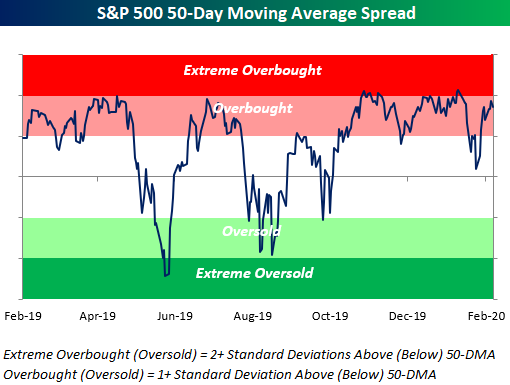
As shown below, the US equity market is entering the trading day in overbought (but not quite extreme) territory:
For a recap of all the latest on the coronavirus, earnings, and economic data, check out today’s Morning Lineup.

The Closer – Bounce, Valuations, EUR-Outta-Here – 2/13/20
Log-in here if you’re a member with access to the Closer.
Looking for deeper insight on markets? In tonight’s Closer sent to Bespoke Institutional clients, we begin by showing the bounce in more cyclical commodities and equities’ valuations. We also provide an update to EUR’s selloff before reviewing European stocks and their expected EPS over the next year. We then recap today’s 30 year bond auction. Turning to economic data, we review today’s inflation data.

See today’s post-market Closer and everything else Bespoke publishes by starting a 14-day free trial to Bespoke Institutional today!
Correction Come Down
In an earlier post, we detailed the improvements in AAII’s weekly sentiment survey. Another sentiment survey from Investors Intelligence also saw a substantial improvement in investors reporting as optimistic this week. The percentage of bullish newsletter writers in the Investors Intelligence survey rose 5.3 percentage points this week to 52.9%. That only brings it back to similar levels to last month, but it was also the largest week over week increase in bullish sentiment since a 5.4 percentage point increase in June of last year. A more notable move in this week’s survey was that of respondents looking for a correction. While there have been far higher readings over the past few years, similar to bullish sentiment, last week’s reading of just over 33% was the highest share of respondents expecting a correction since October. But as investors reassessed the negative implications of the coronavirus, this has come crashing down falling 5.4 percentage points week-over-week.

As shown below, while that 5.4 percentage point decline was far from the largest such decline in the history of the data going back to the late 1990’s (a 13.2 percentage point decline in June of 2012 holds that title), there have only been 29 other times that this reading on sentiment had fallen more than 5 percentage points in a single week. The most recent occurrence was in June of last year.

The performance of the S&P 500 following similar declines in ‘correction’ sentiment in the past has been mixed. While the S&P 500 has outperformed versus all other periods one week and 3 months later, one month, six months, and one year later have seen returns more inline or worse than other periods on a median and average basis. In other words, when fewer newsletter writers are looking for a correction or market pullback, better than average returns become slightly less likely. Start a two-week free trial to Bespoke Institutional to access our interactive economic indicators monitor and much more.

Sentiment Stays Afloat
Overnight news that showed the number of confirmed coronavirus cases has spiked sent a negative tone rolling through markets today, but generally speaking, sentiment surrounding the issue has improved which has been reflected in higher prices for risk assets. Given this, the percentage of respondents in AAII‘s weekly survey that have reported as bullish has risen to 41.33% from 33.87% last week. That 7.46 percentage point jump in bullish sentiment may sound like a lot but just one month ago bullish sentiment rose an even larger 8.76 percentage points to a similar reading of 41.83%. Though it has improved, bullish sentiment is not overly extended as it is still within its normal historical range albeit near the upper end of said range.

The rise in optimism came as bearish sentiment fell 8.82 percentage points to 26.4%. That was the largest decline in bearish sentiment since October when it fell 12.91 percentage points in one week. That comes as a reversal from the massive 12.09 percentage point spike in bearish sentiment only a couple of weeks ago which was the largest weekly increase in bearish sentiment since August.

While bearish sentiment is down, not all investors have immediately jumped aboard the bullish ship. An increased percentage of respondents considering themselves neutral also ticked higher this week rising to 32.27% from 30.91% last week. In spite of that increase in neutral sentiment, this week’s reading still stands in the 18th percentile of the past year’s readings. With neutral sentiment and bearish sentiment as low as they are, the general tone of sentiment continues to have a positive bias as investors have brushed off coronavirus concerns. Start a two-week free trial to Bespoke Institutional to access our interactive economic indicators monitor and much more.

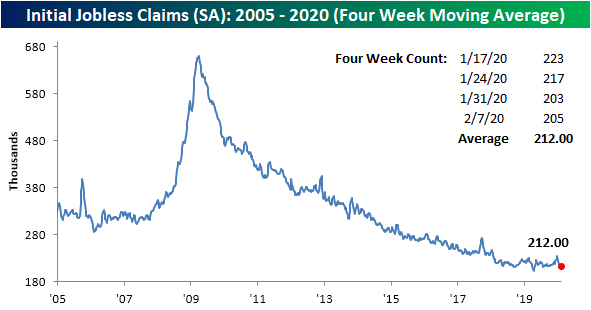
Claims Up But Still Low
Initial jobless claims this week rose slightly up to 205K from 203K last week which was the lowest reading this indicator had reached since its lows from last spring. While this week marked the first uptick in nearly a month, the actual reading was still well below estimates for an increase to 210K. This leaves jobless claims at the bottom of the past year’s range and still only 12K above its recent low of 193K from April of last year. In other words, this week’s increase was overall not that bad as claims still remain at very healthy levels.

The moving average, which helps to smooth out the week to week fluctuations of the high-frequency data, went unchanged this week at 212K. This is a result of this week’s 205K number replacing an equivalent reading from five weeks ago. That marks the first time that the moving average did not move up or down week-over-week since November of 2017. As with the unmanipulated data, although it is not quite there yet, the moving average is sitting at some of its lowest levels since April’s multi-decade lows.
Non-seasonally adjusted jobless claims continue to experience their seasonal decline following the peak that was put in place in the first weeks of the new year. Claims fell to 219K this week from 224.7K last week. That is the lowest level for non-adjusted claims for the current week of the year of the current cycle.

Continuing jobless claims, which are lagged one week from initial claims data, have also begun to tick lower recently after rising sharply in the past few months. This week’s reading fell from 1751K to 1698K which was larger than the expected reading of 1734K. This week’s drop also marked the first time since November that continuing claims fell below 1700K. Additionally, we recently have highlighted how continuing claims have begun to show persistent YoY increases over the past few months for the first time of the current cycle. Now, this is not a massively negative sign as such readings have been observed outside of recessionary periods in the past (like the early 2000s shown below), but it is something that raises a flag. The past few weeks have given some relief to this as continuing claims are beginning to tick lower year-over-year again as shown in the second chart below. Start a two-week free trial to Bespoke Institutional to access our interactive economic indicators monitor and much more.

Bespoke’s Morning Lineup – 2/13/20 – Better than Expected Economic Data
See what’s driving market performance around the world in today’s Morning Lineup. Bespoke’s Morning Lineup is the best way to start your trading day. Read it now by starting a two-week free trial to Bespoke Premium. CLICK HERE to learn more and start your free trial.
There’s a negative tone in global equity markets this morning following a surge in the reported cases of the coronavirus after the Chinese government instituted new reporting guidelines. Longer-term, we don’t expect last night’s uptick to have any meaningful impact on sentiment unless of course, it kicks off a new trend of higher reported cases. Given the fact that non-Hubei cases in China and cases outside China did not see a meaningful increase (chart below), though, suggests that we won’t see the number of reported cases increase.
In economic news, CPI was weaker than expected at the headline level (0.1% vs 0.2% m/m) and right in line with expectations at the core levels. Jobless Claims rose by 2K from 203K up to 205K, but that was actually lower than consensus expectations for an increase to 210K.
For a recap of all the latest on the coronavirus, earnings, and economic data, check out today’s Morning Lineup.

The Closer – Sentiment Carried Away, Flows, Treasury Data – 2/12/20
Log-in here if you’re a member with access to the Closer.
Looking for deeper insight on markets? In tonight’s Closer sent to Bespoke Institutional clients, we begin with a look at how EPS estimates have changed for large and small caps. We also show what the put-call ratio and ETF flows are indicating about sentiment. Expanding on this topic, we recap this week’s ICI fund flow data. Turning to economic data, we review today’s Treasury data on the deficit. We finish with our weekly review of EIA data.
See today’s post-market Closer and everything else Bespoke publishes by starting a 14-day free trial to Bespoke Institutional today!
Another “Delay” in the Value Trade
How many times over the last few years have you heard something to the tune of “The time for value stocks to outperform is now.” Well, we’re still waiting. The chart below shows the relative strength of the S&P 500 Value Index versus the S&P 500 Growth Index going back to 1995. A quick warning: if you have a sensitive stomach you may want to skip the chart altogether.

From 1995 right up to the bull market peak in 2000, value stocks couldn’t catch a break as they steadily underperformed growth stocks. Those were the days when Energy as a sector was ‘dead’ and investors couldn’t get enough of tech IPOs with trendy sounding names. The low for value stocks on a relative basis came on 3/27/00, and from there the reversal was swift. By April of 2001, value stocks had regained nearly all of the ground they lost relative to growth during the late 1990s. Unfortunately for investors in both types of strategies, the outperformance in value wasn’t the result of a monster rally, but instead a massive decline in growth stocks.
From April 2001 through late 2002, value stocks underperformed again as the Worldcom and Enron accounting scandals cast a pall over sectors like Telecom Services and Utilities – two sectors traditionally comprised predominantly by value stocks. As the dust settled on those two scandals, though, and the economy stabilized, value stocks rallied again as Energy, Financials, and Materials stocks boomed.
As the Financial sector began to unravel in 2007 and oil prices peaked in 2008, value stocks once again cratered relative to growth. Growth has maintained its lead over value ever since. Outside of some periods where value stocks briefly popped and strategist after strategist came out and said this time the rally is for real, growth stocks have left value stocks in the dust. Just last year, the underperformance of value stocks marked a major milestone as they took out their lows in relative strength versus growth stocks. While the S&P 500 Value Index saw a modest bounce towards the end of last year, any momentum it had has quickly been erased in 2020 as the ratio between it and the S&P 500 Growth index is now at fresh lows. Start a two-week free trial to Bespoke Institutional to access our full range of research reports and interactive tools.