Long-Term Treasuries Go Haywire
Take a good luck at today’s moves in long-term US Treasury yields, because chances are you won’t see moves of this magnitude again soon. Let’s start with the yield on the 30-year US Treasury. Today’s decline of 29 basis points in the yield will go down as the largest one-day decline in the yield on the 30-year since 2009. For some perspective, there have only been 25 other days since 1977 where the yield saw a larger one day decline.
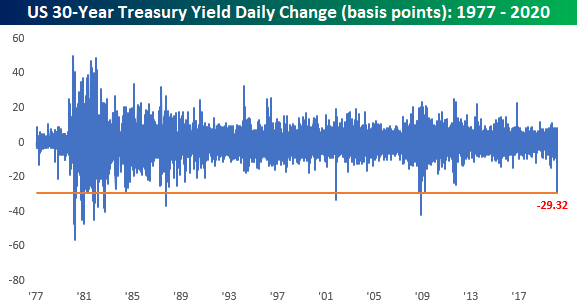
That doesn’t even tell the whole story, though. As shown in the chart below, every other time the yield saw a sharper one-day decline, the actual yield of the 30-year was much higher, and in most other cases it was much, much higher.

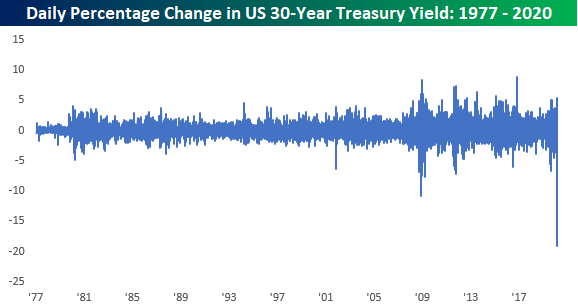
To show this another way, the percentage change in the yield on the 30-year has never been seen before, and it’s not even close. Now, before the chart crime police come calling, we realize showing a percentage change of a percentage is not the most accurate representation, but we wanted to show this for illustrative purposes only.
Finally, with long-term interest rates plummetting we wanted to provide an update on the performance of the Austrian 100-year bond. That’s now back at record highs, begging the question, why is the US not flooding the market with long-term debt? Start a two-week free trial to Bespoke Institutional for full access to our research and interactive tools.

Bespoke’s Morning Lineup – 3/6/20 – Corona Friday
See what’s driving market performance around the world in today’s Morning Lineup. Bespoke’s Morning Lineup is the best way to start your trading day. Read it now by starting a two-week free trial to Bespoke Premium. CLICK HERE to learn more and start your free trial.
With headlines likely to get worse before they get any better, investors are once again in no mood to buy equities heading into a weekend. Equity futures are down over 2% and getting worse as treasury yields sink like a stone. After breaking below 1% for the first time ever earlier this week, the yield on the 10-year is now at 0.72%.
Today’s Non-Farm Payrolls report for February came in extremely strong with headline payrolls coming in at 273K versus expectations for a gain of 175K. Unfortunately, all of this data is from early February, so no one is likely going to care.
Read today’s Bespoke Morning Lineup for the latest stock-specific news of note, updates on the coronavirus, and a recap of economic data coming out of Europe.

The price chart of Europe’s STOXX 600 is really something to behold. Less than a month after hitting 52-week highs, the index is now knocking on the door of 52-week lows. It’s rare enough to see this type of a reversal in an individual stock, but for a benchmark equity index of an entire continent, it’s nuts. With a decline of over 3% today, the STOXX 600 is now less than 2% from hitting that level. As we discussed in the Morning Lineup, this is just a further illustration of how before the coronavirus breakout started, the global economy was starting to accelerate.

The Closer – Plunging Rates, Glittering Gold – 3/5/20
Log-in here if you’re a member with access to the Closer.
Looking for deeper insight on markets? In tonight’s Closer sent to Bespoke Institutional clients, we review the continued decline in small caps relative to the S&P 500 and outperformance of momentum stocks relative to value stocks. Next, we review the rapid changes in financial stress indices from the St. Louis Fed and Goldman Sachs. We also show the gold market’s reaction. Turning to economic data, we review today’s manufacturing data and Bloomberg Consumer Comfort.

See today’s post-market Closer and everything else Bespoke publishes by starting a 14-day free trial to Bespoke Institutional today!
Newsletter Writers Turning Bearish
In an earlier post, we detailed how AAII’s weekly sentiment survey has shown respondents have become increasingly polarized taking bullish and bearish stances. Another sentiment survey of newsletter writers from Investors Intelligence, on the other hand, leans more distinctively bearish. This survey’s reading on bullish sentiment fell to 41.7% in the latest week which is the lowest reading since January of last year. Granted, at that time bullish sentiment reached much lower levels bottoming at 29.9%.

Meanwhile, bearish sentiment is at its highest level since March of last year. Like bullish sentiment, while it is at one of its highest levels in some time, it also topped out at much higher levels just over a year ago. Bearish sentiment peaked at 34.6% in the first week of January of 2019, 14.2 percentage points higher than current levels.

While the Investors Intelligence survey does not have a reading on neutral sentiment like AAII does, it does survey respondents for those “looking for a correction”. With the S&P 500 having fallen 12.76% from the February 19th closing high to Friday’s closing low, price action has met the definition of a correction and as such the number of respondents reporting that they are looking for a correction has surged to 37.9%. That is the highest reading since June of last year when it reached 38.8% and in the 93rd percentile of the past decade’s readings. Overall, bearish sentiment has generally taken over now which is positive from a contrarian’s position, but as recently as the past year, there is a precedent of it being even higher. Start a two-week free trial to Bespoke Institutional to access our interactive economic indicators monitor and much more.

Investors Polarized
Despite continued volatility for equity markets over the past week, bullish sentiment has picked back up this week, rising to 38.74% from 30.43%. Last week’s reading marked the lowest level for AAII’s reading on bullish sentiment since October, but this week’s 8.31 percentage point jump brings it right back into the middle of the past few years’ range and within one percentage point of the historical average of 38.08%.

While bullish sentiment is not at any sort of high or low, bearish sentiment has risen to a nearly equal reading of 39.64% which is the highest level since October when it was several percentage points higher in the mid-40s. This leaves bearish sentiment fairly elevated with regards to its historical average of 30.35% but not quite to any extreme degree (over one standard deviation above that average).

The same cannot necessarily be said for neutral sentiment which has now fallen over one standard deviation below its historical average. Neutral sentiment cratered 8.81 percentage points this week down to 21.62%. That is the lowest level, the biggest one week decline, and the first time it has fallen one standard deviation below its historical average since late December of 2018. If the choppy price action over the past week wasn’t enough confirmation, this sentiment data points to investors being increasingly polarized along the bullish and bearish lines.

Looking at past times that sentiment became similarly polarized, the bulls have tended to be on the right side of history. The table below shows past times since the beginning of the AAII survey that neutral sentiment was one standard deviation or more below its historical average while bullish and bearish sentiment were within normal ranges. As depicted, this is the first time that this has occurred since November of 2012 when each sentiment reading was within just a few tenths of a percentage point of current levels. Again, the performance of the S&P 500 following these sentiment readings has had a positive bias. Other than one week later which sees performance more inline with other periods, the S&P 500 has typically outperformed and has consistently traded higher. Start a two-week free trial to Bespoke Institutional to access our interactive economic indicators monitor and much more.

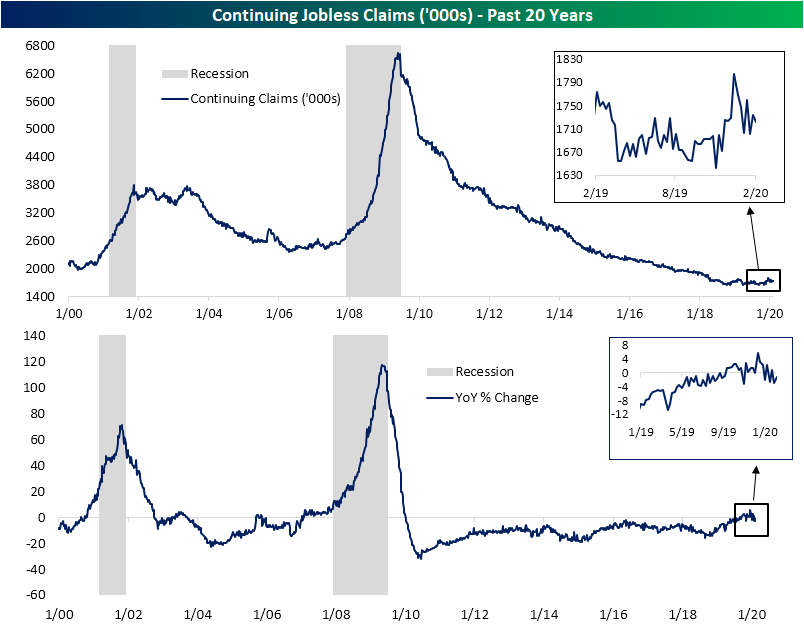
Jobless Claims Unfazed By Covid-19
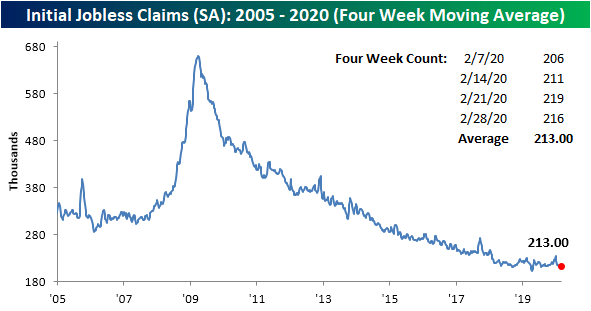
While schools are closing and events are being canceled as precautions to stem the spread of the coronavirus, initial jobless claims have yet to show any negative impact. Claims actually fell slightly this week down to 216K from 219K last week. That is about in line with expectations of a 215K print. Overall, claims still point to a healthy US labor market that has not seen any significant impacts from the coronavirus.

The recent multi-month low of 203K rolled off the four-week moving average this week, replaced by the higher 216K reading and caused the average to reach 213K. That is the highest level for the four week average since the week ending January 24th when it stood at 214.75K. That is also still well below the highs from late last year in the low 230K’s.
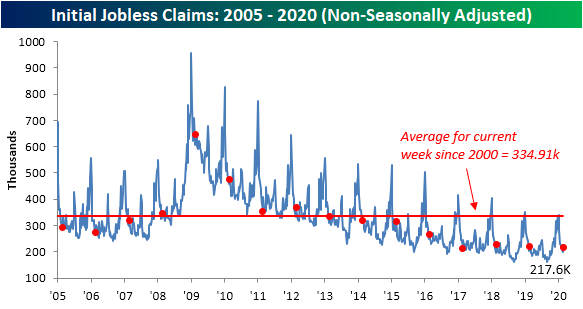
Non-seasonally adjusted (NSA) claims ticked higher by 18.3K this week to 217.6K. That leaves jobless claims slightly lower year-over-year and still far below the average for the current week of the year since 2000 as shown in the first chart below. Additionally, while the week to week fluctuations in the NSA number should not typically be given too much weight, we wanted to highlight that the week-over-week uptick in unadjusted claims was just about what could be expected for the current week of the year. As shown in the second chart below, the ninth week of the year has averaged an increase of 17.6K; similar to the actual change of 18.3K observed this week. In other words, before seasonal adjustment, this week’s increase likely has more to do with seasonality than any coronavirus effects.

While less timely given they are released at a one week lag to initial claims, continuing claims are also not showing any signs of stress from the coronavirus. It is quite the opposite actually. After showing frequent year-over-year increases over the past few months for the first time of the current economic cycle, this week marked the first back-to-back YoY declines since early September. While two weeks do not make a trend, that is a welcome improvement after the past few months. Start a two-week free trial to Bespoke Institutional to access our interactive economic indicators monitor and much more.
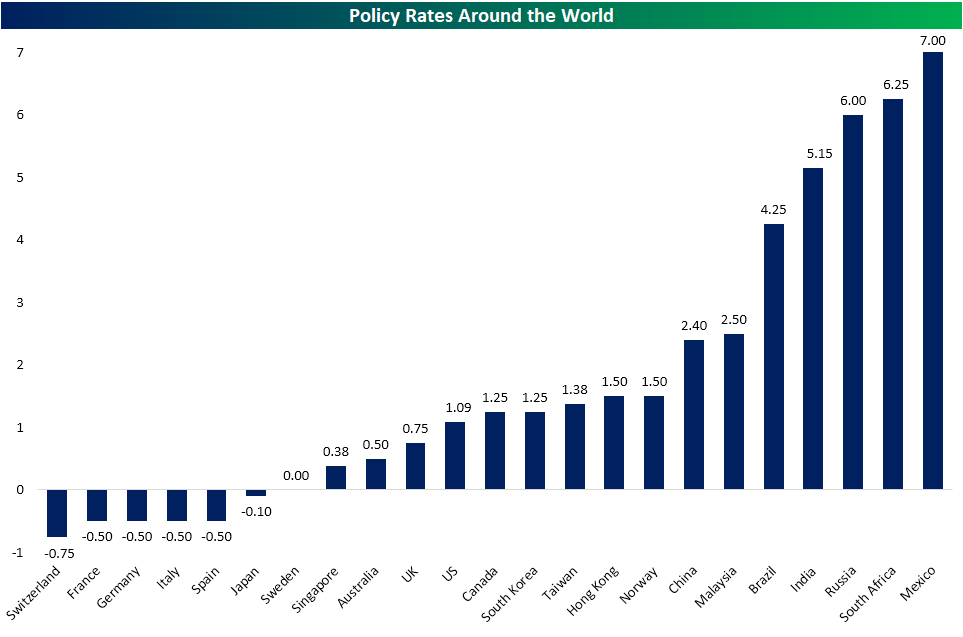
Central Banks Trim Around The Globe
In the wake of the coronavirus sparking growth concerns around the globe, central banks have stepped up to the plate through cutting rates. The chart below shows the countries in our Global Macro Dashboard that have cut their policy rates since our January 8th report, the day after the WHO identified Covid-19. Yesterday, the Bank of Canada cut its policy rate from 1.75% down to 1.25%; joining the Central Bank of Malaysia, the Fed, and subsequently Hong Kong in cutting rates by 50 bps. Singapore has come down slightly less by 43 bps. Australia, Brazil, Russia, South Africa, and Mexico have also cut rates by a quarter-point. Despite being patient zero and perhaps the country most affected by the virus, China has cut rates by just 10 bps; the least of any of the countries that have cut rates.

Even though it cut rates by 25 bps, Mexico still has the highest policy rate at 7% followed by South Africa (6.25%) and Russia (6%). While recent cuts have not sent any additional country’s policy rate into negative territory, the ECB countries, Japan, and Switzerland all have negative rates at the moment. As for the US, the effective Fed Funds rate is now at 1.09% which leaves it on the lower end of the range of policy rates which stand at 1.75% on average (median: 1.25%). Start a two-week free trial to Bespoke Institutional to access our Global Macro Dashboard and more.
Bespoke’s Morning Lineup – 3/5/20 – 52-Week High? In China?
See what’s driving market performance around the world in today’s Morning Lineup. Bespoke’s Morning Lineup is the best way to start your trading day. Read it now by starting a two-week free trial to Bespoke Premium. CLICK HERE to learn more and start your free trial.
Futures are sharply lower this morning, but not enough to erase all of yesterday’s gains. Jobless claims were just released and came in 1K higher than expectations (216K vs 215K). Given the weakness in equities, the yield on the 10-year is not surprisingly back well below 1.0%. A lot can change between now and the close, so we’ll see how the day shakes out as the number of cases rise, events get canceled, more schools close, and companies continue to lower guidance.
Read today’s Bespoke Morning Lineup for the latest stock-specific news of note, updates on the coronavirus, and a discussion of the latest proposed OPEC cuts in oil production.
US futures are lower, and the S&P 500 is already 7.5% from its record close in February. Don’t look now, but one major economy’s equity benchmark saw a 52-week high on a closing basis overnight, and it was China! China’s CSI 300 has now fully recovered all of its losses from the coronavirus outbreak after a 2.5% gain overnight. Now, before you dismiss it all as China propping up its market by prohibiting investors from selling, we would note that the US-based ETF that tracks the index (ASHR) also closed yesterday within 2.5% of its 52-week high. In other words, investors can freely buy and sell the Chinese market.

The US is another story. Equities are still sharply off their highs. Yesterday, we noted the emerging uptrend in both the S&P 500 and Russell 2000 on an intraday basis. One thing to note about yesterday’s rally is that for both indices, the market closed right before they were able to make a higher high. With both indices now poised to open sharply lower, the first important level to watch is yesterday’s low in the S&P 500 of roughly 3,033.

The Closer – A Second Bite at the 4% Apple – 3/4/20
Log-in here if you’re a member with access to the Closer.
Looking for deeper insight on markets? In tonight’s Closer sent to Bespoke Institutional clients, we take a look at the market reaction to today’s rate cuts and where equities stand relative to short term rates. We then take a look at the record low yields in the US and abroad. Next, we show just how much bonds have outperformed equities before reviewing credit markets. We finish by looking through derivative markets.
See today’s post-market Closer and everything else Bespoke publishes by starting a 14-day free trial to Bespoke Institutional today!
Bespoke’s Consumer Pulse Report — March 2020
Bespoke’s Consumer Pulse Report is an analysis of a huge consumer survey that we run each month. Our goal with this survey is to track trends across the economic and financial landscape in the US. Using the results from our proprietary monthly survey, we dissect and analyze all of the data and publish the Consumer Pulse Report, which we sell access to on a subscription basis. Sign up for a 30-day free trial to our Bespoke Consumer Pulse subscription service. With a trial, you’ll get coverage of consumer electronics, social media, streaming media, retail, autos, and much more. The report also has numerous proprietary US economic data points that are extremely timely and useful for investors.
We’ve just released our most recent monthly report to Pulse subscribers, and it’s definitely worth the read if you’re curious about the health of the consumer in the current market environment. Start a 30-day free trial for a full breakdown of all of our proprietary Pulse economic indicators.
