Bespoke’s Morning Lineup – 3/10/20 – Turnaround (For Now)
See what’s driving market performance around the world in today’s Morning Lineup. Bespoke’s Morning Lineup is the best way to start your trading day. Read it now by starting a two-week free trial to Bespoke Premium. CLICK HERE to learn more and start your free trial.
After starting the day limit down yesterday, futures were briefly limit up today but have pulled back a bit. Besides the deeply oversold readings in equities, a catalyst for the surge is the Administration’s promised “very dramatic” actions last night. The White House plans being floated by the President last night include a payroll tax cut and short-term expansion of paid sick leave. Full details are due later today.
For now, markets will continue to trade off fear and headlines, so expect more of the same in terms of volatility.
Read today’s Bespoke Morning Lineup for a discussion of the moves overnight and this morning, the latest updated figures on the coronavirus, and a recap of Asian and European markets.

Below is an update of our S&P 500 sectors and where they are trading relative to their trading ranges. Every sector is currently oversold, and the only sector that isn’t at ‘extreme’ levels is Utilities. Along with Utilities, the only two sectors not more than 3-standard deviations below their 50-DMA are Consumer Staples and Health Care.

The Closer – Manic Mondays – 3/9/20
Log-in here if you’re a member with access to the Closer.
Looking for deeper insight on markets? In tonight’s Closer sent to Bespoke Institutional clients, we recap today’s historic session in which the S&P 500 fell by its largest amount since the financial crisis. We show what stocks drove these declines before evaluating claims that low oil prices will be a good thing for the economy. We finish by looking at what weakness in energy means for credit markets.

See today’s post-market Closer and everything else Bespoke publishes by starting a 14-day free trial to Bespoke Institutional today!
A Day for the Decade
There have been bigger declines in the equity market throughout history, but not many. In fact, for the S&P 500 and many sectors, larger one-day declines haven’t been seen in at least a decade. The S&P 500 fell more than 7.5%, which was the largest one-day decline for the index since 12/1/08. After today’s drop, the US equity benchmark is down to its lowest level since June 3rd of last year.
In terms of individual sectors, ground zero for the market was the Energy sector. Going back to 1989 when daily data begins, today’s 20.1% decline was the largest one-day drop on record, and the index is now at its lowest level since August 2004. That’s not a typo! The only other sector that was down more than 10% today was Financials, which saw its largest one-day decline since 4/20/09 and is at its lowest level since Christmas Eve 2018. Industrials was another hard-hit sector today, and while it was down less than 10%, the 9.2% drop was still the largest one-day fall since at least 1989 and took the index to its lowest level since January 2019. Start a two-week free trial to Bespoke Institutional for full access to our research and interactive tools.


Wondering What Could Have Been
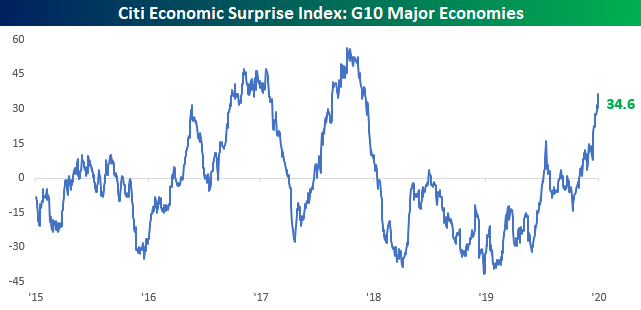
With major US averages down over 6% today and a US economic recession appearing all but certain, last week’s strong employment report for February was written off before it was even released. The employment report wasn’t the only strong economic data point that we have seen in recent weeks but was part of a bigger trend of improved economic data. Take the Citi Economic Surprise index for the United States. Ever since last December, the index has seen a sharp turn higher and in just the last several trading days broke out to its best levels since the end of 2017. Of course, all of this data is stale: it doesn’t account for the large shock to aggregate demand which is currently unfolding or is likely about to unfold via the Covid-19 virus and measures necessary to stop it. Some countries have already felt the pain: China was able to stop rapid spread of the virus by shuttering its economy almost entirely, while the Lombardy region of Italy has seen massive restrictions on travel, public gatherings, and other forms of economic activity too. Any kind of similar restrictions on US activity or even voluntary measures undertaken by individuals would make the post-crisis norm of 2% real growth a pipe dream for the middle of 2020.

The impact of reduced activity won’t show up in data for a couple of weeks, but it’s almost certain to drive down activity relative to expectations. It’s a shame, too: prior to Covid-19, the global economy looks to have turned a
corner and was accelerating sharply for the start of 2020 after Fed easing last year. The G10 major economy economic surprise index was at the highest level since the synchronized uplift in global growth which buoyed activity in 2017 as-of this morning, but thousands of Covid-19 cases across Western Europe and the rest of the world have completely flipped the global economy. For investors and economies alike, the data suggests that optimism from the start of the year would have been correct if not for the brutal impact of the coronavirus across the world over the last two months. Start a two-week free trial to Bespoke Institutional for full access to our research and interactive tools.
Country Stock Market Declines and YTD Change
As shown in the table below, the average decline from 52-week highs across 72 country stock markets now stands at -19.08% (in local currency). The decline in the US is now 17% from its 52-week high, which puts it in the better half in terms of price drop. Greece has fallen the most from its 52-week high at -37.52%, followed by Lebanon (-36.09%), Saudi Arabia (-32.84%), and Poland (-32.63%). Italy’s drop of 26.53% from its 52-week high makes it the worst performing G7 country, while Brazil has been the worst-performing BRIC country with a drop of 25.66%.
At the other end of the spectrum, China’s stock market is down 10.5% from its 52-week high, which makes it the best performing of any G7 or BRIC country. Start a two-week free trial to Bespoke Institutional for full access to our research and interactive tools.

Bespoke’s Morning Lineup – 3/9/20 – Saudis Go Scorched Earth
See what’s driving market performance around the world in today’s Morning Lineup. Bespoke’s Morning Lineup is the best way to start your trading day. Read it now by starting a two-week free trial to Bespoke Premium. CLICK HERE to learn more and start your free trial.
Sometimes, there’s not much you can say. US equity futures are trading limit down right now, but the S&P 500 ETF (SPY) is currently down 6.9%, which is a tenth of a percent from tripping the first 15-minute circuit breaker. As global concerns over the coronavirus weren’t damaging enough to economic activity, this weekend’s move by the Saudis to slash oil prices added just another boot on the neck of the economy. Moves that we are seeing right now in equities and other financial assets don’t come around very often, and while they are the result of developing economic conditions and uncertainty, the moves themselves will ultimately also have their own economic impacts.
Read today’s Bespoke Morning Lineup for a discussion of the moves overnight, the latest updated figures on the coronavirus, the Saudis scorched earth policy regarding oil prices, and how this will all impact the economy.
The price chart of Europe’s STOXX 600 is really something to behold. Less than a month after hitting 52-week highs, the index is now knocking on the door of 52-week lows. It’s rare enough to see this type of a reversal in an individual stock, but for a benchmark equity index of an entire continent, it’s nuts. With a decline of over 3% today, the STOXX 600 is now less than 2% from hitting that level. As we discussed in the Morning Lineup, this is just a further illustration of how before the coronavirus breakout started, the global economy was starting to accelerate.

Bespoke Brunch Reads: 3/8/20
Welcome to Bespoke Brunch Reads — a linkfest of the favorite things we read over the past week. The links are mostly market related, but there are some other interesting subjects covered as well. We hope you enjoy the food for thought as a supplement to the research we provide you during the week.
While you’re here, join Bespoke Premium for 3 months for just $95 with our 2020 Annual Outlook special offer.
Tech Wreck
Before Clearview Became a Police Tool, It Was a Secret Plaything of the Rich by Kashmir Hill (NYT)
The facial recognition application has driven concerns that law enforcement may misuse technology, but a bigger concern may be some of its most elite non-police customers. [Link; soft paywall]
Twitter is about to become an even bigger weapon of disinformation by Mark Wilson (Fast Company)
The social networking site is testing a feature that brings ephemerality to microblogging, echoing the sort of disappearing posts common to Snapchat or Instagram’s Stories. [Link]
Ebola
Democratic Republic of the Congo discharges last Ebola patient after 14 days without confirmed cases by Morgan Winsor (ABC)
While the Covid-19 pandemic is gripping attention, it would be easy to overlook the amazing news that the Democratic Republic of the Congo appears to have completely eliminated Ebola, with the last confirmed case discharged from hospital this week. [Link; auto-playing video]
Covid-19 Contingencies
I Lived Through SARS and Reported on Ebola. These Are the Questions We Should Be Asking About Coronavirus. by Caroline Chen (ProPublica)
A long Q&A about best practices and interpretation of data and advisories related to Covid-19, with detailed background and explanation. [Link]
Washington State risks seeing explosion in coronavirus cases without dramatic action, new analysis says by Helen Branswell (Stat News)
An analysis of viral genomes suggests that Covid-19 has been circulating in Washington State since January, and that the recent uptick in cases is about to surge dramatically. [Link]
Community Ties
In a disaster that calls for isolation, your community will help you survive by Alissa Walker (Curbed)
Under quarantine or just disrupted by social distancing, infectious disease outbreaks force vulnerable people to rely on their communities to support them. [Link]
How Working-Class Life Is Killing Americans, in Charts by David Leonhardt and Stuart A. Thompson (NYT)
Nobel Prize winners Anne Case and Angus Deaton detail the “deaths of despair” that are destroying communities across the US. [Link; soft paywall]
Covid Tech
Tim Cook and Apple Bet Everything on China. Then Coronavirus Hit. by Tripp Mickle and Yoko Kubota (WSJ)
Apple’s production of the world’s most popular tech products is dangerously reliant on China, with the company’s facilities and the companies that support them hyper-concentrated in the country. [Link; paywall]
The Coronavirus Is Forcing Techies To Work From Home. Some May Never Go Back To The Office. by Alex Kantrowitz (BuzzFeed)
A long-discussed shift towards remote work among tech workers may get a permanent nudge courtesy of widespread office closures designed to prevent spread of the virus. [Link]
Virus Quarantines in China Spur Tencent, NetEase Gaming Surge by Kamaron Leach and Sydney Maki (Bloomberg)
Daily average user counts have surged as Chinese consumers stay home but look for something to do, driving huge outperformance for gaming stocks in recent weeks. [Link; soft paywall, auto-playing video]
Quixotic Quests
The Miracle of Moving a Piano in New York City by Sophie Haigney (NYT)
A sort of strange New York story that makes the city what it is: incredibly challenging but filled with a can-do attitude that refuses to quit. [Link; soft paywall]
Market Mayhem
Stressed stock market may need to retest its lows before finding its footing in the coronavirus crisis by Michael Santoli (CNBC)
Equities and interest rates of plunged in response to the coronavirus, but what next for a tape that can’t seem to find a consistent bottom amidst heavy volatility? [Link]
Read Bespoke’s most actionable market research by joining Bespoke Premium today! Get started here.
Have a great weekend!
The Closer: End of Week Charts — 3/6/20
Looking for deeper insight on global markets and economics? In tonight’s Closer sent to Bespoke clients, we recap weekly price action in major asset classes, update economic surprise index data for major economies, chart the weekly Commitment of Traders report from the CFTC, and provide our normal nightly update on ETF performance, volume and price movers, and the Bespoke Market Timing Model. We also take a look at the trend in various developed market FX markets.
The Closer is one of our most popular reports, and you can sign up for a free trial below to see it!
See tonight’s Closer by starting a two-week free trial to Bespoke Institutional now!
It Doesn’t Get Much Worse Than This For Crude Oil
Crude oil prices are down close to 10% today in what is shaping up to be the worst day for crude oil since late 2014. That’s more than five years.

Today’s decline is pretty much a continuation of what has been a one-way trade for the commodity ever since the US drone strike on Iranian general Soleimani. The last time prices were this low was around Christmas 2018.

With today’s decline, crude oil is now off to its worst start to a year in a generation falling 32%. Since 1984, the only other year that was worse was 1986 when the year started out with a decline of 50% through March 6th. If you’re looking for a bright spot, in 1986, prices rose 36% over the remainder of the year. The only other year where crude oil kicked off the year with a 30% decline was in 1991 after the first Iraq war. Over the remainder of that year, prices rose a more modest 5%. Start a two-week free trial to Bespoke Institutional to access all of our research an interactive research tools.

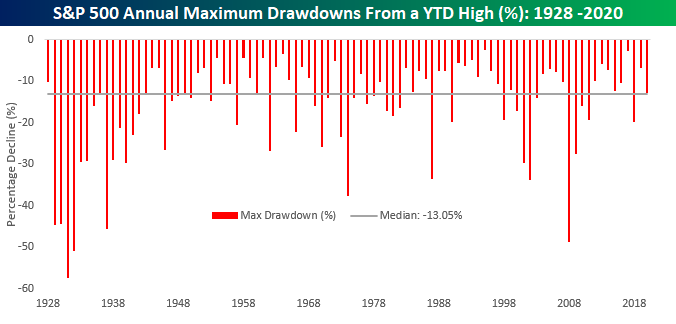
A “Run of the Mill” Drawdown
If you’re like us, you’ve heard a lot of people reference the recent equity declines as a sign that the market is pricing in some sort of Armageddon in the US economy. While comments like that make for great soundbites, a little perspective is in order. Since the S&P 500’s high on February 19th, the S&P 500 is down 12.8%. In the chart below, we show the S&P 500’s annual maximum drawdown by year going back to 1928. In the entire history of the index, the median maximum drawdown from a YTD high is 13.05%. In other words, this year’s decline is actually less than normal. Perhaps due to the fact that we have only seen one larger-than-average drawdown in the last eight years is why this one feels so bad.
The fact that the current decline has only been inline with the historical norm raises a number of questions. For example, if the market has already priced in the worst-case scenario, going out and adding some equity exposure would be a no brainer. However, if we’re only in the midst of a ‘normal’ drawdown in the equity market as the coronavirus outbreak threatens to put the economy into a recession, one could argue that things for the stock market could get worse before they get better, especially when we know that the market can be prone to over-reaction in both directions. The fact is that nobody knows right now how this entire outbreak will play out. If it really is a black swan, the market definitely has further to fall and now would present a great opportunity to sell more equities. However, if it proves to be temporary and after a quarter or two resolves itself and the economy gets back on the path it was on at the start of the year, then the magnitude of the current decline is probably appropriate. As they say, that’s what makes a market! Start a two-week free trial to Bespoke Institutional to access all of our research an interactive research tools.