Buffett Exits Stage Left
After over 55 years at the helm of Berkshire Hathaway (BRK/a), Warren Buffett will hand over control of the company he cobbled together to Greg Abel, ending an era of one of the most successful investment careers the world has ever known. Markets have known about this transition for just under seven months now, so the stock has had time to adjust to life without the cherry-coke drinking CEO.
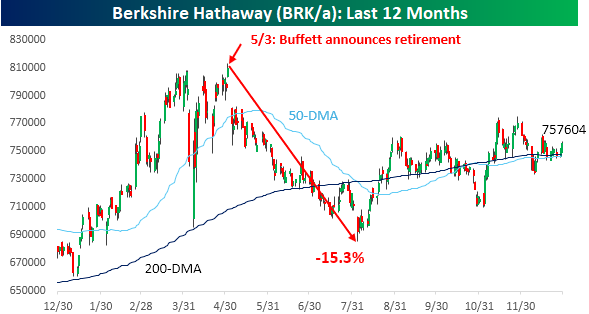
As shown in the chart below, when Buffett announced the transition at the annual meeting in May, the stock had closed at a record high the Friday before. When markets reopened the following Monday, the stock gapped lower and kept going down for the next three months, falling a total of 15.3%. The stock has since erased about half of those losses, but it remains well below its all-time high of $81,000 even as the S&P 500 closes out the year close to fresh highs.
Markets are forward-looking, but Buffett’s announcement in early May obviously caught the market off guard. While the announcement was a surprise, the fact that Buffett is in his mid-nineties and had just recently lost his long-time business partner, Charlie Munger, should have at least had the market starting to price in life without Buffett.
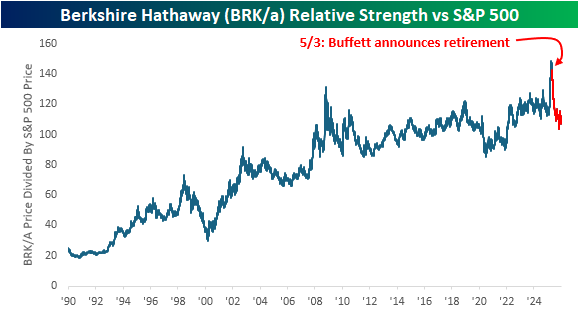
The reversal in Berkshire stock since Buffett made his retirement announcement is even more evident in terms of the stock’s relative strength versus the S&P 500. From 1990 through late 2008, the stock steadily outperformed the S&P 500 outside of a brief two-year period in the late 1990s during the dot-com bubble. After its peak relative strength reading in 2008, Berkshire basically moved sideways on a relative basis versus the market.
Earlier this year, the stock experienced a huge surge relative to the market during the tariff-tantrum and appeared on the verge of a new leg higher in relative strength. However, a combination of the market recovery and Buffett’s surprise announcement quickly reversed that strength.
The last time the stock’s relative strength versus the S&P 500 spiked in late 2008 and then quickly pulled back, it didn’t see those levels again for more than 15 years. With this latest reversal, will it take another 15 years before the stock makes another relative strength all-time high, or will the new CEO prove to be ready, willing and ‘Abel’ to lead the company in its next act?
Not a Bespoke client? We’d love for you to give our equity research platform, Bespoke Premium, a try. You can sign up for complimentary access for 14 days at this link to start receiving our daily emails today!

Bespoke’s Morning Lineup – 12/31/25 – The End
See what’s driving market performance around the world in today’s Morning Lineup. Bespoke’s Morning Lineup is the best way to start your trading day. Read it now by starting a two-week trial to Bespoke Premium. CLICK HERE to learn more and start your trial.
“For eleven months and maybe about twenty days each year, we concentrate upon the shortcomings of others, but for a few days at the turn of the New Year we look at our own. It is a good habit.” – Arthur Hays Sulzberger

Below is a snippet of commentary from today’s Morning Lineup. Start a two-week trial to Bespoke Premium to view the full report.
We made it (almost) through another year. Regardless of your political leanings, one thing we can all probably agree on is that with Trump as President, there’s never a dull moment. It was true in his first term, and the first year of his second term has proved no different. For all the uncertainty and volatility this year, though, it’s ironic to think that the VIX is closing out 2025 at under 15 and not far from its lows of the year!
Futures are lower this morning, with the S&P 500 indicated to open 0.21% lower while the Nasdaq is down 0.30%. A decline today would make it four straight days of declines to close out the year. Despite the gains for the year, 2025 is going out with a whimper.
Outside of equities, the 10-year US Treasury yield is down 2 bps to 4.1% while crude oil is fractionally higher. While most areas of the financial markets are quiet today, the real action is in metals, where the CME has lifted margin requirements for the second time in a week! Gold is down 1.6%, while silver is down over 8% and platinum is sinking over 10%. Silver is on pace for its fourth straight day of 7.5% daily moves, while platinum has had four straight 5%+ daily moves.
In Asia overnight, the Nikkei was closed, but most other indices in the region finished the last trading day of the year higher as China’s manufacturing PMI moved slightly back into expansionary territory (50.1) and came in higher than expected. In Europe, the tone is less positive this morning as the STOXX 600 trades down 0.2% in a session where many countries are closed for trading, and those that are open will close early. Technology is leading the losses with a decline of 0.6%.
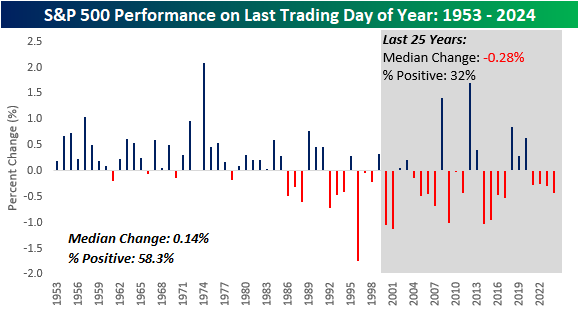
Equities are on pace to close out the last session of the year with losses, and that’s a trend that has become increasingly common in recent years. The chart below shows the S&P 500’s historical performance on the last trading day of the year since 1953. The S&P 500’s median performance has been a gain of 0.14% with positive returns 58.3% of the time.
While the long-term performance has been positive, more recent returns have been weaker. If the S&P 500 finishes lower today, it would be the fifth straight year that the index traded lower on the last session of the year, and that would be the longest streak since at least 1953. Besides just the last four years, though, the pattern of the last trading day of the year has been lower. Since 2000, the S&P 500’s median change on the last trading day of the year has been a decline of 0.28%, with gains less than a third of the time. If there’s any consolation for bulls, in years when the S&P 500 was up over 15% YTD heading into the final session of the year, the median gain on the final day has been a gain of 0.29%, with gains 64% of the time, while in all other years, the median gain was just 0.5%.
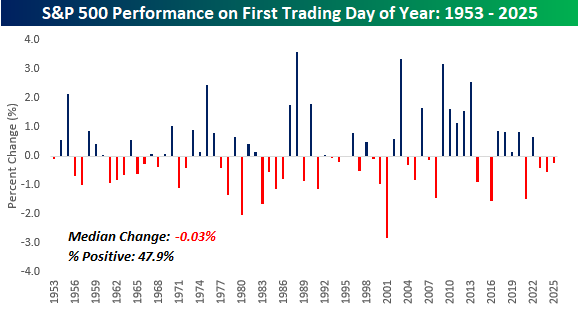
When we turn the calendar to 2026 on Friday, market performance on the first trading day of the year hasn’t been great either. Since 1953, the S&P 500’s median change to start a new year was a decline of 0.3% with gains just under half of the time. The equity market has also traded lower on the first trading day of the year in each of the last three years and four of the last five. Maybe the best idea is to take off until Monday!
The Closer – Fixed Income Year in Review, Inside After Outside – 12/30/25
Log-in here if you’re a member with access to the Closer.
Looking for deeper insight into markets? In tonight’s Closer sent to Bespoke Institutional clients, we begin with a recap of fixed income markets in 2025 (pages 1 – 4). We then show the lack of volatility in today’s session (page 5) before closing out with an update on home prices and the Dallas Fed’s service activity data (page 6).
See today’s full post-market Closer and everything else Bespoke publishes by starting a 14-day trial to Bespoke Institutional today!
2025 Triple Plays “Kings”
Along with our 2025 Stat Sheet and our 2026 Annual Outlook highlighting the pros and cons for the US equity market heading into the new year, we’ve also published a new Triple Play Report featuring the stocks that reported the most earnings triple plays in 2025.
Roughly 8% of the 8,000+ quarterly earnings reports from stocks this year were “triple plays.” What is a triple play? When a stock reports quarterly earnings, it registers a “triple play” when it beats analyst EPS estimates, beats analyst revenue estimates, and raises forward guidance. We coined the term back in the mid-2000s, and you can read more about it at Investopedia.com.
Of the more than 400 stocks that reported earnings triple plays this year, there were just 15 that reported triple plays on all four of their quarterly reports in 2025. We take a look at triple-play trends in 2025 and discuss each of the 15 stocks that reported four triple plays this year in this report.
You can read our 2025 Triple Play “Kings” report and our 2026 outlook pieces by signing up for any of our three membership levels. Enter the coupon code “OUTLOOK” at checkout for a 20% discount on your first charge. You can review our membership levels here to help make your decision.
Bespoke Newsletter Monthly Payment Plan
Bespoke Newsletter Annual Payment Plan
Bespoke Premium Monthly Payment Plan
Bespoke Premium Annual Payment Plan
Bespoke All Access (Bespoke Institutional) Monthly Payment Plan
Bespoke All Access (Bespoke Institutional Annual Payment Plan

Bespoke’s Morning Lineup – 12/30/25 – An Island of Volatility in Metals
Before getting to this morning’s pre-market analysis, be sure to watch this CNBC segment with Bespoke’s Paul Hickey discussing the market’s set-up heading into 2026.
See what’s driving market performance around the world in today’s Morning Lineup. Bespoke’s Morning Lineup is the best way to start your trading day. Read it now by starting a two-week trial to Bespoke Premium. CLICK HERE to learn more and start your trial.
“I wake up every day and I can’t wait to go to work, and that’s a gift. Not too many people have the opportunity to feel that way.” – Tiger Woods
Below is a snippet of commentary from today’s Morning Lineup. Start a two-week trial to Bespoke Premium to view the full report.
On another likely quiet day for the US markets, futures are lower, but no major index is indicated to open down more than 0.05%, so it wouldn’t take more than a sneeze to flip things around to the positive side. In most other areas of the market, current action is also subdued as treasury yields, crude oil, and crypto assets are all modestly higher. The one area that remains volatile is in the metals markets, as gold is up nearly 2%, while silver is up over 7% and platinum is up over 5%. We saw big negative reversals in these markets yesterday, so if you’re a bull on the sector, you’re breathing a sigh of relief today.
It will be a somewhat busy day for data today as we’ll get the weekly ADP Employment, FHFA House Price Index, and the Chicago PMI for December. The latter report always seems to be negative these days, but expectations are already low at 39.5. In addition to these three reports, we’ll also get the minutes from the December Fed meeting.
In Asia overnight and Europe this morning, it was a tale of two markets as Asia was mostly lower while Europe experienced broad-based gains.
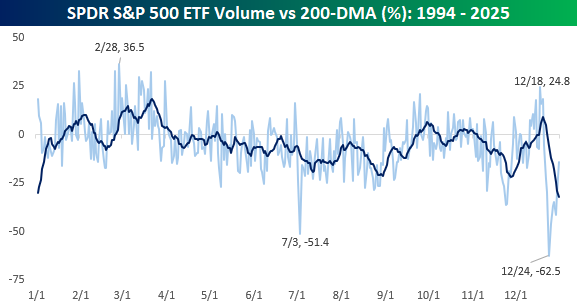
We’re obviously in one of the least volatile periods of the year for stocks, and the chart below illustrates that trend. When it comes to the daily volume in the SPDR S&P 500 ETF (SPY) relative to its 200-DMA, Christmas Eve ranks as the day with the least volume of any day of the year, when the median daily volume has been 62.5% below its 200-DMA. The next closest day in terms of low volume is July 3rd, when the median daily volume has been 51.4% below its 200-DMA. It makes sense that these two days would be quiet, given that they precede holidays, but they’re also both days when the market closes early, so the window for trading is shorter.
What was surprising about this chart is when the high-volume days tend to occur. With September and October being the most volatile months of the year, you would expect to see volume spikes during those months as well. While volume tends to come in above average during the fall, the period of highest volume relative to the 200-DMA occurs in late February and March.
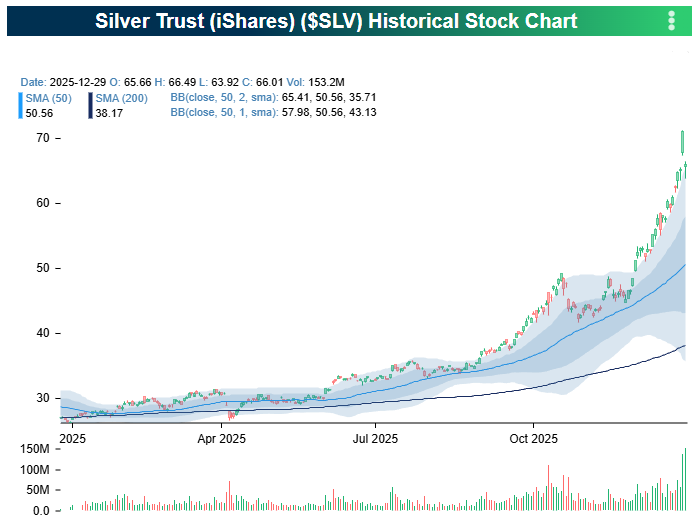
One area of the market where volumes weren’t light yesterday was in the commodities market, and more specifically, Silver. The iShares Silver Trust (SLV) had its highest volume day since February 2021, and after hitting a record high last Friday, plunged over 7%, forming a massive island reversal. As shown in the chart below, the gaps between last Friday’s trading range and the day before (Thursday) and the day after (Monday) were extremely wide, with more than a full percentage point separating the sessions on both sides.
The Closer – FX Review, Five Fed – 12/29/25
Log-in here if you’re a member with access to the Closer.
Looking for deeper insight into markets? In tonight’s Closer sent to Bespoke Institutional clients, after last week’s recap of commodities in 2025, we give a review of currency markets (pages 1 – 3). We also check up on our Five Fed Manufacturing Composite (page 4).
See today’s full post-market Closer and everything else Bespoke publishes by starting a 14-day trial to Bespoke Institutional today!
Bespoke’s Morning Lineup – 12/29/25
Before getting to this morning’s pre-market analysis, be sure to watch this CNBC segment with Bespoke’s Paul Hickey discussing the market’s set-up heading into 2026.
See what’s driving market performance around the world in today’s Morning Lineup. Bespoke’s Morning Lineup is the best way to start your trading day. Read it now by starting a two-week trial to Bespoke Premium. CLICK HERE to learn more and start your trial.
“Investors should purchase stocks like they purchase groceries, not like they purchase perfume.” – Benjamin Graham
Below is a snippet of commentary from today’s Morning Lineup. Start a two-week trial to Bespoke Premium to view the full report.
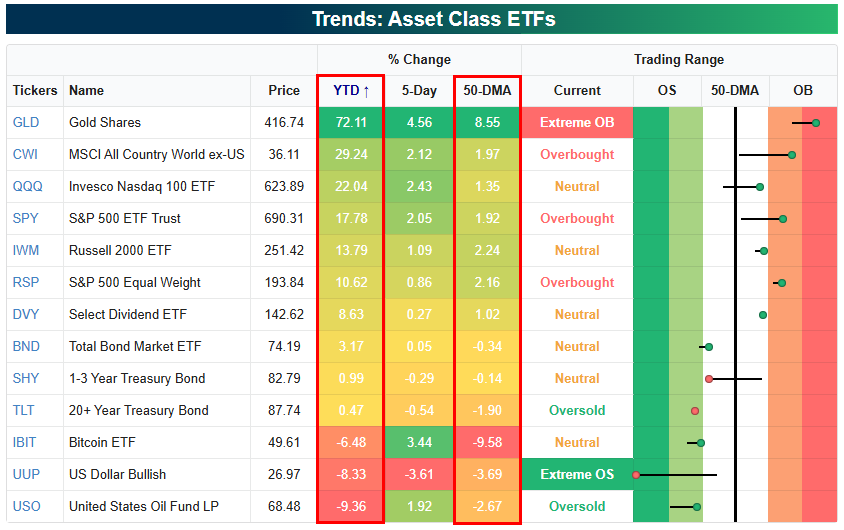
With just three trading days left in the year, below are a number of snapshots from our Trend Analyzer tool highlighting where various asset classes, sectors, and large-cap stocks stand on a year-to-date basis and relative to their 50-DMAs.
Gold (GLD) is now easily the top performing major asset class in 2025 with a 70%+ gain. The next-best is the “rest of world” equity market with the all country ex US ETF (CWI) up 29.2% YTD. The Tech-heavy Nasdaq 100 (QQQ) ranks third with a 22% gain.
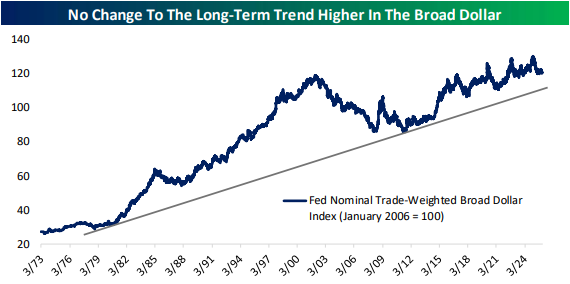
There are three key asset classes in the red this year: Bitcoin (IBIT), the dollar (UUP), and oil (USO).
Of the ETFs shown, the dollar (UUP) is the most oversold heading into year end, while gold (GLD) is the most overbought.
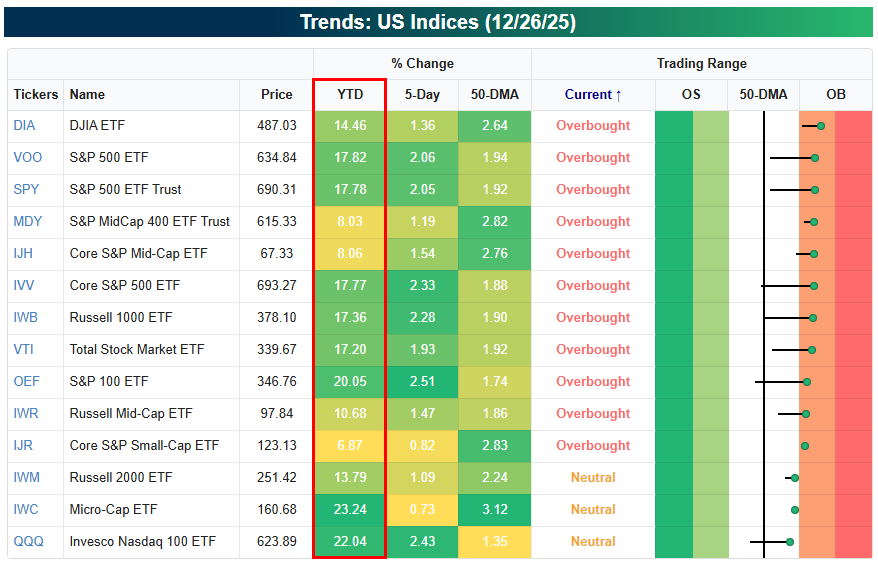
Looking at major domestic equity index ETFs, mid-caps have been “mid” in 2025 with only single-digit gains, while large-caps are up closer to 20%. Heading into 2026, every single index ETF shown is above its 50-DMA, with the large majority overbought.
Brunch Reads – 12/28/25
Welcome to Bespoke Brunch Reads — a linkfest of some of our favorite articles over the past week. The links are mostly market-related, but there are some other interesting subjects covered as well. We hope you enjoy the food for thought as a supplement to the research we provide you during the week.
Gulags Go Global: When Aleksandr Solzhenitsyn published The Gulag Archipelago on December 28, 1973, it was the first time the full scale and structure of the Soviet forced-labor camp system was laid out in a single work. The book was assembled over more than a decade, drawing on Solzhenitsyn’s own years in labor camps and exile, and written accounts and interviews from more than 200 other former prisoners. Because possession of the manuscript inside the USSR would have put others at risk, it was secretly copied, hidden, and eventually smuggled to the West, where it was published after Soviet authorities learned of its existence.
The book traces how arrests were carried out, how interrogations worked, how sentences were assigned, and how the camps functioned economically and politically. Solzhenitsyn argues that the Gulag was not an abuse of the Soviet system but an essential part of it, supplying labor, enforcing obedience, and eliminating perceived threats.
The Soviet government responded quickly. The book was banned, denounced as anti-Soviet propaganda, and in early 1974, Solzhenitsyn was arrested, stripped of his citizenship, and deported from the country. In the West, The Gulag Archipelago became a central reference point in discussions about communism and the Soviet state, especially among academics and political commentators who had previously downplayed or questioned reports of mass repression.

Food & Restaurants
Alcohol consumption falls to record low in Britain (Financial Times)
Drinking in the UK keeps trending lower, with the average adult now having the fewest weekly drinks on record, driven by higher costs, health awareness, and an aging population. People aren’t quitting alcohol altogether, but they’re just drinking less often and spending more per drink, which is helping producers offset weaker volumes. [Link]
Continue reading our weekly Brunch Reads linkfest by logging in if you’re already a member or signing up for a trial to one of our two membership levels shown below! You can cancel at any time.

Whose Bubble Is It Anyway?
Plenty of ink has been spilled in the last year about the current AI Boom and whether it’s actually an “AI Bubble.”
The current bull market for US stocks began on 10/12/22 based on the standard 20% rally/decline threshold. After a nasty bear market from the first trading day of 2022 through the 10/12/22 closing low, the current bull has seen the S&P rally 103% on a total return basis. The Tech/AI-heavy Nasdaq is up even more with a total return of 132.3% over the same time frame.
After the rally we’ve seen in the precious metals in the last couple of months, though, traders in the space must be looking at the AI Boom and thinking “hold my beer.”
Below is a look at the performance of the S&P 500, the Nasdaq Composite, and gold, silver, and platinum since the current bull market for stocks began on 10/12/22.
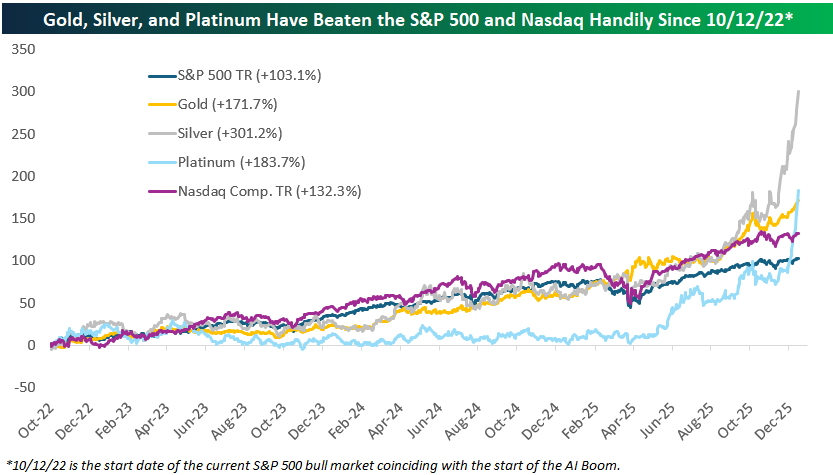
As shown, gold is now up 171.7%, platinum is up 183.7%, and silver is up just over 300%! All three metals have now easily beaten the stock market during the AI Boom.
A doubling of the major indices over a 3+ year time frame certainly qualifies as a strong bull market, and it’s hard to argue that valuations aren’t a bit lofty. But if the current AI-driven bull market for stocks is a “bubble,” then certainly what we’ve seen in precious metals lately qualifies as well.
Ironically, many bears that call the AI trade a speculative bubble also recommend increasing exposure to gold and other precious metals, but that kind of rationale gets more difficult now that the metals trade has gone even more parabolic than stocks!
Not a Bespoke client? We’d love for you to give our equity research platform, Bespoke Premium, a try. You can sign up for complimentary access for 14 days at this link to start receiving our daily emails today!
Magnificent Metals
The last couple of weeks have been historic for metals. From the close on 12/10 through the pre-market, the various ETFs tied to gold, silver, platinum, and palladium have surged anywhere from 6.8% for gold (GLD) to 44.5% for platinum (PLTM). The magnitude of gains in such a short period of time is practically unheard of.
To put some perspective on the moves, the table below lists the top-performing stocks in the S&P 500 since the close on 12/10. All 14 stocks listed have had double-digit percentage moves. Surprisingly, the three biggest gainers have all been cruise lines with Norwegian Cruise Line (NCLH), Carnival (CCL), and Royal Caribbean (RCL) rallying between just under 13% to just over 20%. As impressive as those gains are, though, based on where the metals ETFs are trading this morning, Platinum (PLTM), Palladium (PALL), and Silver (SLV) have all seen larger gains, and if they were S&P 500 stocks, they would rank as 1, 2, and 3, respectively. Platinum is up more than twice as much as the S&P 500’s top-performing stock (NCLH)! Even gold, with its 6.82% gain, would rank as the 43rd top-performing stock in the S&P 500. Is it the Mag 7 or the Mag Metals?

