Bitcoin Morning Strength
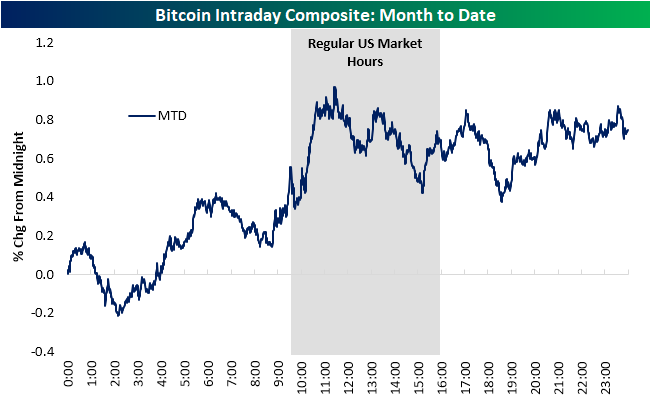
Alongside other risk assets rebounding to start the week, Bitcoin prices are approaching $74K, which is the highest price point since early February. Bitcoin and other cryptocurrencies differ from traditional assets in that they trade around the clock. In the charts below, we show an intraday composite for Bitcoin over the full course of a day over various time frames. These charts show Bitcoin’s average price movement throughout the 24-hour trading day over the time frames shown.
As shown below, Bitcoin has averaged around a 0.75% daily gain so far in March, with the bulk of that strength occurring in morning trading. In fact, Bitcoin has averaged around a 0.5% gain on the day heading into the US equity market open (9:30 AM ET) thanks to an early morning rally, and it has continued to rally towards a 1% gain by late morning. After peaking just before noon, Bitcoin has traded sideways all afternoon and night.
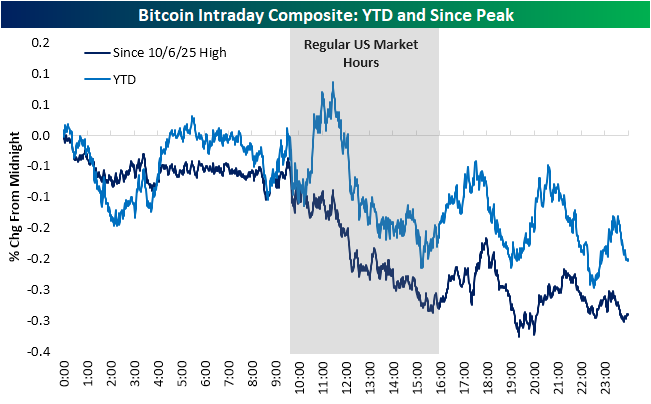
Bitcoin’s recent strength throughout the day is the opposite of what has been observed since the high in Bitcoin last fall. Generally speaking, throughout Bitcoin’s current drawdown, it has traded flat in the early morning hours and then lower throughout the US equity market trading day.
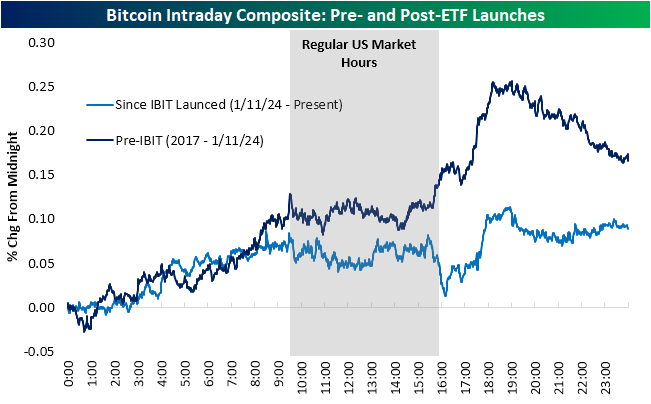
As shown below, Bitcoin has become less volatile as it has matured and especially since the latest waypoint of institutional adoption when spot ETFs garnered approval in early 2024. From 2017 up until early 2024 when the first spot Bitcoin ETFs were approved, Bitcoin generally traded higher throughout the trading day save for during regular US trading hours when price action was more flat in addition to declines late at night. Since spot ETFs like the iShares Bitcoin ETF (IBIT) were approved, though, price action has changed. Again, morning trading has been solid and even neck in neck with the intraday composite from before ETF approval. Likewise, during regular trading hours, Bitcoin price action has been largely uneventful, that is until the end of the day. Whereas previously the close of regular market hours saw Bitcoin ramping higher, since ETFs were approved, the end of the equity trading session has seen steep declines.
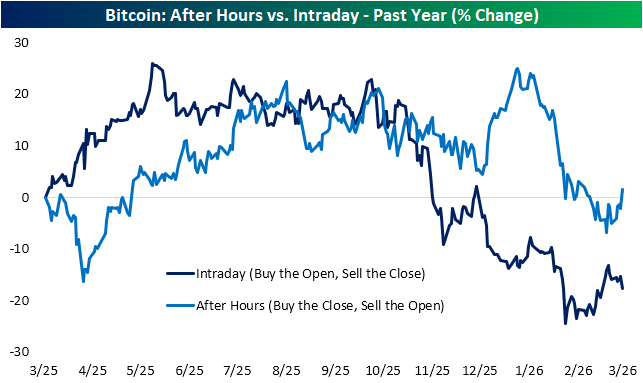
As we have done with the S&P 500 (SPY) in the past, below we show the performance of two hypothetical strategies of ownership. The first would be to buy bitcoin and only hold during regular US equity market hours (buy the open, sell the close) while the other would be the reverse of only owning outside of regular trading hours (buy the close, sell the open). As we discussed above, throughout various periods, Bitcoin performance was stable at best when stocks, bonds, and commodities are trading hands. Given this, only owning Bitcoin during regular market hours over the past year would have been the losing strategy, resulting in a 17% loss. The opposite strategy hasn’t exactly been a huge winner, but it at the moment it would still have resulted in modest gains. We would note that in the past two weeks, the two lines have begun to move in opposite directions. That dynamic was also prevalent from mid-December through the first week of the new year too.
Like this analysis? Join our premium members by starting a trial today! Click below for details on how to sign up:

Bespoke’s Morning Lineup – 3/16/26 – Crude Gives Equities a Break
See what’s driving market performance around the world in today’s Morning Lineup. Bespoke’s Morning Lineup is the best way to start your trading day. Read it now by starting a two-week trial to Bespoke Premium. CLICK HERE to learn more and start your trial.
“Philosophy is common sense with big words.” – James Madison

Below is a snippet of commentary from today’s Morning Lineup. Start a two-week trial to Bespoke Premium to view the full report.
It’s been a tough few weeks for equities. After months of trading in a sideways range, the war in Iran has put an added weight on the bearish side of the scale, pushing stocks lower. All of the major US indices are below their 50-DMAs, and the 200-DMAs are now starting to come into play as well. The short-term key has been and will continue to be oil prices. With no spike this morning, equities are taking the opportunity to rally, and we’ve been picking up steam as the morning drags on. The S&P 500 is on pace to gap up 0.75% as the open, while the Nasdaq is up closer to 1%. Now, let’s see if the gains can hold!
Outside of equities, treasury yields are falling with the 10-year yield down 5 bps to 4.24%, and crude oil falls almost 2% to just under $97 per barrel. Gold prices are down just over 1% and barely hanging on to $5,000, while bitcoin is up nearly 3% and above $73K.
Asian stocks were flat to higher to start the week on the optimism that oil prices didn’t spike more after the weekend. Japanese stocks traded down 0.1% while China was down 0.8%. Hong Kong, India, and South Korea, however, all rallied more than 1%. The declines in China came despite better-than-expected February data for Industrial Production, Retail Sales, and Fixed Investment.
European stocks have taken a more muted start to the week. The STOXX 600 is down 0.1% while Germany is up 0.3% and Italy drops 0.3%. It will be a busy week for central banks on the continent as the ECB, BoE, and SNB all have meetings.
It’s a relatively busy day for economic data this morning, with the Empire Manufacturing report for March hitting the tape at 8:30, followed by Industrial Production and Capacity Utilization at 9:15. Homebuilder sentiment will come out at 10 AM. Another area of focus today will be on Nvidia (NVDA) as CEO Jensen Huang will give the keynote speech at his company’s GTC conference at 2 PM Eastern. Looking ahead, the Fed will announce its latest policy decision on Wednesday.
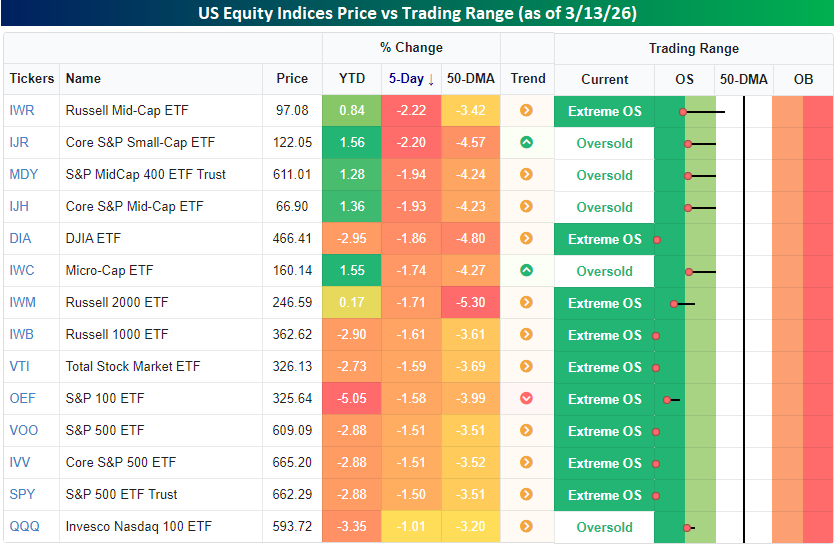
The S&P 500 has declined for four straight weeks now, but still hasn’t even declined 5% from its closing high in late January, so while it’s been a slump, it could be worse. Even with the relatively modest declines, as we discussed in Friday’s Bespoke Report, it still finds itself in what we consider ‘extreme’ oversold levels as it closed more than two standard deviations below its 50-DMA. Along with the S&P 500, the majority of other US index ETFs also finished off last week in extreme oversold territory, and the ones that aren’t are still in oversold territory.
Last week, there was a little bit of rotation in the market where the indices that had been performing the best YTD (small and mid-caps) experienced the largest declines, while large caps, which had been the weakest, were down less. It’s all relative, though, as even the best-performing US indices last week were still down over 1%.
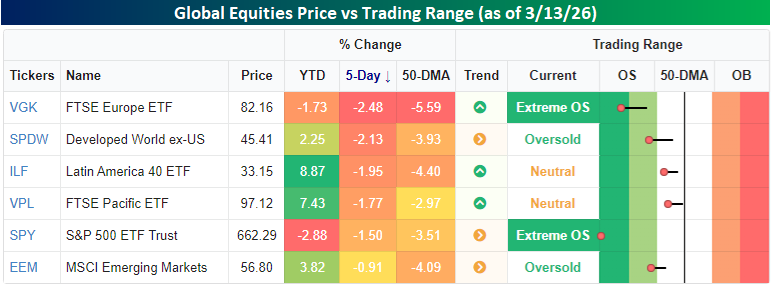
Similar to the relative outperformance of large caps versus small caps last week, US stocks outperformed their global peers once again last week, further digging out of their relative hole on a YTD basis. While the S&P 500 was down 1.5%, European stocks traded down by 2.5% last week, putting them into ‘extreme’ oversold territory with the US. The only areas of the world not oversold heading into the new week are Latin America (ILF) and Asia Pacific (VPL).
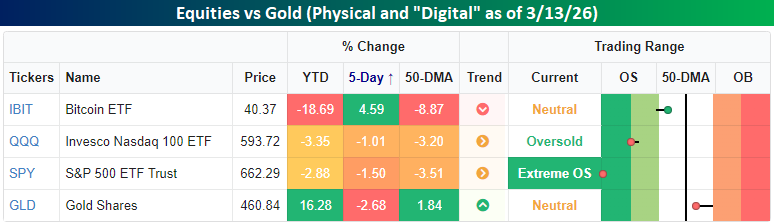
With equities under pressure, investors must be taking shelter in the safety of gold, right? Not really. Physical gold hit a speed bump last week, falling more than 2.5%. Despite the decline, though, it’s still up over 16% YTD and above its 50-DMA, so don’t shed too many tears for the gold bugs. One area of surprising strength last week was in Bitcoin (IBIT). While it’s still down close to 20% this year, it managed to rally more than 4.5% last week. As they say, even a broken clock is right twice a day.
Brunch Reads – 3/15/26
Welcome to Bespoke Brunch Reads — a linkfest of some of our favorite articles over the past week. The links are mostly market-related, but there are some other interesting subjects covered as well. We hope you enjoy the food for thought as a supplement to the research we provide you during the week.
Beware the Ides of March: On March 15, 44 BC, known in the Roman calendar as the Ides of March, Roman dictator Julius Caesar was assassinated by a group of senators inside the Theatre of Pompey in Rome. Caesar had risen to unmatched power after years of civil war and had recently been named dictator for life, alarming members of the Roman elite who feared the Republic was giving way to monarchy. Led by conspirators including Marcus Junius Brutus and Gaius Cassius Longinus, roughly 60 senators surrounded Caesar during a Senate meeting and stabbed him more than twenty times in one of history’s most famous political assassinations.
The conspirators believed Caesar’s death would restore the Roman Republic, but the opposite happened. His assassination plunged Rome into another round of civil wars that ultimately ended the Republic altogether. Within a few years, Caesar’s adopted heir, Augustus, consolidated power and established the Roman Empire. The betrayal on the Ides of March later became legendary through William Shakespeare’s play Julius Caesar.

Markets & Investing
Inside one of the wildest days the oil market has ever seen (Financial Times)
Oil traders faced one of the most chaotic sessions in the market’s history as Brent crude swung from about $119 to $84 in a single day amid escalating Middle East tensions and changing political signals. The extreme volatility forced market makers to widen spreads dramatically and left some traders scrambling to hedge or exit positions, with reports of massive losses and even entire trading teams being fired after getting caught on the wrong side of the moves. [Link]
Continue reading our weekly Brunch Reads linkfest by logging in if you’re already a member or signing up for a trial to one of our two membership levels shown below! You can cancel at any time.

Bespoke’s Consumer Pulse Report – March 2026
Bespoke’s Consumer Pulse Report is an analysis of a huge consumer survey that we run each month. Our goal with this survey is to track trends across the economic and financial landscape in the US. Using the results from our proprietary monthly survey, we dissect and analyze all of the data and publish the Consumer Pulse Report, which we sell access to on a subscription basis. Sign up for a 30-day free trial to our Bespoke Consumer Pulse subscription service. With a trial, you’ll get coverage of consumer electronics, social media, streaming media, retail, autos, and much more. The report also has numerous proprietary US economic data points that are extremely timely and useful for investors.
We’ve just released our most recent monthly report to Pulse subscribers, and it’s definitely worth the read if you’re curious about the health of the consumer in the current market environment. Start a 30-day free trial for a full breakdown of all of our proprietary Pulse economic indicators.

The Bespoke Report – 3/13/26 – A Sell-Off So Steep, Investors Won’t Sell
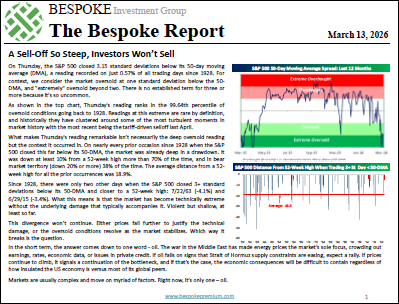
To read our weekly Bespoke Report newsletter and access everything else Bespoke’s research platform offers, start a two-week trial to Bespoke Premium. It was another eventful week in the market as we witnessed an extraordinary divergence between the S&P 500’s extreme oversold reading despite its relatively close proximity to all-time highs. This divergence won’t continue. Either prices fall further to justify the technical damage, or the oversold conditions resolve as the market stabilizes. Which way it breaks is the question. In this week’s Bespoke Report, we discuss the main factor(s) facing the market and put some of the recent moves into perspective.

Bespoke’s Morning Lineup – 3/13/26 – Tempting Fate
See what’s driving market performance around the world in today’s Morning Lineup. Bespoke’s Morning Lineup is the best way to start your trading day. Read it now by starting a two-week trial to Bespoke Premium. CLICK HERE to learn more and start your trial.
“Don’t let what you cannot do interfere with what you can do.” – John R. Wooden
Below is a snippet of commentary from today’s Morning Lineup. Start a two-week trial to Bespoke Premium to view the full report.
The market has one more day to salvage what’s been a negative week for stocks, and so far, it’s making a valiant effort. Futures on the S&P 500, Nasdaq, and Dow are all up 0.39%. With today being both Friday the 13th and the last day of trading into a weekend, it’s surprising to see equities catching a bid. Treasury yields are modestly lower, with the 10-year yield at 4.25%, and oil prices are down 2% to $93.50 per barrel. Gold prices are also pulling back, but Bitcoin is trading up close to 3% and above $72K.
Asian stocks ended what was already a down week on a negative note. The Nikkei was down over 1%, which took its weekly decline to over 3%, while China finished the week with a 0.7% decline, and India was down over 5%. Higher oil prices are a major pain point for the Asian economy, so the longer the Strait of Hormuz remains cut off, the more pressure it will put on these economies.
Equity performance has been more muted in Europe. The STOXX 600 is little changed for both the day and week, and no major index in the region is up or down more than 0.5% on the day. Industrial Production for January fell 1.5% versus expectations for an increase of 0.6%. Weaker growth, coupled with increasing inflationary pressures from rising energy prices, is the type of cooking markets would prefer not to see on the menu.
The economic calendar is jam-packed this morning with most of the reports (Personal Income, Personal Spending, GDP, PCE, Durable Goods) hitting the tape as we send this out, but at 10 AM Eastern, we’ll also get Michigan Confidence and JOLTS.
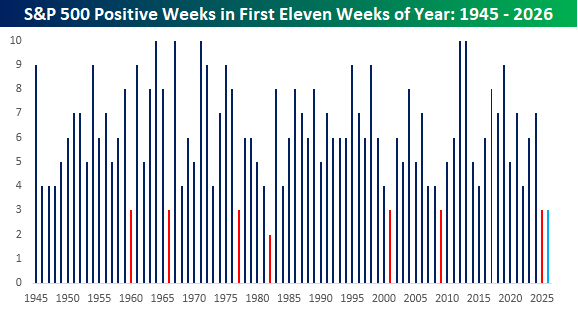
With the S&P 500 down 1% on the week heading into today, we’re on pace for the eighth negative week in the first eleven weeks of the year. With just three positive weeks, it’s been one of the weakest starts to a year for the S&P 500 in the post-WWII period. If the S&P 500 doesn’t rally more than 1% today, it will be the eighth year since 1945 that it has had three or less positive weeks to start a year. Ironically, last year also started weak, and while the market remained shaky through early April, it ended up being a good year. Before last year, the last time the year started out this inconsistently was in 2009, and the only year where there were fewer positive weeks to start a year was in 1982.
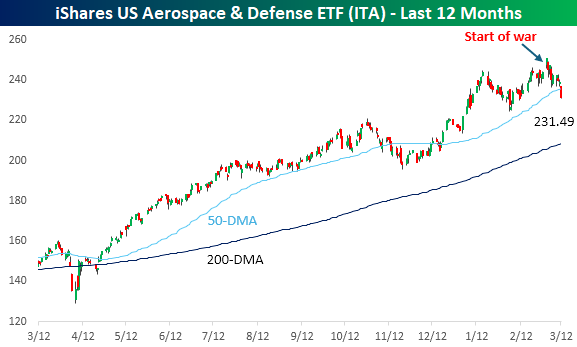
Two groups you would expect to benefit from the war in the Middle East are energy and defense stocks. Right out of the playbook, Energy stocks have rallied since the war broke out, but defense stocks have taken a sell-the-news response.
The chart below shows the performance of the iShares US Aerospace and Defense ETF (ITA) over the last year. While the ETF has surged over the last 12 months, it has struggled since the first missiles were fired. While ITA gapped up the Monday after markets reopened for trading after the war started, it’s been drifting lower ever since. Yesterday, it closed below its 50-DMA for the first time this year, and as Bloomberg noted in a news story overnight, the ETF had the largest outflow of assets in its history yesterday. Understandably, investors would take profits after the rally of the last year, but it’s interesting to see it follow the opposite path of Energy stocks.
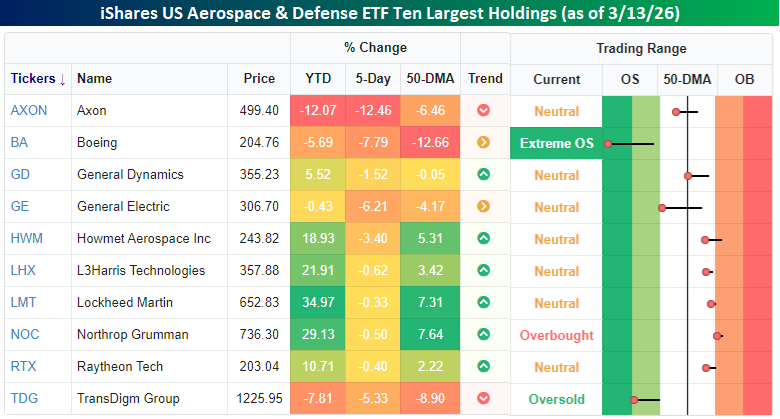
Below, we show the ten largest holdings in the ITA ETF and where each one closed relative to its trading range yesterday. Over the last week, all ten stocks are lower and some by a lot. General Electric (GE) and Boeing (BA) are the ETF’s two largest holdings, and both stocks are down more than 6% in the last week alone. For BA, that decline has taken it more than 12% below its 50-DMA and into ‘extreme’ oversold territory (2+ standard deviations below 50-DMA).
The Closer – Retail Teeter, Fertilizer, Trade – 3/12/26
Log-in here if you’re a member with access to the Closer.
- Retail flows and options volumes have moderated in the past year.
- US based fertilizer prices have now risen 29% MTD thanks to the closure of the Strait of Hormuz.
- The December 2026 Fed Funds rate implied by futures markets is now at the highest level since February of last year.
See today’s full post-market Closer and everything else Bespoke publishes by starting a 14-day trial to Bespoke Institutional today!
Positive Sentiment Streak at an End
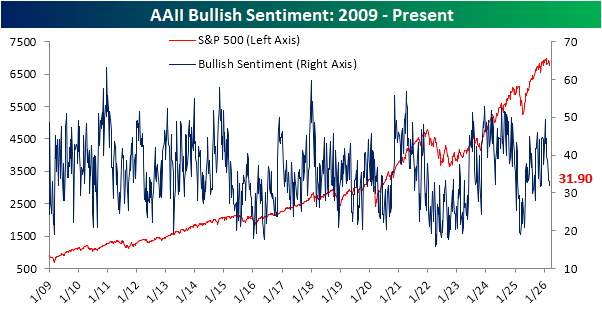
This week’s sentiment gauges saw some big moves. As we noted in last night’s Closer, the Charles Schwab (SCHW) Schwab Trading Activity Index, or STAX for short, experienced a near record increase in February. Meanwhile, other weekly sentiment gauges have deteriorated. The AAII survey is a prime example, as bullish sentiment fell to 31.9% this week. That is the sixth consecutive weekly decline, bringing bullish sentiment to the lowest level since the week of 11/13.
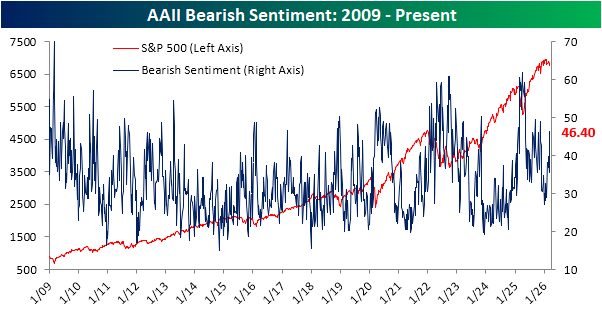
That drop in bulls was met with a double-digit percentage point surge in bears. Bearish sentiment leaped from 35.5% last week, a one-month low, to 46.4% today. That is the highest reading for bears since the week of 10/16 and the largest one-week increase since November.
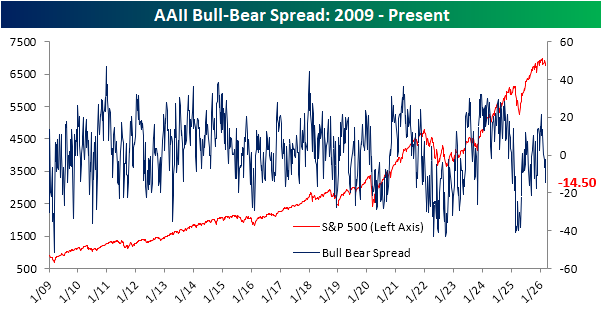
Put together, the bull-bear spread has now been negative (meaning there are more bears than bulls) for the fourth week in a row. The 12.1 point drop this week was the biggest WoW decline since the week of 11/13, and the spread is also the lowest since that same week.
In other words, the AAII survey has taken a decisively negative tone partway through the second week of conflict with Iran. Likewise, the same can be said for other surveys, such as the NAAIM Exposure Index and the Investors Intelligence survey. The former showed active managers reporting as the least aggressively long since the final week of last April during the tariff-tantrum. Meanwhile, bulls dropped below 50% in the Investors Intelligence survey for the first time since November. Putting it all together, our Sentiment Composite is back to negative territory following over six months of positive readings.
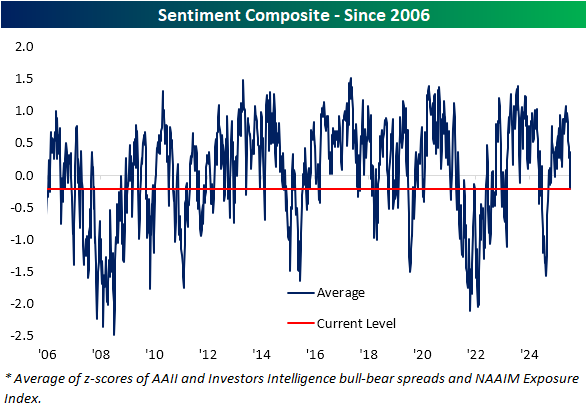
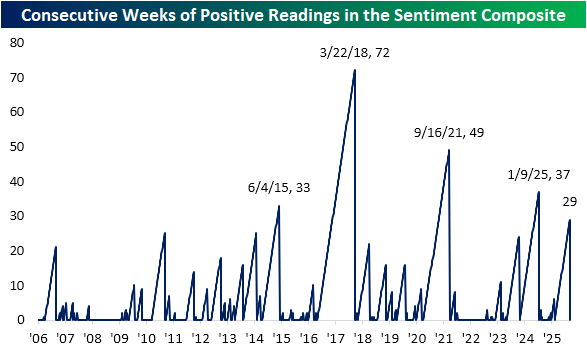
As shown below, this week snapped a streak of 29 consecutive weeks of positive readings in the sentiment composite. With the streak over, it ends as the fifth-longest streak on record.
Like this analysis? Join our premium members by starting a trial today! Click below for details on how to sign up:
Q4 2025 Earnings Conference Call Recaps: Dick’s Sporting Goods (DKS)
Bespoke’s Conference Call Recaps use AI to summarize lengthy earnings calls. The commentary below is AI-generated and then edited by Bespoke for quality control. As always, none of these summaries should be construed as recommendations to buy or sell any securities, and investors should do their own research and/or consult with a financial professional before making any investment decisions.
Our latest recap available to Bespoke subscribers covers Dick’s Sporting Goods’ (DKS) Q4 2025 earnings call.
![]()
Dick’s Sporting Goods (DKS) is one of the largest sporting goods retailers in the US, selling athletic footwear, apparel, equipment, and outdoor gear through stores and digital channels. The company serves athletes, teams, and casual sports enthusiasts while increasingly positioning itself at the intersection of sports and culture. Its growing ecosystem includes experiential retail concepts like House of Sport, youth sports platform GameChanger, and a retail media network that connects brands directly with athletes and fans. Management highlighted steady consumer demand and strong product momentum across footwear, apparel, and hardlines, with Q4 comparable sales up 3.1% on top of a 6.6% comp last year, producing a nearly 10% two-year stack. Executives emphasized that shoppers are still spending on innovation and premium launches, especially in running, basketball, and women’s sports, while major events like the 2026 World Cup are expected to support demand. The biggest focus remains the turnaround of Foot Locker following its acquisition, where DKS is implementing its “Fast Break” merchandising reset, removing roughly 30% of unproductive SKUs and testing store redesigns that are generating strong comps. Meanwhile, experiential formats like House of Sport and Fieldhouse continue to expand, and digital platforms such as GameChanger and the Dick’s Media Network are emerging as new engagement and advertising channels. The company guided to 2%–4% comps in 2026 with Foot Locker expected to inflect around back-to-school. DKS shares opened 4.6% higher on 3/12 after reporting EPS and revenue beats…
Continue reading our Conference Call Recap for DKS by becoming a Bespoke Institutional subscriber. You can sign up for Bespoke Institutional now and receive a 14-day trial to read our newest Conference Call Recap. To sign up, choose either the monthly or annual checkout link below:
Bespoke’s Morning Lineup – Homebuilders Yield to the Treasury Market
See what’s driving market performance around the world in today’s Morning Lineup. Bespoke’s Morning Lineup is the best way to start your trading day. Read it now by starting a two-week trial to Bespoke Premium. CLICK HERE to learn more and start your trial.
“Great things are not accomplished by those who yield to trends and fads and popular opinion.” – Jack Kerouac
Below is a snippet of commentary from today’s Morning Lineup. Start a two-week trial to Bespoke Premium to view the full report.
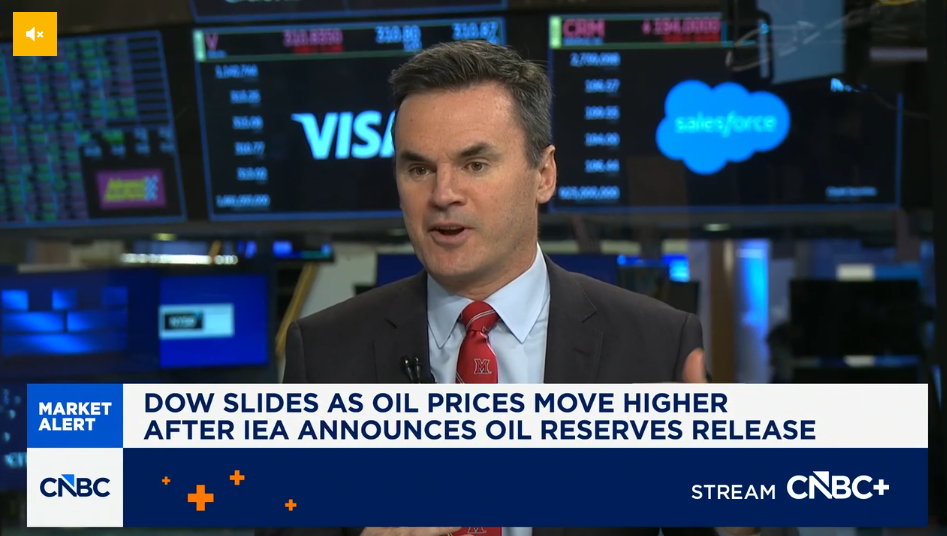
Paul Hickey appeared on CNBC’s Money Movers yesterday to discuss the moves in the energy market and their impact on the equity market. To view the segment, click on the image below.
After a mixed session yesterday where the Nasdaq finished up 8 basis points (bps) while the S&P 500 fell 8 bps, US futures are firmly lower this morning, with the S&P 500 and Nasdaq both indicated to open down by about 35 bps. The primary culprit is crude oil, where prices are up over 5% and back above $90 as Iran stepped up attacks on tankers in the Persian Gulf. Energy Secretary Chris Wright was also just on CNBC and noted that the US is not yet ready to escort tankers through the Strait of Hormuz, but could be mobilized later this month. As long as the bottlenecks around the Strait continue, oil prices will remain elevated, raising the risk that the conflict makes its mark on the economy.
With crude oil prices rising, treasury yields are higher again as investors focus on the potential inflationary impacts. Gold prices are essentially flat, silver is up 2%, and Bitcoin is down fractionally but still above $70K.
Stocks were down across the board in Asia overnight, as the Nikkei was down 1.0%, while China’s Shanghai Composite was only down 0.1%, and the Kospi fell 0.5%. Relative to the last two weeks, it was a muted session! Given the spike in crude oil prices and the region’s dependence on energy imports, you could make the argument that it could have been worse.
In Europe, equities are also taking the overnight spike in crude oil prices in stride. The STOXX 600 is down just 0.4%, while Germany is fractionally higher. We’re also starting to see impacts of the conflict showing up in corporate results as UK travel firm On the Beach lowered guidance, citing a sharp slowdown in travel bookings for locations in the Eastern Mediterranean.
On the economic calendar this morning, we just had jobless claims, Building Permits, and Housing Starts at 8:30. Initial claims came in 2K lower than expected, while continuing claims were 1K higher, so from this perspective at least, the labor market remains very well behaved. With respect to the housing numbers, permits were lower than expected (1376K vs 1410K) while starts were much higher than expected (1487K vs 1341K), although much of the strength was due to multi-family units.
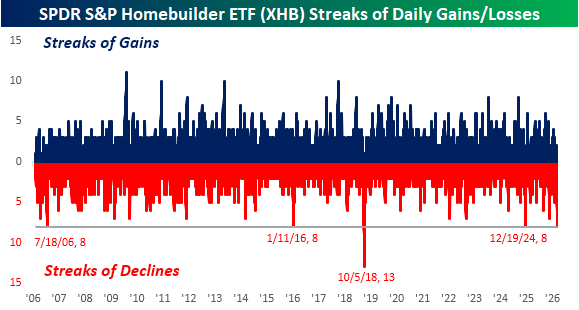
With treasury yields moving higher, it’s been a rough month for homebuilder stocks. The SPDR S&P Homebuilder ETF closed at $121.36 on 2/13, but has since declined more than 15% through yesterday’s close. Those highs in February were enough to push the group to 52-week highs, but the gains for 2026 quickly evaporated, and it’s now close to testing support at the $100 level.
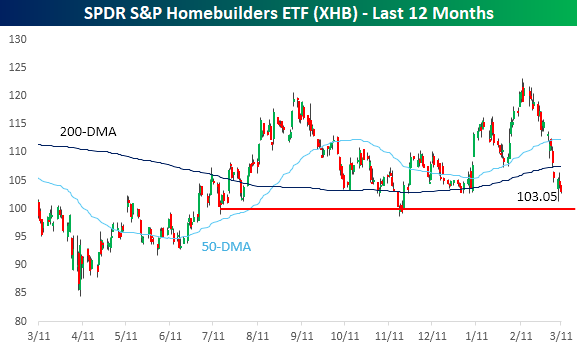
Part of that 15% decline since the February highs includes what is now an eight-day losing streak, which is tied for the longest losing streak in the ETF’s entire history. The last time there was a streak this long was over a year ago in late 2024, and the only longer streak was 13 days ending in October 2018.