Q2 2026 Earnings Conference Call Recaps: KB Home (KBH)
Bespoke’s Conference Call Recaps use AI to summarize lengthy earnings calls. The commentary below is AI-generated and then edited by Bespoke for quality control. As always, none of these summaries should be construed as recommendations to buy or sell any securities, and investors should do their own research and/or consult with a financial professional before making any investment decisions.
Our latest recap available to Bespoke subscribers covers KB Home’s (KBH) Q2 2026 earnings call.
![]()
KB Home (KBH) is one of the largest US homebuilders, focused primarily on first-time and move-up buyers across fast-growing Sun Belt and West Coast markets. Unlike many peers, KBH emphasizes a built-to-order (BTO) model that lets customers choose their lot, floor plan, and finishes before construction begins. The company provides a useful read on US housing affordability, mortgage-rate sensitivity, consumer confidence, land markets, and homebuilding costs. The central message of the quarter was KB Home’s return to its traditional built-to-order strategy. Built-to-order homes represented 73% of second-quarter orders, up from 60% of deliveries, helping grow backlog 26% sequentially while reducing reliance on incentives and speculative inventory. Management described a difficult spring selling season, with March demand hurt by higher mortgage rates, affordability pressures, inflation concerns, and geopolitical uncertainty; however, April improved after pricing adjustments and lower rates. Construction efficiency was a bright spot, with build times falling to 100 days (the fastest in more than a decade) and the company using more than 1,500 sold-but-not-started homes to negotiate costs with trade partners. Looking ahead, management expects sequential improvements in deliveries, revenue, and margins through year-end, aided by a recovering Bay Area business where new high-priced communities are beginning to contribute meaningfully to profits after several years of underperformance. KBH reported better-than-expected revenue but missed the EPS expectation. In reaction to the results, KBH shares rallied more than 15% intraday on 6/24…
Continue reading our Conference Call Recap for KBH by becoming a Bespoke Institutional subscriber. You can sign up for Bespoke Institutional now and receive a 14-day trial to read our newest Conference Call Recap. To sign up, choose either the monthly or annual checkout link below:
Q2 2026 Earnings Conference Call Recaps: FedEx (FDX)
Bespoke’s Conference Call Recaps use AI to summarize lengthy earnings calls. The commentary below is AI-generated and then edited by Bespoke for quality control. As always, none of these summaries should be construed as recommendations to buy or sell any securities, and investors should do their own research and/or consult with a financial professional before making any investment decisions.
Our latest recap available to Bespoke subscribers covers FedEx’s (FDX) Q4 2026 earnings call.
![]()
FedEx (FDX) is one of the world’s largest transportation and logistics companies, moving nearly 18 million packages per business day and more than $2 trillion worth of goods annually through a global air, ground, and freight network. The company serves everyone from small businesses and e-commerce merchants to pharmaceutical companies, manufacturers, automakers, aerospace firms, and hyperscale data center operators. FedEx beat EPS and revenue estimates this quarter despite tariff changes, de minimis disruptions, Middle East instability, higher fuel costs, and the temporary grounding of its MD-11 fleet. Growth was driven by premium B2B customers rather than low-margin residential shipping, with healthcare, aerospace, automotive, and AI-related data center demand cited as key drivers. International export volumes rose for a second straight quarter, with particularly strong Asia-Europe and US outbound lanes as global trade flows adjusted to tariff and sourcing changes. Management highlighted nearly $10 billion in healthcare transportation revenue and called AI infrastructure an emerging growth engine, noting double-digit growth tied to hyperscaler and data center buildouts. Looking ahead, FedEx expects roughly 11% revenue growth and 20% EPS growth through the remainder of calendar 2026. FDX shares were down less than 1% on Wednesday morning in reaction to the earnings report…
Continue reading our Conference Call Recap for FDX by becoming a Bespoke Institutional subscriber. You can sign up for Bespoke Institutional now and receive a 14-day trial to read our newest Conference Call Recap. To sign up, choose either the monthly or annual checkout link below:
More Tarnish for Gold and Silver
Narratives have a way of shifting quickly in the market.
Heading into last week’s Federal Reserve meeting, new Chair Kevin Warsh was viewed by many as a dove who would be the ultimate toady for President Trump. 24 hours later, all that talk was out the window. Overnight, Warsh picked up a reputation for being a reincarnation of Paul Volcker, and now the talk is two rate hikes before the midterms. Would Warsh really steer the Fed in a direction that looks openly political, potentially derailing the back half of the presidency of the man who appointed him?
Sentiment has a way of shifting back and forth between extremes, and just as Warsh was never likely to be the President’s toady, he’s unlikely to steer the Fed into two rate hikes between now and November, especially with oil prices cratering in the last several weeks.
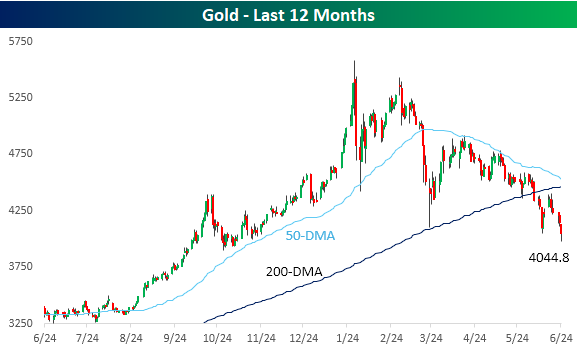
While the shift hasn’t been as quick, the narrative around precious metals has reversed sharply. Earlier this year, investors and traders couldn’t get enough gold and silver to hedge against inflation and a “sell America” trade. Gold and silver both surged to start the year following already strong runs in 2025, but the momentum to start 2026 quickly stalled.
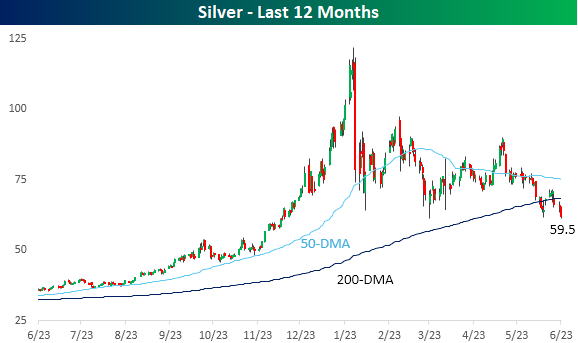
At their January highs, gold and silver were up 29% and 72% YTD, respectively. Today, the “sell America” trade has turned to “buy America,” causing the dollar to strengthen and precious metals to lose their luster. Warsh’s perceived hawkishness at last week’s Fed meeting only added to the recent weakness, and both metals have given up their earlier YTD gains and more with gold now down 6.5% YTD and silver down more than twice as much, with a drop of 15.7%.
For gold, prices briefly dipped below $4,000 an ounce this morning, and even after rebounding intraday, it is still on pace to close at its lowest level since November.
Silver’s decline has been a higher magnitude but has essentially followed the same pattern as prices are at their lowest level since late last year.
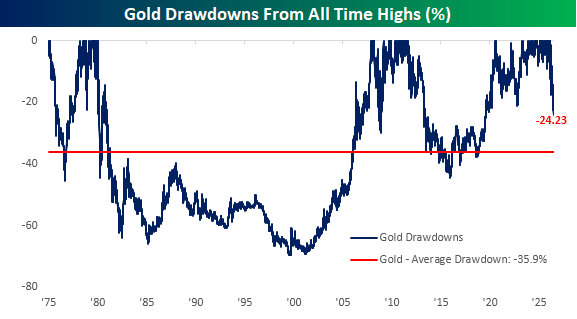
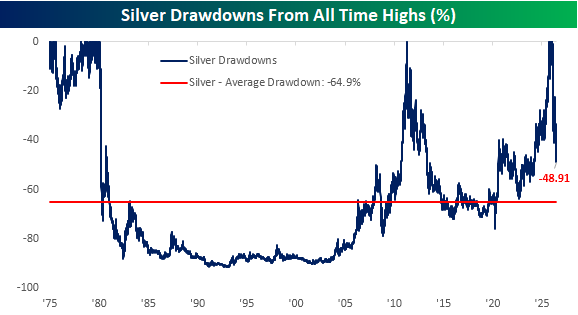
From its record high earlier in the year, gold prices are currently in a drawdown of 24%, while silver is down twice as much.
While gold’s decline has been steep, it’s still much less deep than the 35.9% average drawdown it has traded in since 1975. In fact, 25% drawdowns in gold have not been uncommon over time. Since 1975, gold has traded at a discount of at least 25% relative to its prior all-time high on nearly two-thirds (65%) of all trading days.
Silver tends to be ‘on sale’ even more frequently. Since 1975, its average drawdown has been just under 65%, and on 88% of all trading days, it has been down at least 25% from its prior all-time high.
It’s hard to look at the recent weakness in gold and silver and remember how different sentiment was towards the metals less than six months ago, when places like Costco couldn’t keep gold bars in stock, and central banks around the world were supposedly ditching dollars for gold, but sentiment has a way of changing quickly.
Want more from Bespoke? You can start by joining our Think BIG mailing list, where you’ll receive an interesting market stat in your inbox a few times per week. All we need is your email address. Join now by clicking here or on the image below.

Alts Continue to Struggle
As the prospect of rate cuts gets priced out of the market and the odds of hikes before year-end increase, publicly traded alternative asset managers involved in private equity and private credit have been hit hard again. Software exposure also hurts, and as software stocks have reversed lower this month, so have alts.
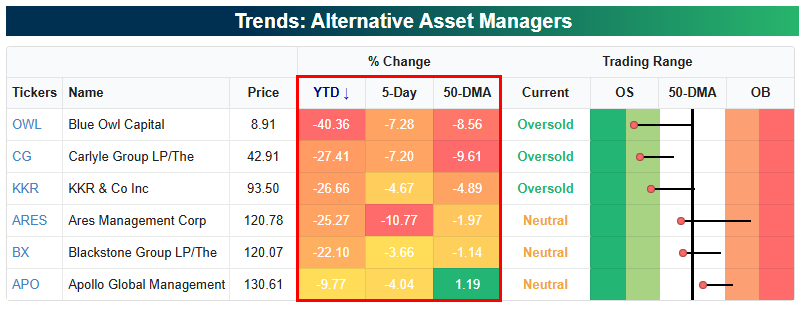
Below is a look at six of the most well-known firms associated with private equity and private credit. Four of five are back down 20%+ year-to-date again after falling sharply over the last week. Blue Owl (OWL) is down the most this year with a 40% drop, followed by Carlyle Group (CG) at -27.4% and KKR (KKR) at -26.7%. Ares (ARES) and Blackstone (BX) are both down 22%+, while Apollo Global (APO) is the one group member that’s down less than 10%.
Three of six are back in oversold territory and well below their 50-DMAs. APO is the outlier among its peers when it comes to its 50-DMA, currently trading 1.2% above it.
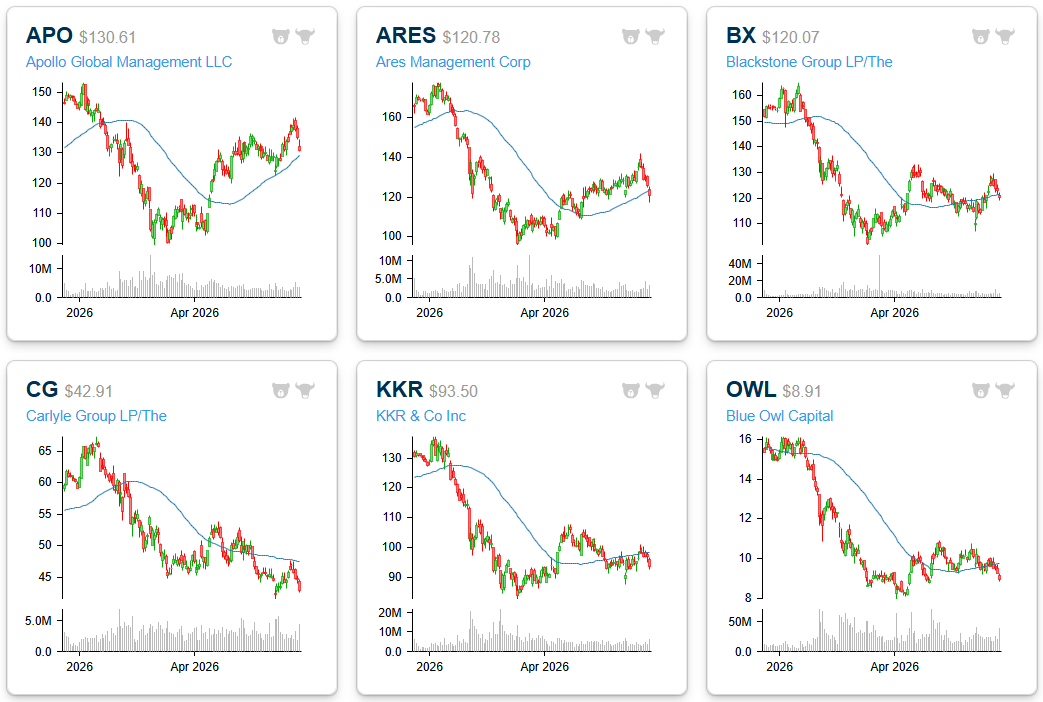
Below are six-month price charts for the stocks listed above. After a rough first quarter, they all managed to bounce back a bit in April. APO has continued to make higher highs in Q2 and sits 25% above its March lows. CG, on the other hand, quickly ran out of steam in late April and drifted lower in May, down to fresh 52-week lows.
Want more from Bespoke? You can start by joining our Think BIG mailing list, where you’ll receive an interesting market stat in your inbox a few times per week. All we need is your email address. Join now by clicking here or on the image below.
Bespoke’s Morning Lineup – 6/24/26 – Alphabet Gets a Seat at the Table
See what’s driving market performance around the world in today’s Morning Lineup. Bespoke’s Morning Lineup is the best way to start your trading day. Read it now by starting a two-week trial to Bespoke Premium. CLICK HERE to learn more and start your trial.
“The most effective leader is the one who satisfies the psychological needs of his followers.” – David Ogilvy

Below is a snippet of commentary from today’s Morning Lineup. Start a two-week trial to Bespoke Premium to view the full report.
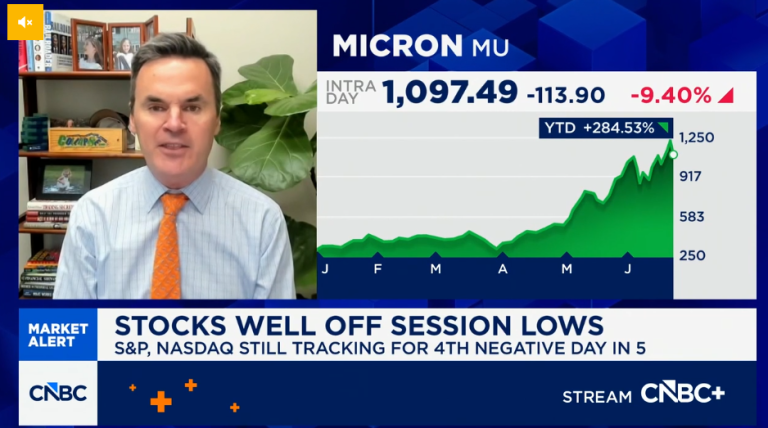
Paul Hickey appeared on CNBC’s Squawk on the Street yesterday to discuss the sell-off in tech and rotation into other sectors. To view the segment, click on the image below.
Stocks are looking to recoup some of Tuesday’s losses as Nasdaq futures rally 0.6% and the S&P 500 stands to gain 0.3%. Bond yields are lower, with the 10-year Treasury falling back down to 4.5% while WTI oil prices drop 3% to $71 per barrel. Gold prices are also down over 2% and not far from breaking the psychologically important level of $4,000 per ounce. Bitcoin is moving in the opposite direction, rallying nearly 1%.
It’s a slow day for data, with New Home Sales being the only economic report on the calendar, but after the bell, investors will be focused on Micron (MU) earnings, which are sure to cause some big moves in the memory sector.
Asian stocks generally rebounded overnight, except for Japan, which fell 0.9%. South Korea bounced 3.3%, erasing one-third of its losses from Tuesday’s session, while Chinese stocks were up fractionally. Traders in South Korea were somewhat comforted by news that Samsung would buy back $58 billion in stock, while SK Hynix said it would proceed with its US listing in early July.
In Europe, the STOXX 600 is slightly lower. French stocks are outperforming with a slight gain, while Germany is the big laggard, falling over 1%. Weakness in Europe’s largest industrial economy comes on the heels of reports that the German government cancelled plans to build six new warships, and that Rheinmetall shares plunging more than 15%.
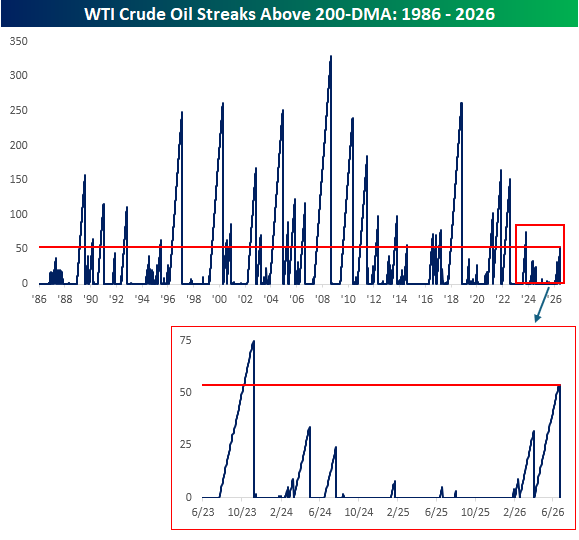
Crude oil prices are lower again this morning, and WTI is down below $72 per barrel for the first time since March 3rd and below its 200-day moving average for the first time since April. Consider this: in May, crude oil prices averaged over $98 per barrel. Today, WTI is 27% lower.
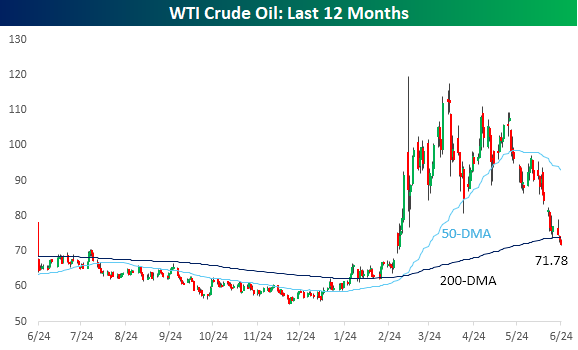
Yesterday’s decline in WTI ended a streak of 54 trading days where the commodity closed above its 200-DMA. As shown in the chart below, that’s far from extreme on a historical basis, but it was the longest streak in nearly three years.
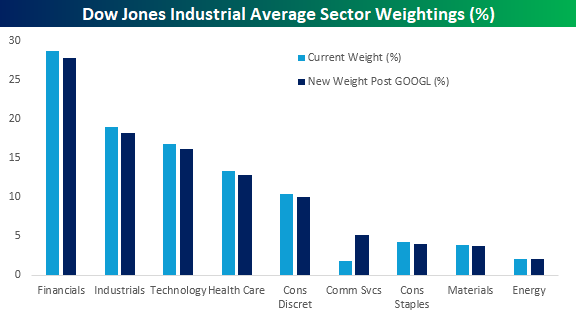
Outside of Energy, S&P Global announced last night that Alphabet (GOOGL) would replace Verizon (VZ) in the Dow Jones Industrial Average. While both stocks are in the Communication Services sector, it will have a notable impact on sector representation in the index. Not because GOOGL has a market cap that’s more than 20 times greater than VZ’s, but instead because its share price is 7.5 times greater (and the Dow is a share price-weighted index).
As the chart below illustrates, every other sector in the will see its weighting decline marginally while Communication Services will see its weighting increase from 1.8% to 5.2% of the index.
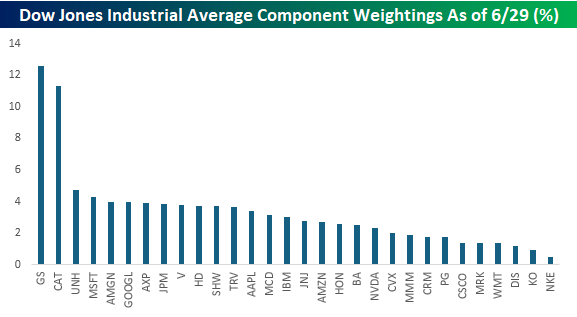
At the individual stock level, based on yesterday’s closing levels, GOOGL will enter the Dow as the sixth-largest component in the index with a weighting of just under 4%. As shown in the chart below, thirteen of the index’s 30 components have weights of between 3% and 5%, but the big outliers are Goldman Sachs (GS) and Caterpillar (CAT). With GS having a share price of nearly $1,100 and CAT closing yesterday just below $1,000, both stocks have weightings of more than 11% each. At the other end of the spectrum, after VZ’s removal, Coca-Cola (KO) and Nike (NKE) will be the only two stocks in the index with weightings below 1%.
Start a two-week trial to Bespoke Premium to continue reading today’s full Morning Lineup.
The Closer – Space Bonds, Memory’s Day to Forget – 6/23/26
Log-in here if you’re a member with access to the Closer.
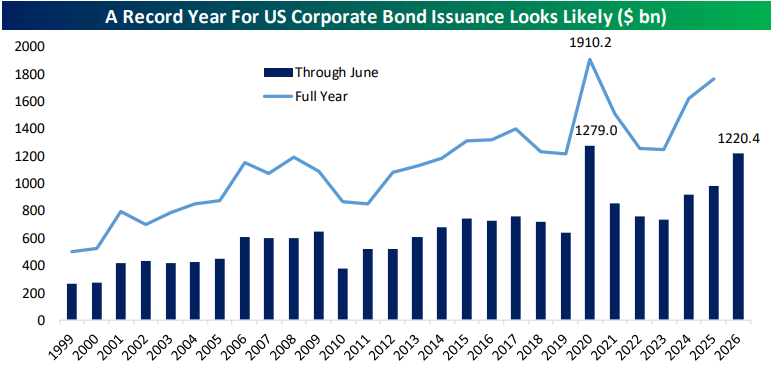
- 2026 is shaping up to be a year with record corporate bond issuance as the year-to-date total reached $1.2 trillion.
- Memory and data storage stocks had a brutal session falling double-digits with technical indicators showing slowing momentum.
- The significantly weaker performance of the Nasdaq relative to the S&P 500 today has done little to work off recent outperformance of the tech-heavy index.
See today’s full post-market Closer and everything else Bespoke publishes by starting a 14-day trial to Bespoke Institutional today!
Q2 2026 Earnings Conference Call Recaps: Carnival (CCL)
Bespoke’s Conference Call Recaps use AI to summarize lengthy earnings calls. The commentary below is AI-generated and then edited by Bespoke for quality control. As always, none of these summaries should be construed as recommendations to buy or sell any securities, and investors should do their own research and/or consult with a financial professional before making any investment decisions.
Our latest recap available to Bespoke subscribers covers Carnival’s (CCL) Q2 2026 earnings call.
![]()
Carnival (CCL) is the world’s largest cruise company, operating Carnival Cruise Line, Princess, Holland America, Costa, AIDA, Cunard, and Seabourn. It was another record quarter for CCL, including its 12th straight quarter of record net yields, despite a difficult backdrop that included the Middle East conflict, elevated fuel prices, disrupted air travel, and historically weak consumer sentiment. The biggest story was a temporary slowdown in European demand, particularly Mediterranean itineraries, as travelers delayed booking amid geopolitical uncertainty. Rather than discount aggressively, management chose to sacrifice some occupancy to protect pricing, helping preserve record booking positions and prices for the remainder of 2026. Importantly, 2027 bookings are running ahead of last year at higher prices, including Europe, reinforcing management’s view that the weakness is transitory. The company also highlighted structural cost improvements, identifying hundreds of efficiency initiatives while keeping ex-fuel unit costs nearly flat. Longer term, CCL is leaning into high-return fleet modernization projects and expanding its private destinations, with Celebration Key, Half Moon Cay, and other exclusive ports expected to host more than 9 million guest visits next year. CCL shares were down 9.3% at the opening bell on 6/23 after reporting a revenue miss on stronger-than-expected EPS…
Continue reading our Conference Call Recap for CCL by becoming a Bespoke Institutional subscriber. You can sign up for Bespoke Institutional now and receive a 14-day trial to read our newest Conference Call Recap. To sign up, choose either the monthly or annual checkout link below:
Biotech (IBB) Breakout
Despite the market turning lower today with the S&P 500 down over 1% and the Nasdaq 100 down closer to 3% thanks to weakness in AI names, there are plenty of pockets of green. In fact, S&P 500 breadth is positive on the day, and one of the top performing sectors with a 1%+ gain is Health Care. A part of that is a breakout in Biotech stocks.
Using the iShares Biotech ETF (IBB) as a proxy for the space, as shown below, the group repeatedly ran into resistance in the high $170 range from January through February of this year. It then fluctuated around its 50-DMA, more recently finding support at its still upward trending 200-DMA before breaking out to the upside with fresh 52-week highs today.
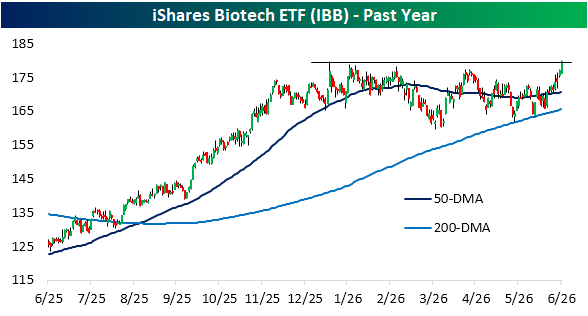
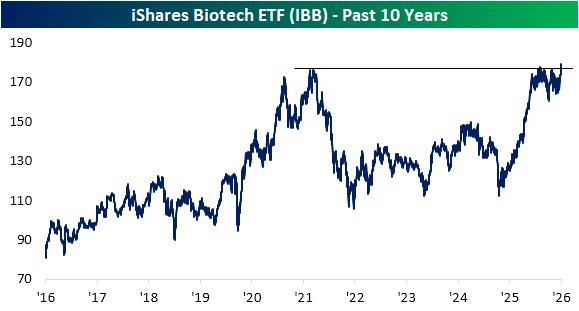
Perhaps more importantly, today’s breakout for IBB doesn’t only mark a breakout relative to the past several months’ range, but it also just took out all-time highs last made in late 2021.
Now that IBB has finally broken through the clouds and cleared turbulence, will it now be clear skies ahead for IBB?
Want more from Bespoke? You can start by joining our Think BIG mailing list, where you’ll receive an interesting market stat in your inbox a few times per week. All we need is your email address. Join now by clicking here or on the image below.
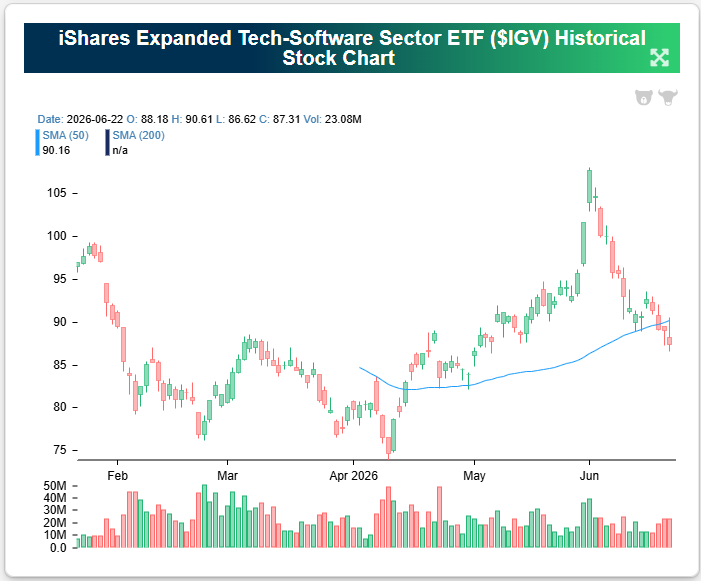
Software Back Down
After a massive bounce in May, software stocks have done nothing but trade lower so far in June. As shown below, the iShares Software ETF (IGV) has even broken back below its 50-day moving average after sitting more than 20% above it at the start of the month.
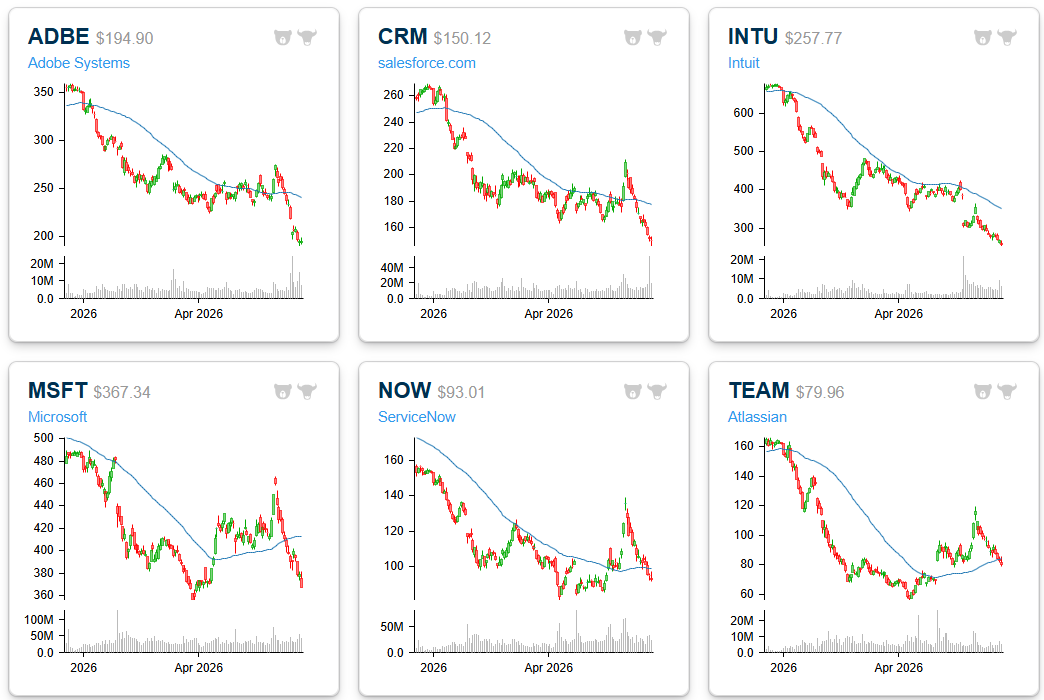
Price charts for some of the biggest software stocks continue to look awful. Adobe (ADBE) and Salesforce (CRM) have been front and center in the “AI Doom” trade, and after briefly stabilizing last month, they’ve gone back to “falling knife” status over the last couple of weeks. Microsoft (MSFT) and ServiceNow (NOW) also looked like they had the potential to stick the landing and form new uptrends last month, but these two have also seen nothing but red in June. Coming into today, MSFT was down 18% on the month!
Interestingly, the AI infrastructure stocks are getting crushed today, which has caused money to flow back into software stocks (MSFT is up 2% in early trading). This is a continuation of the rotation trade going on that has seen software fall when semis rally and vice versa.
Want more from Bespoke? You can start by joining our Think BIG mailing list, where you’ll receive an interesting market stat in your inbox a few times per week. All we need is your email address. Join now by clicking here or on the image below.
Bespoke’s Morning Lineup – 6/23/26 – Reality Check
See what’s driving market performance around the world in today’s Morning Lineup. Bespoke’s Morning Lineup is the best way to start your trading day. Read it now by starting a two-week trial to Bespoke Premium. CLICK HERE to learn more and start your trial.
“The most effective leader is the one who satisfies the psychological needs of his followers.” – David Ogilvy
Below is a snippet of commentary from today’s Morning Lineup. Start a two-week trial to Bespoke Premium to view the full report.
Make sure to check out Paul Hickey on CNBC’s Squawk on the Street at 10 AM today.
We’re witnessing a global sell-off in equities as S&P 500 futures are down over 1% while the Nasdaq stares at a decline of more than 2.5%. The weakness comes as crude oil prices fall to the lowest levels in months and treasury yields are lower, two trends that would normally be viewed as positive for stocks! Asian stocks were sharply lower overnight, and that weakness flowed through into Europe as well, as the STOXX 600 falls over 1%. Flash PMI readings released this morning showed positive moves in the Manufacturing sector but weakness in the Services sector.
Tech is the main driver of the weakness, though. The S&P 500 Equal Weight Index is down less than 0.5%, and most other sectors are faring much better than tech this morning. While Technology is down over 3%, Financials is barely lower, and Health Care is up in the pre-market. This divergence is a reversal of the quarter-to-date trend, where Technology was the only sector outperforming the market in Q2. That’s unsustainable.
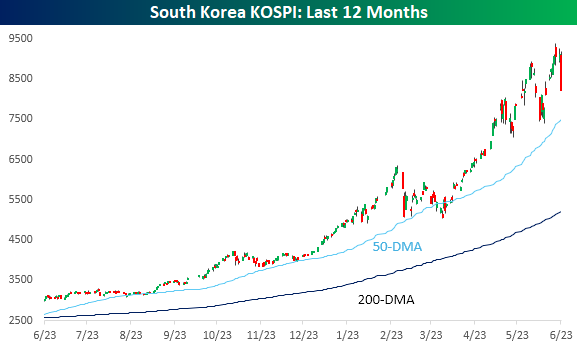
The carnage in US equity futures started overnight in South Korea, where the KOSPI declined 9.99% for its largest daily decline since… March 4th. Usually, 5%+ declines for a major global index are a big deal, but for the KOSPI, last night’s was the third this month! And if you think that’s volatile, in March there were four 5%+ daily moves.
For the KOSPI, today’s 10% decline shows up as a large red candle in the chart, but like the prior two periods of decline the index has had since April, it remains nearly 10% above its 50-day moving average and 58% above its 200-DMA. So, by any traditional or objective measure, it is still overbought.
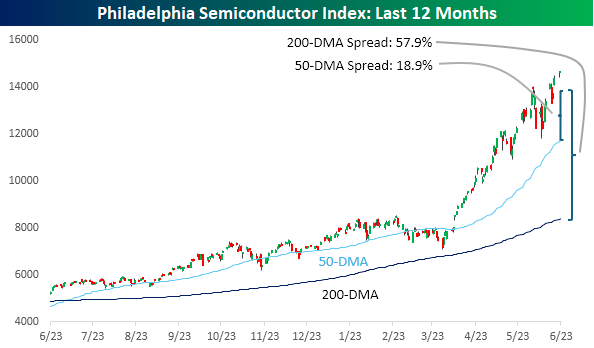
Semiconductor stocks have been the hottest sector of the market during Q2, and as of yesterday, the Philadelphia Semiconductor Index (SOX) was up over 90%. 90%! Today, the index is on pace to trade down about 6%, which wouldn’t even be the worst day this month. That was on 6/5 when it fell over 10%. Even after a decline of 6%, though, the SOX would be 18.9% above its 50-DMA and 57.9 above its 200-DMA. Like the KOSPI, still overbought.
Start a two-week trial to Bespoke Premium to continue reading today’s full Morning Lineup.