Powell Performance – Winners and Losers Since Fed Chair Began
The S&P 500 fell 1.36% on Fed Chair Powell’s penultimate FOMC day on Wednesday (3/18/26). While a hallmark of Powell’s tenure as Chair has been the stock market’s tendency to trade sharply lower in afternoon trading on Fed Days, the market has also done very well over the entirety of his 8+ year term.
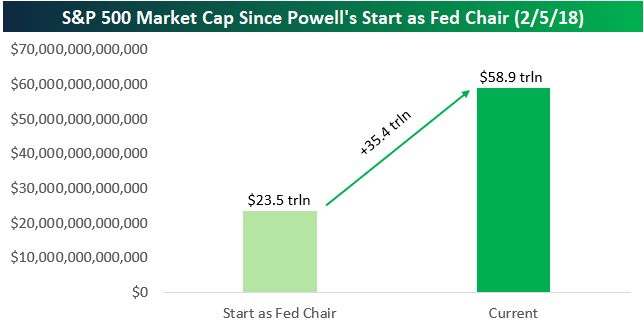
When Powell became Fed Chair in February 2018, the combined market cap of stocks in the S&P 500 was $23.5 trillion. That number has ballooned by $35.4 trillion up to $58.9 trillion today.
The S&P 500 has gained more than 180% since 2/5/18 when Powell became Chair, representing an annualized total return of 13.7%. The tech-heavy Nasdaq 100 has gained much more at 300.9% (18.7% ann.), while the Dow 30 is up 123%.
Compared to the rest of the world, Powell has kept US markets in a dominant position. The S&P has beaten the rest of the world by more than 100 percentage points since his time as Chair began.
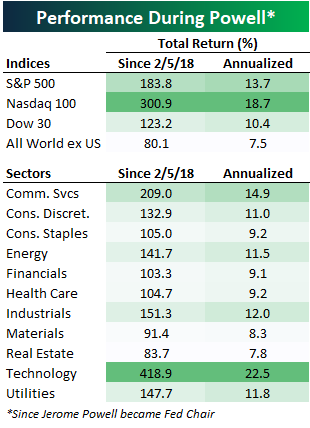
Looking at sector performance, Technology has more than doubled the next-best sector (Communication Services) during Powell’s tenure. As shown above, Tech has returned 418% since Powell took over, while Materials and Real Estate are the only two sectors that haven’t at least doubled.
Of the current S&P 500 members that were trading back in early 2018 when Powell became Chair, 59% have gained at least 100% since then. There are nearly just as many S&P 500 stocks up 500%+ (39) since Powell’s tenure began as there are stocks that are down (45).
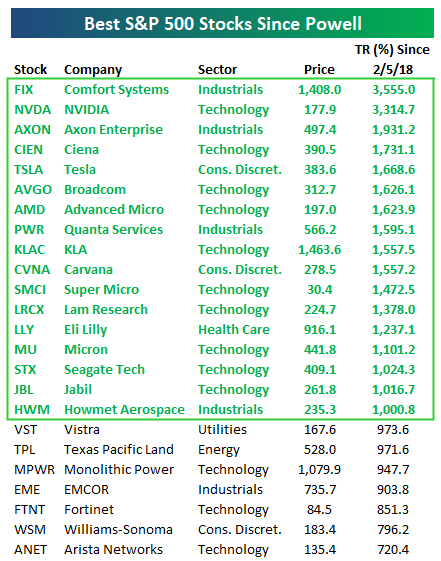
Below is a table showing the best-performing S&P 500 stocks since Powell became Chair, with the seventeen “10-baggers” highlighted in green.
You may have thought NVIDIA (NVDA) would be at the top of this list given its place as the largest company in the world right now, but a company that’s just over a tenth of NVDA’s size actually has it beat. Comfort Systems (FIX) — which builds out the mechanical, electrical, and plumbing systems for AI data centers and other infrastructure projects — is actually #1 when it comes to share-price performance under Powell. As shown, FIX is up 3,555% compared to a gain of 3,314% for NVDA.
Most of the names on the list of big winners since Powell became Chair are directly related to the AI Boom, but some that are not include Axon Enterprises (AXON) — which sells Tasers and police bodycam hardware and software, Carvana (CVNA) — which sells used cars, and Eli Lilly (LLY) — which sells weight-loss drugs and other pharmaceuticals.
Sign up for Bespoke’s Think BIG mailing list to receive an interesting market stat like this in your inbox a few times per week. Click here or on the image below to sign up. An email is all we need!

While there are seventeen “10-baggers” since Powell became Chair, not all of those stocks are in uptrends right now. Below are price charts for the six best performers in our table above. While Ciena (CIEN) and Comfort Systems (FIX) remain in strong uptrends, the other four have either traded sideways or lower over the last six months.
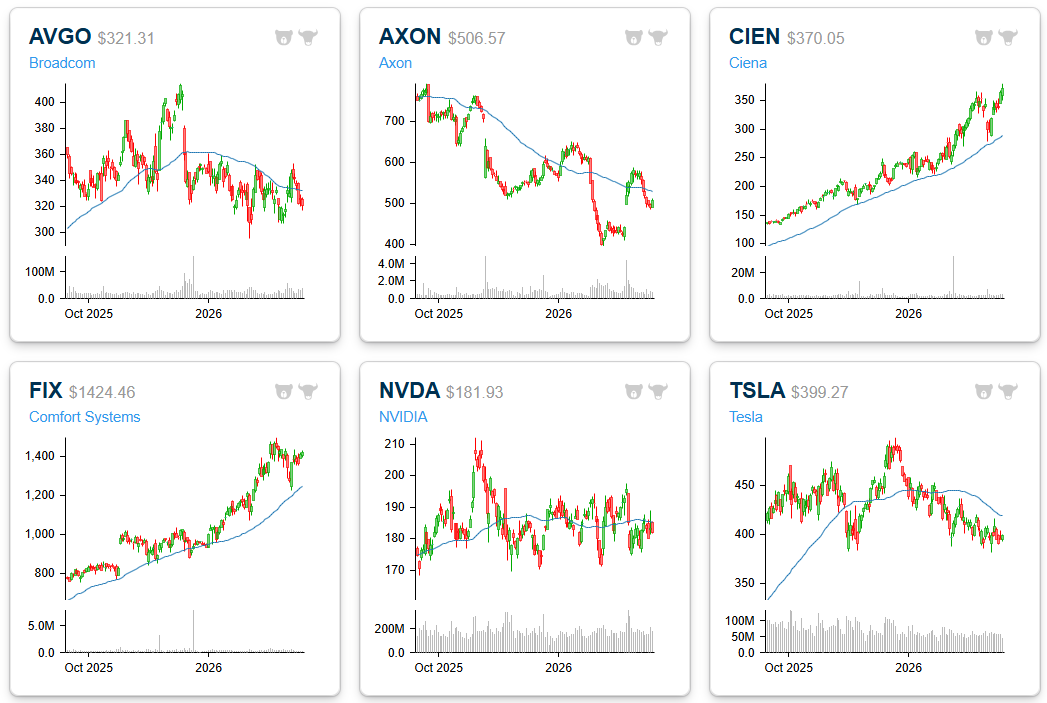
Of the six biggest winners under Powell, Ciena (CIEN) is the only one trading at record highs today. Its price action lately has been a sight to behold.
Last year at the tariff-tantrum lows, the stock was trading in the low-$50s. It’s currently trading above $400.
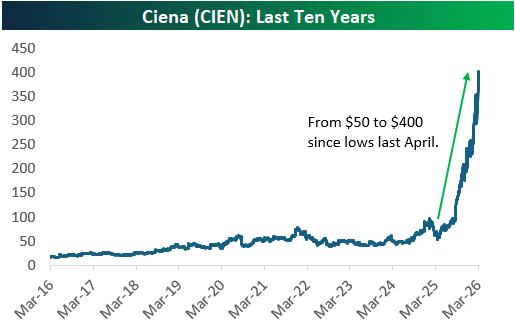
Ciena (CIEN) somewhat slid under the radar in the early years of the AI Boom, but over the last year or so, investors haven’t been able to get enough of it.
That’s because Ciena makes some of the most important networking gear for AI data centers (shown below). Every time a company makes a bigger, smarter LLM for consumption, they need more of Ciena’s gear to make that data work and move faster.

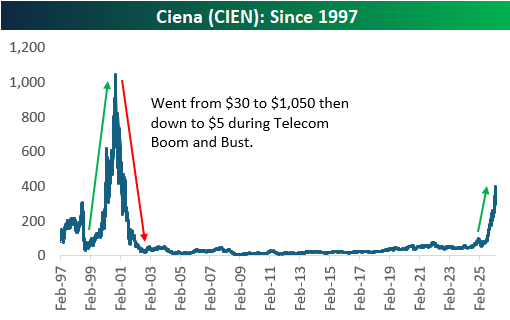
What’s even crazier about Ciena (CIEN) is that even though the stock is up nearly 1,000% in the last few years and 1,700% since Powell became Fed Chair, it still hasn’t gotten back to half of what it peaked at during the Dot Com Bubble of the late 1990s.
Just as Ciena is a key player in the AI infrastructure build-out right now, it was also a key player in the Internet/Telecom buildout of the late 1990s. After rallying from $30 to north of $1,000/share at its peak, shares plummeted to as low as $5 after the bubble burst in the early 2000s.
This should be a key reminder of how carried away investors can get during market manias, but it also shows that while the AI Boom indeed has a lot of hype, things were even crazier back in the late 90s.
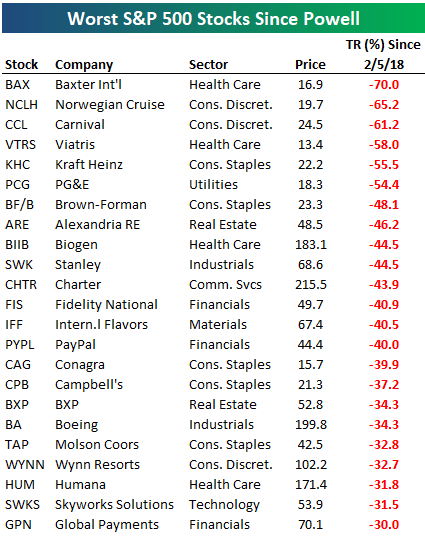
So far we’ve only discussed winners since Powell became Fed Chair, but below is a list of the S&P 500 stocks that have done the worst over his tenure. The names shown are the 23 stocks down at least 30% since 2/5/18, led by Baxter International (BAX) with a 70% drop.
Two cruise-lines rank 2nd and 3rd worst (Norwegian and Carnival) with declines of more than 60%, and another three stocks have been more than cut in half: Viatris (VTRS), Kraft Heinz (KHC), and PG&E (PCG). Other well-known names on this list of losers include Biogen (BIIB), PayPal (PYPL), Campbell’s (CPB), Boeing (BA), Molson Coors (TAP), and Wynn Resorts (WYNN).
Like this analysis? Become a Bespoke Premium member today using our March Madness special! Click below for details on how to sign up:

Bears Cross 50%
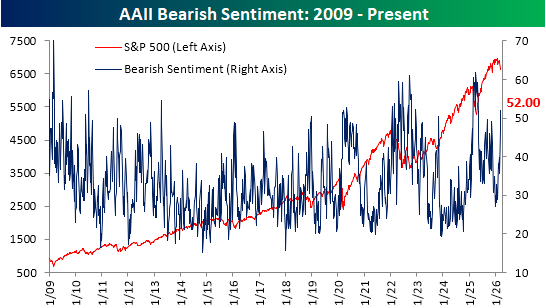
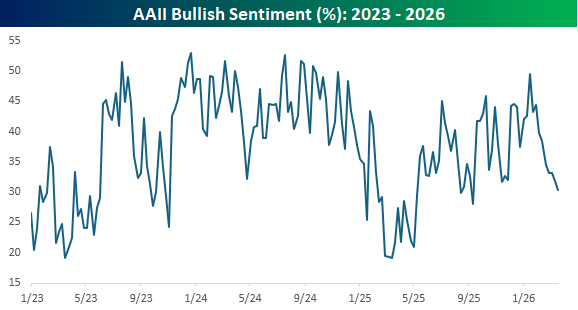
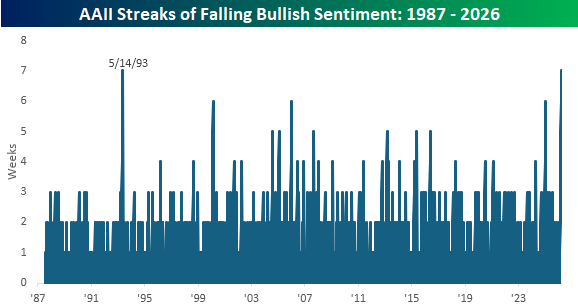
As if news headlines and price action haven’t been signals enough, investor sentiment readings are also pointing toward negative outlooks in the wake of the conflict in the Middle East. The American Association of Individual Investors (AAII) weekly sentiment survey saw only 30.4% of respondents report bullish sentiment this week. That is the lowest level since the week of 9/11/25, when it registered 28%. Additionally, as we first highlighted in today’s Morning Lineup, the 1.5 percentage point drop this week marked the seventh consecutive weekly decline in bullish sentiment, which ties another 7-week-long streak from May 1993.
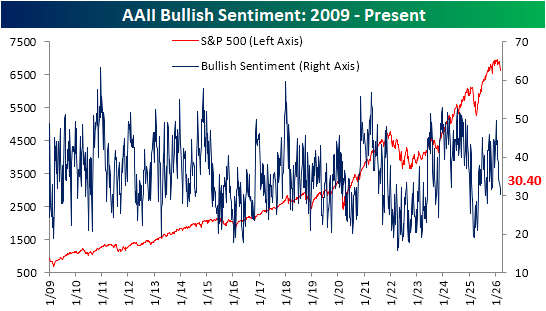
Given the drop in bulls, bearish sentiment has continued to surge. This week, the reading rose another 5.6 percentage points to 52%. That is the highest reading since last May, when it was at 59.3%. Throughout the survey’s history since 1987, less than 5% of weekly readings have seen more than half of respondents report as bearish.
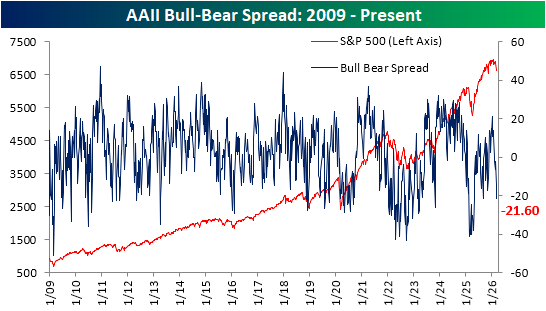
With inverse moves in bulls and bears, the bull-bear spread fell to -21.6. That narrowly surpasses the previous local low of -21.5 from the week of 9/11/25, registering the worst reading since last May.
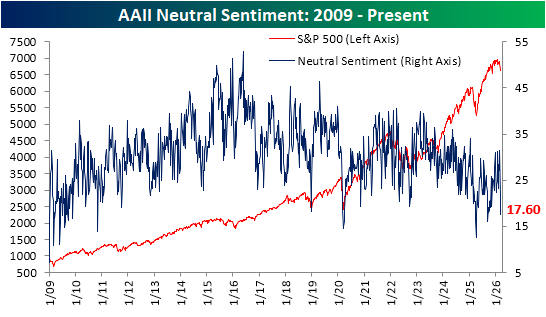
We would also note that not only has there been a big move toward bearish sentiment due to lost bullishness, but a big drop in those reporting neutral sentiment has also been a factor. Only two weeks ago, 31.4% of respondents reported neutral sentiment for the highest reading since January 2025. In the two weeks since then, it has fallen to 17.%, which ranks in the 4th percentile of all periods on record, and is the lowest since a reading of 16% last September.
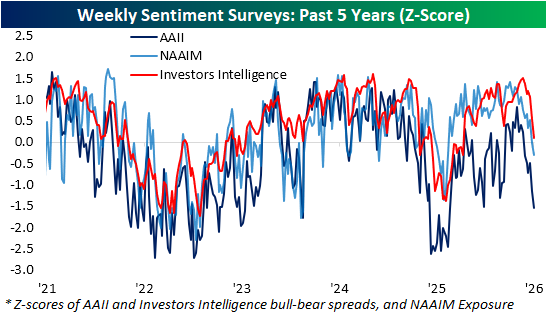
In other words, sentiment has turned overwhelmingly bearish. That is also reflected in other surveys like the Investors’ Intelligence and NAAIM Exposure index readings. The latter now indicates the lowest level of long exposure to equities since last spring, and that reading is now also below the historical average. The Investors’ Intelligence survey is still marginally bullish relative to historical norms, although it too is quickly approaching bearish readings.
Like this analysis? Join our premium members by starting a trial today! Click below for details on how to sign up:

Bespoke’s Morning Lineup – 3/19/26 – Unlucky Seven
See what’s driving market performance around the world in today’s Morning Lineup. Bespoke’s Morning Lineup is the best way to start your trading day. Read it now by starting a two-week trial to Bespoke Premium. CLICK HERE to learn more and start your trial.
“If you don’t understand what the professor is saying, don’t dismiss the possibility that he might be wrong.” – Paul Volcker

Below is a snippet of commentary from today’s Morning Lineup. Start a two-week trial to Bespoke Premium to view the full report.
After a relatively strong start to the week, where it looked like the market would be able to look past the spike higher in energy prices, continued tensions in the Middle East and the stubbornly high level of crude oil prices have pushed the S&P 500 back into the red for the week, with further downside in store for today. S&P 500 futures are trading down 0.4%, which would put the S&P 500 below its 200-day moving average (DMA). The Nasdaq, which already closed below its 200-DMA yesterday, is expected to add to that breakdown with a decline of 0.5%.
International markets had a terrible night, with most major averages in the region down at least 2% and in most cases much more. That’s the same trend in Europe as well, with the STOXX 600 down over 2%, as is the case with most indices in the region.
As we’ve been pointing out all along, the declines are all about energy prices, and this morning, they’re not helping out as WTI trades up 2% to more than $98 per barrel, while Brent trades up by nearly 7% to $115 per barrel. The spread between Brent and WTI is now a monstrously high $16+ per barrel.
Treasury yields are moving higher as investors fear the inflationary impacts of rising energy prices, and the 10-year yield is now testing 4.3%. Gold prices are plunging more than 5% to under $4,700 per ounce, and Bitcoin is back below $70K.
The economic calendar is relatively busy this morning with jobless claims and Philly Fed at 8:30, while New Home Sales and Wholesale Inventories will hit the tape at 10 AM. Jobless claims came in lower than expected on an initial basis but slightly higher than expected on a continuing basis, while the Philly Fed was actually better than expected. With everything going on in the Middle East, though, the data is basically meaningless.
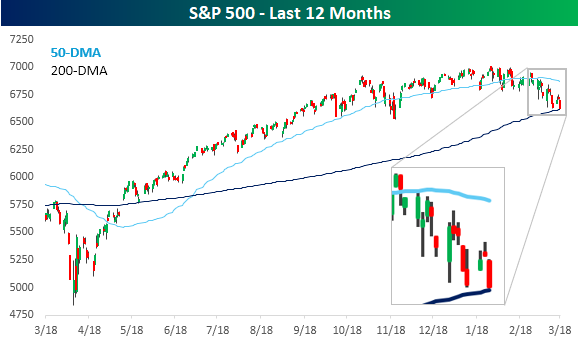
As the quote of the day notes, in many aspects of life, change has a way of happening slowly and then all at once. For months, the S&P 500 has been trading in a sideways range, consolidating the gains from the April lows. Then, all of the sudden we have a day like yesterday where the S&P 500 sells off a not necessarily dramatic 1.4%, but then all of the sudden, we’re looking at an S&P 500 whose 50-day moving average (DMA) has just started to slope downward just as the index is on the verge of trading below its 200-DMA for the first time since last spring. Steady uptrend to sideways range and now a potential downtrend? Change happens slowly until it doesn’t.
With the S&P 500 slowly (and now more suddenly) trending lower, investor sentiment has also been on the decline. In the latest survey from the American Association of Individual Investors (AAII), bullish sentiment declined from an already low level of 31.9% to 30.4%, which is the lowest level since last September, as the uptrend in sentiment since the lows early last year has been firmly broken.
With this week’s decline, bullish sentiment has now declined for a record seven straight weeks. That’s now tied with the seven-week streak from May 1993 for the longest weekly losing streak in the survey’s history. Behind these two streaks, there were three others (Feb 2000, Jan 06, and Jan 2025) that lasted six weeks. Based on how the market traded yesterday, if we don’t see an improvement in the next couple of days, we would expect that this current streak could move into first place all on its own.
The Closer – FOMC, TICS, PPI – 3/18/26
Log-in here if you’re a member with access to the Closer.
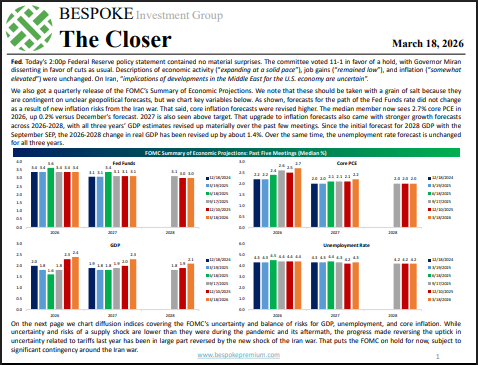
- Today’s Federal Reserve policy statement contained no material surprises and Fed Chair Powell’s presser was also mostly unremarkable.
- DRAM/NAND memory producer Micron (MU) blew the doors off earnings with revenues 21% above estimates and triple what they were a year ago.
- The latest PPI release showed that costs were broadly accelerating even before the recent leap in gasoline and diesel prices.
See today’s full post-market Closer and everything else Bespoke publishes by starting a 14-day trial to Bespoke Institutional today!
Q4 2025 Earnings Conference Call Recaps: Williams-Sonoma (WSM)
Bespoke’s Conference Call Recaps use AI to summarize lengthy earnings calls. The commentary below is AI-generated and then edited by Bespoke for quality control. As always, none of these summaries should be construed as recommendations to buy or sell any securities, and investors should do their own research and/or consult with a financial professional before making any investment decisions.
Our latest recap available to Bespoke subscribers covers Williams-Sonoma’s (WSM) Q4 2025 earnings call.
![]()
Williams-Sonoma (WSM) is a premium home furnishings retailer operating a multi-brand portfolio including Pottery Barn, West Elm, and Williams-Sonoma, selling furniture, décor, kitchenware, and design services through a digital-first, omnichannel model. WSM delivered a 3.2% Q4 comp and 20.3% operating margin despite tariff headwinds and weak housing turnover, gaining share while maintaining full-price selling. Management emphasized resilience to tariffs through sourcing and pricing actions, with margin pressure expected to be front-half weighted in 2026. Growth is being driven by product newness, collaborations, and emerging brands, while B2B (+10% FY growth) and Rejuvenation remain key white-space opportunities. The company is pivoting back to retail expansion (20 new stores, 19 repositions) after years of optimization. Pottery Barn lagged in Q4 due to weak décor assortment, but is being reset with stronger product and brand positioning. WSM reported weaker revenue on better-than-expected EPS, resulting in shares up as much as 6% on 3/18…
Continue reading our Conference Call Recap for WSM by becoming a Bespoke Institutional subscriber. You can sign up for Bespoke Institutional now and receive a 14-day trial to read our newest Conference Call Recap. To sign up, choose either the monthly or annual checkout link below:
Bespoke’s Morning Lineup – 3/18/26 – Fed Who?
See what’s driving market performance around the world in today’s Morning Lineup. Bespoke’s Morning Lineup is the best way to start your trading day. Read it now by starting a two-week trial to Bespoke Premium. CLICK HERE to learn more and start your trial.
“If you don’t understand what the professor is saying, don’t dismiss the possibility that he might be wrong.” – Paul Volcker
Below is a snippet of commentary from today’s Morning Lineup. Start a two-week trial to Bespoke Premium to view the full report.
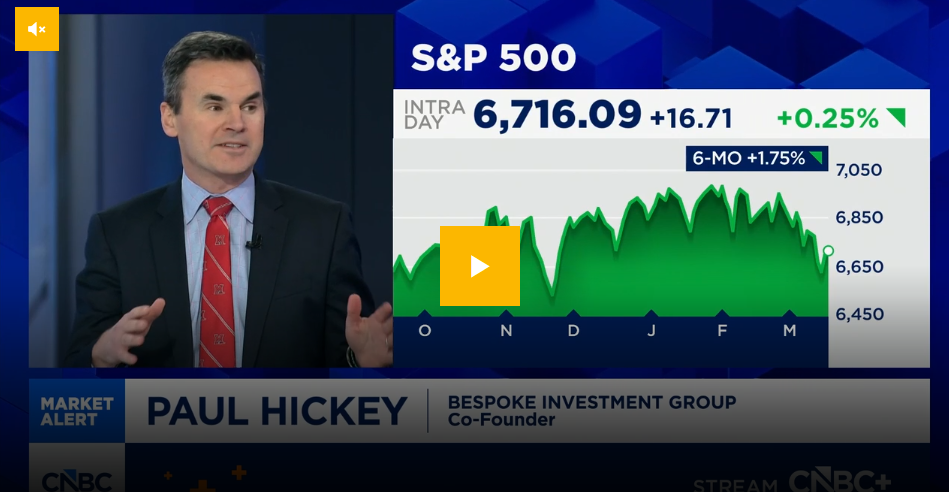
Paul Hickey appeared on CNBC Overtime yesterday to discuss the sideways trending market and volatility underneath the surface. To view the segment, click on the image below.
Futures are still green, but they have given up most of their earlier gains as we approach the opening bell. It appears some of the weakness may be tied to reports of a strike on some Iranian energy facilities. Conversely, oil prices are lower but have erased most of their earlier losses. Treasury yields are basically unchanged, gold is down close to 2%, while Bitcoin is down over 2% and back below $73K.
Equities in Asia had a very strong session overnight, with the Nikkei up 2.9%, while South Korea surged 5.0%. Other major indices in the region were also green but by less than 1%. Catalysts behind the move include a lack of continued upside in oil prices, stronger-than-expected export orders in Japan, and positive comments from Samsung related to AI chip demand being strong.
European stocks have also started the day on a positive note, with the STOXX 600 up 0.6%, led higher by Spain, Italy, and France, which are all up over 1%. Besides lower oil prices, February CPI also rose less than expected (0.6% vs 0.7%). Tomorrow, we’ll also get policy decisions from the ECB, BoE, and SNB.
The economic calendar is busy this morning with PPI at 8:30, followed by Factory Orders and Durable Goods at 10 AM Eastern. After that, attention will shift to the FOMC, where Powell & Co are widely expected to leave rates unchanged at 2 PM. Investors will be focused on the press conference and summary of economic projections, but with all the uncertainty around oil supplies, take them with a grain of salt. The PPI just hit the tape and the numbers were much higher than expected, so that has pushed futures into negative territory.
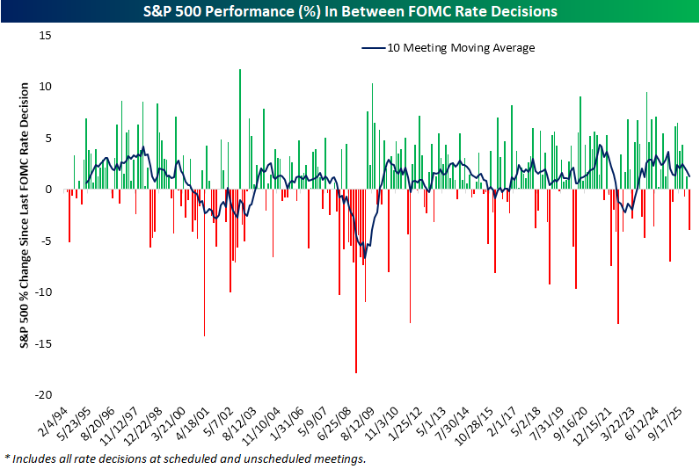
In our FOMC meeting preview report sent out yesterday, we highlighted some of the key trends surrounding Fed days. The report included an overview of the market’s performance leading up to meetings and how it performs on the day of the announcement, how the market performs based on what the FOMC does (or doesn’t do), as well as how it performs on an intraday basis based on different scenarios.
One of the charts included showed the performance of the S&P 500 between FOMC meetings, and heading into today’s announcement, the S&P 500 is down about 4% since its last meeting in January. As shown, that ranks as the worst inter-meeting performance in a year and also ranks in the 15th percentile of all inter-meeting periods since 1994, when the Fed first started announcing its rate decisions on the day of its meetings. It gets worse than the last six weeks, but not much worse!
The market is currently pricing in a greater than 99% likelihood of no change in rates by the Fed today, and with the war in Iran taking center stage, there is not likely to be nearly as much attention put on Powell’s penultimate press conference this afternoon. When it comes to policy, though, there have been some major shifts in market expectations for policy between now and the last meeting for 2026 in December.
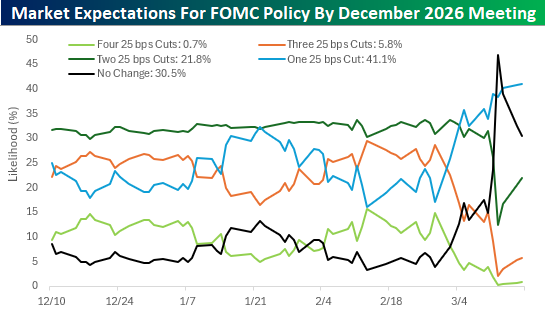
The chart below shows the change in expectations for various policy levels since the Fed last cut rates in December. While the market is currently pricing in an almost one in three chance of no change in rates between now and December, less than three weeks ago, the market was pricing in a less than 5% chance of no change in rates. Instead, the odds were heavily on cuts with a 41% chance of two cuts, a 29% chance of three cuts, a 15% chance of four cuts, and just a 17% chance of only one cut. Today, the trend has completely reversed. There’s now a greater than 70% likelihood of one cut or less, and barely more than a one in four chance of two or more cuts.
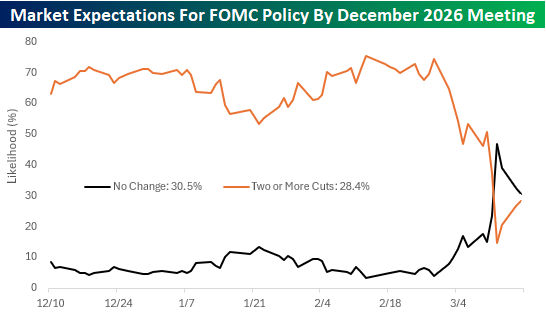
To show the shift more clearly, the chart below shows the change in market pricing for no change in rates versus two or more cuts. For three months, market expectations were pretty steady, but then that quickly changed at the end of February with one word – Iran.
The Closer – FOMC, Energy, Credit – 3/17/26
Log-in here if you’re a member with access to the Closer.
- Since the last FOMC meeting on January 28th, the Fed Funds future curve has shifted justifiably and dramatically.
- Stocks with the highest international revenue exposure have seen large moves since the start of the war in Iran.
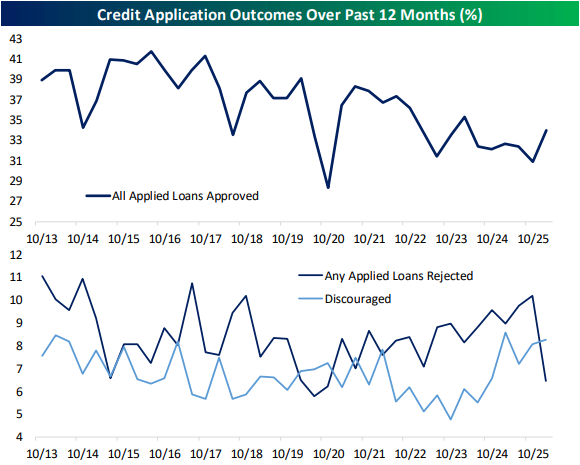
- February saw a steep decline in the number of consumers receiving rejections after applying for credit.
See today’s full post-market Closer and everything else Bespoke publishes by starting a 14-day trial to Bespoke Institutional today!
Past the Ides of March
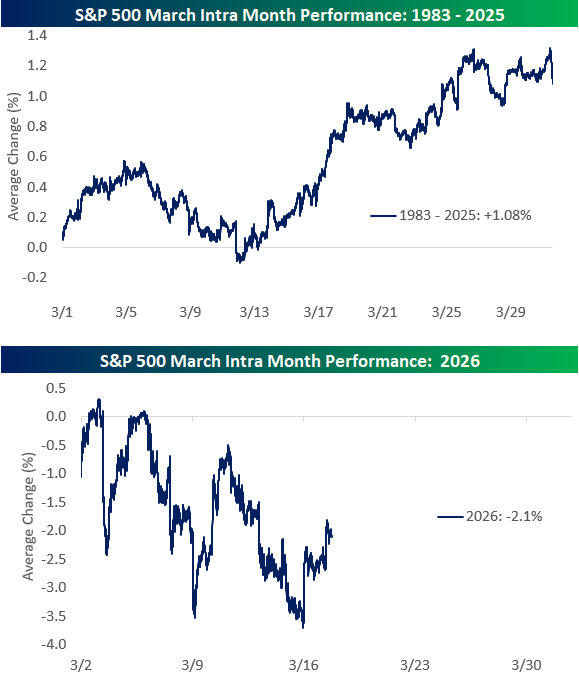
The S&P 500 fell more than 3% in the first half of March, but there’s reason to be more optimistic from a seasonal perspective. As we highlighted in this Chart of the Day for members at the start of the month, March gains have historically been back-end loaded.
The top chart below shows the S&P 500’s average path during the month of March since 1983. The second chart shows the S&P’s price action so far this March.
Historically, the market has traded relatively flat through the Ides of March and then picks up steam with gains in the back half of the month.
So far this week, we’ve seen the bulls get back to work with the S&P up more than 1% as of noon on Tuesday. We’ll see if the gains can hold and continue following the historical script with a strong finish to the month.
Sign up for Bespoke’s Think BIG mailing list to receive an interesting market stat like this in your inbox a few times per week. Click here or on the image below to sign up. An email is all we need!
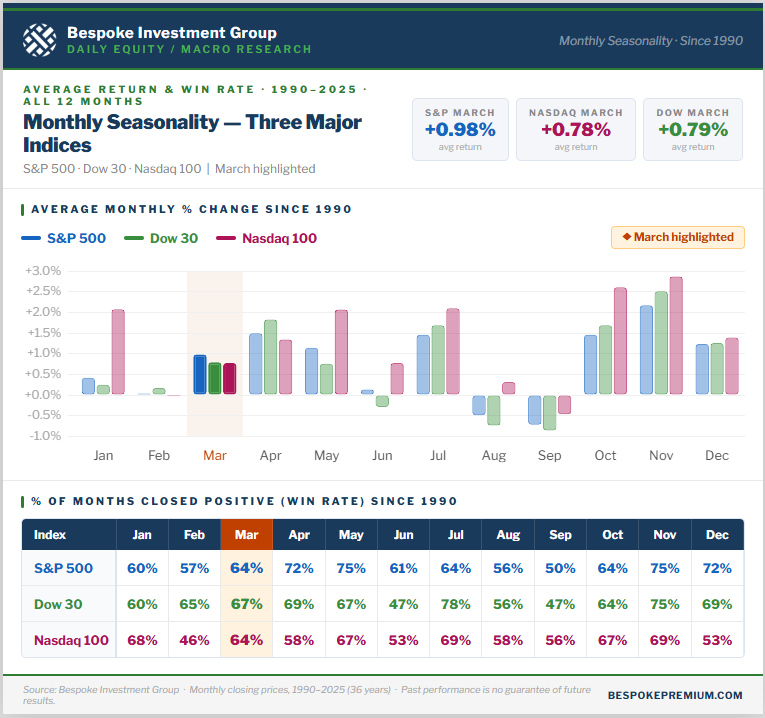
For more context on market seasonality, the graphic below was featured in our Chart of the Day for members back on March 2nd. It shows the average monthly percentage change for the S&P 500, Nasdaq 100, and Dow 30 since 1990.
While March has typically seen gains of just under 1% for all three indices, April has been an even better month over the years!
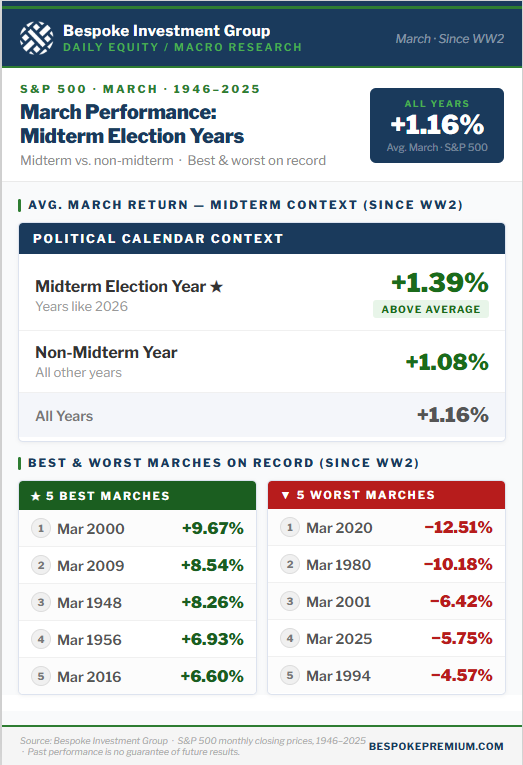
In addition to the graphic above, the one below shows how the market has performed in March during midterm election years like 2026 versus all other years. As shown, the market has historically done slightly better in March during midterm years with an average gain of 1.39% since WW2.
Like this analysis? Receive our Chart of the Day in your inbox each day by starting a Bespoke trial! Click below for details on how to sign up:
Bespoke’s Morning Lineup – 3/17/26 – Trying to Get in the Holiday Mood
See what’s driving market performance around the world in today’s Morning Lineup. Bespoke’s Morning Lineup is the best way to start your trading day. Read it now by starting a two-week trial to Bespoke Premium. CLICK HERE to learn more and start your trial.
“Competitive golf is played mainly on a five-and-a-half-inch course… the space between your ears.” – Bobby Jones
Below is a snippet of commentary from today’s Morning Lineup. Start a two-week trial to Bespoke Premium to view the full report.
As hard as the bears have been working to push futures lower overnight and this morning, the luck of the Irish won’t quit and has pushed futures on the S&P 500 and the Dow into the green. The Nasdaq isn’t quite there, but it is well off its overnight lows. Treasuries are modestly higher, pushing yields slightly lower, while crude oil rebounds more than 2% to $95 per barrel. Gold prices are fractionally higher, and Bitcoin is basically flat.
It’s a quiet day for economic data today, with Pending Home Sales and Leading Indicators the only two reports on the calendar, and both will be released at 10 AM.
In international markets, Asian stocks were mixed overnight, while Europe is mostly higher, with the STOXX 600 up 0.5%. Those gains come despite ZEW Economic Sentiment Indices coming in significantly weaker than expected, as concerns over the war in Iran weigh on sentiment.
Can it get any worse for airline stocks? After already dealing with the government shutdown where TSA agents aren’t getting paid, the war with Iran has caused jet fuel prices to double and raised the threats of terrorism, which, at the margin, causes travel plans to decline. Since its peak in early February, the US Global Jets ETF (JETS) has plunged more than 20%, effectively erasing the gains from late last year after it broke out of a multi-month trading range. At $24.58, the ETF closed yesterday right near support at the low end of that prior range.
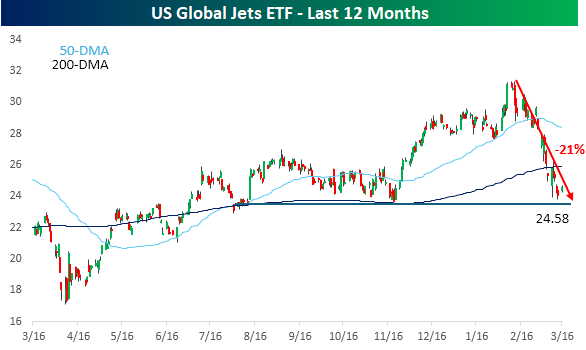
With all the headwinds facing the sector, it’s not looking like the Q1 earnings season is a period that airlines are looking forward to. Despite that backdrop, it was surprising to see comments from Delta CEO Ed Bastian this morning where he said that despite the negative impact of rising energy prices on company margins, the weakness has been completely offset by exceptionally strong demand. In his interview on CNBC, Bastian noted that “We’ve seen eight of the top 10 sales days in our history this quarter, and five of those just within the last two weeks, within just the last week of March”. With demand like that, we can only imagine what the company’s quarterly results would have looked like had there not been a war!
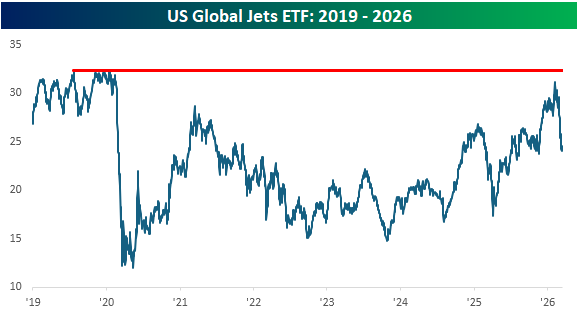
Looking at the airline stocks from a longer-term perspective, the timing of the Iran war couldn’t have been worse. At its recent peak in February, the JETS ETF traded above $31 and was within a dollar of its pre-Covid highs. It’s been a long slog for the sector, but after more than six years, it’s almost back to even.
The Closer – $2 Per Day, Positioning, Credit – 3/16/26
Log-in here if you’re a member with access to the Closer.
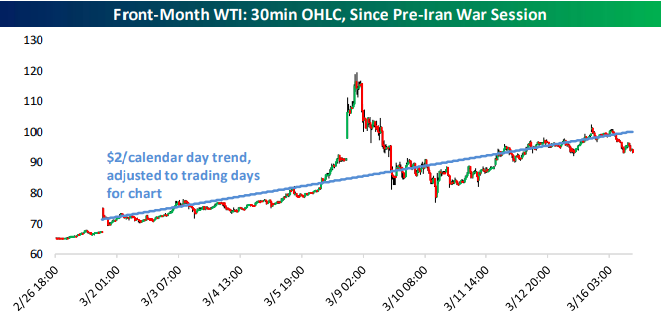
- Despite the dip today, front month WTI is rising at a $2/day pace.
- Positioning data is beginning to reflect adjustments in energy and agriculture commodity futures as a result of the closure of the Strait Hormuz.
- Consumer lending, private equity, and private credit stocks are down as IG credit spreads have soared.
See today’s full post-market Closer and everything else Bespoke publishes by starting a 14-day trial to Bespoke Institutional today!