Q4 2025 Earnings Conference Call Recaps: Domino’s Pizza (DPZ)
Bespoke’s Conference Call Recaps use AI to summarize lengthy earnings calls. The commentary below is AI-generated and then edited by Bespoke for quality control. As always, none of these summaries should be construed as recommendations to buy or sell any securities, and investors should do their own research and/or consult with a financial professional before making any investment decisions.
Our latest recap available to Bespoke subscribers covers Domino’s Pizza’s (DPZ) Q4 2025 earnings call.
![]()
Domino’s Pizza (DPZ) is the world’s largest pizza company by retail sales, operating over 21,000 stores globally through a franchise-heavy model with roughly 7,186 US locations. As the dominant player in quick-serve (QSR) pizza with approximately 25% US market share, the company offers insight into consumer spending patterns across income cohorts, the evolving economics of delivery versus carryout, and the competitive dynamics of value-driven restaurant businesses. Management guided to 3% US same-store sales growth in 2026 against what they expect will remain a pressured macro backdrop. CEO Weiner introduced the ambition of doubling US retail sales from roughly $10 billion over time, benchmarking against QSR category leaders with 40-50% share. Pricing was flat in Q4, yet estimated franchisee store profitability grew to approximately $166,000, management’s “profit power” thesis in action. The company grew all income cohorts in 2025, pushing back on the lower-income consumer weakness narrative prevalent across QSR. On aggregators, management stressed they haven’t reached fair share on Uber or DoorDash and are growing those platforms carefully to ensure new orders are genuinely additional rather than cannibalizing their own direct channels. DPZ reported better-than-expected revenue on weaker EPS, as the stock climbed 4.1% on 2/23…
Continue reading our Conference Call Recap for DPZ by becoming a Bespoke Institutional subscriber. You can sign up for Bespoke Institutional now and receive a 14-day trial to read our newest Conference Call Recap. To sign up, choose either the monthly or annual checkout link below:
Q4 2025 Earnings Conference Call Recaps: Home Depot (HD)
Bespoke’s Conference Call Recaps use AI to summarize lengthy earnings calls. The commentary below is AI-generated and then edited by Bespoke for quality control. As always, none of these summaries should be construed as recommendations to buy or sell any securities, and investors should do their own research and/or consult with a financial professional before making any investment decisions.
Our latest recap available to Bespoke subscribers covers Home Depot’s (HD) Q4 2025 earnings call.

Home Depot (HD) is the world’s largest home improvement retailer, operating 2,359 stores across the US, Canada, and Mexico, with $164.7 billion in fiscal 2025 sales. The company serves both Do-It-Yourself consumers and professional contractors, and its recent acquisitions of specialty distributors SRS and GMS have expanded its reach into roofing, building materials, and the professional trades. Management described a year of stable but subdued demand, with full-year comps up just 0.3% as housing turnover remains near 30-to-40-year lows and large discretionary projects stay pressured. CEO Ted Decker called big-ticket discretionary recovery the “telltale” for a market turn, one they have not yet seen. On tariffs, the team said pricing actions on mid-single-digit exposure are largely complete, translating to roughly 3% SKU-level price increases. SRS gained roofing market share despite industry shingle shipments falling 28% in Q4 to their lowest level since 2019, though aggressive pricing will weigh on Q1 margins. Fiscal 2026 guidance calls for flat-to-2% comps, with EPS growth of flat-to-4%. On better-than-expected results, HD shares opened 3.3% higher on 2/24…
Continue reading our Conference Call Recap for HD by becoming a Bespoke Institutional subscriber. You can sign up for Bespoke Institutional now and receive a 14-day trial to read our newest Conference Call Recap. To sign up, choose either the monthly or annual checkout link below:
Industry Group Rotation Since the Last Market High
Large-cap US equity indices made their last all-time highs at the end of January on 1/28, which was also the last Fed Day. As of 2/23, the S&P 500 was down about 2% since 1/28, while the mega-cap heavy Nasdaq 100 was down 5%.
Within the broader large-cap Russell 1,000 (R1K), the average stock in the index is down just 0.3% since 1/28. But we’ve seen the market lose about $1.34 trillion in market cap over this time frame. Most of that can be chalked up to the “AI Doom” trade, where groups like Software & Services and Financial Services have been pummeled because of the threat that AI will make them obsolete.
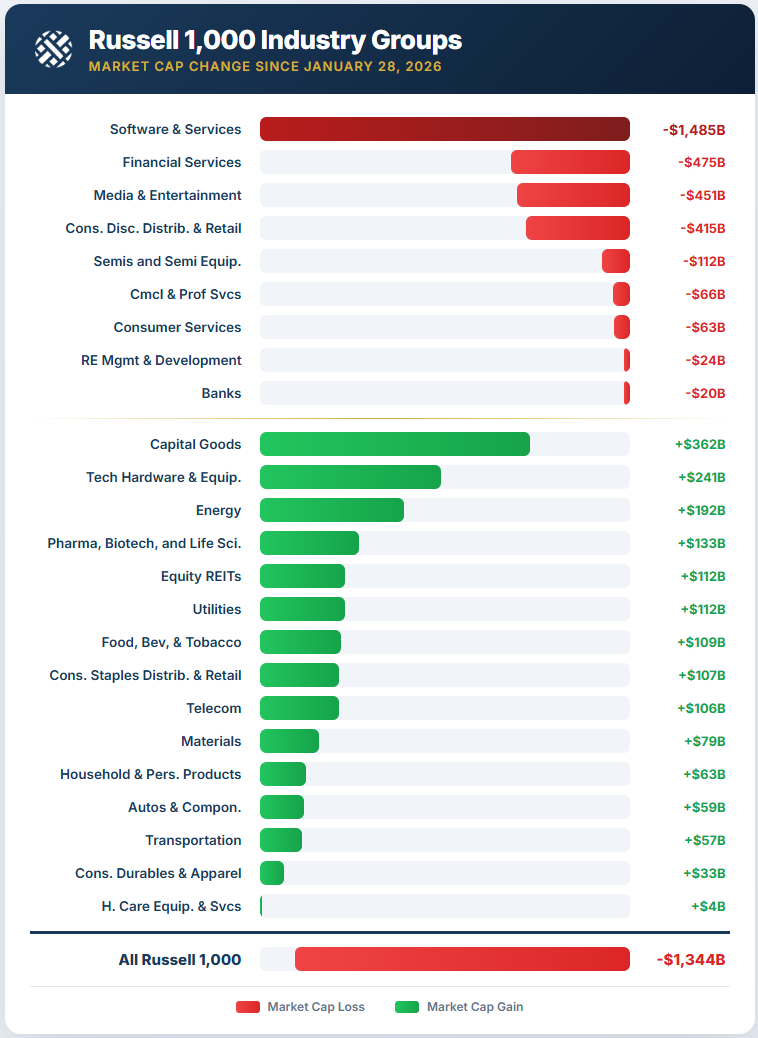
As shown below, Software has seen its market cap fall by nearly $1.5 trillion since 1/28, while Financial Services has fallen nearly $500 billion. Media & Entertainment has also seen a $451 billion drop, followed by Consumer Discretionary Distribution & Retail with a decline of $415 billion.
Combined, these four groups have lost about $2.8 trillion in value.
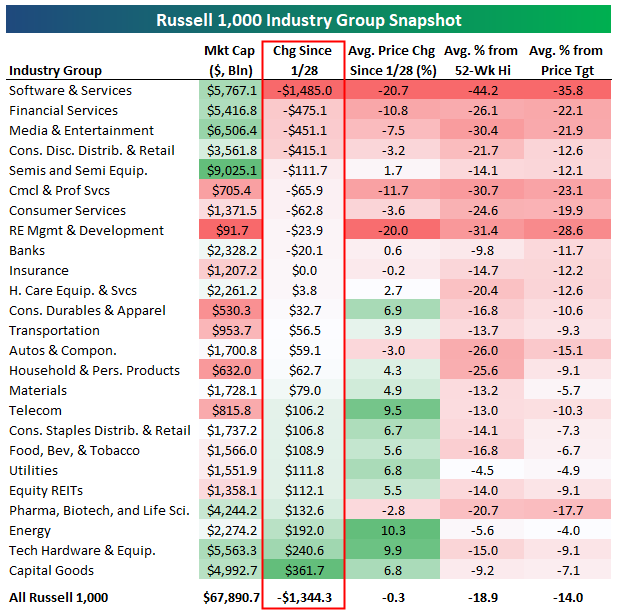
Below are a series of graphics highlighting recent industry group performance.
Some of the groups that have seen the biggest gains in market cap over the same time frame include Capital Goods, Tech Hardware, Energy, and Pharma/Biotech.
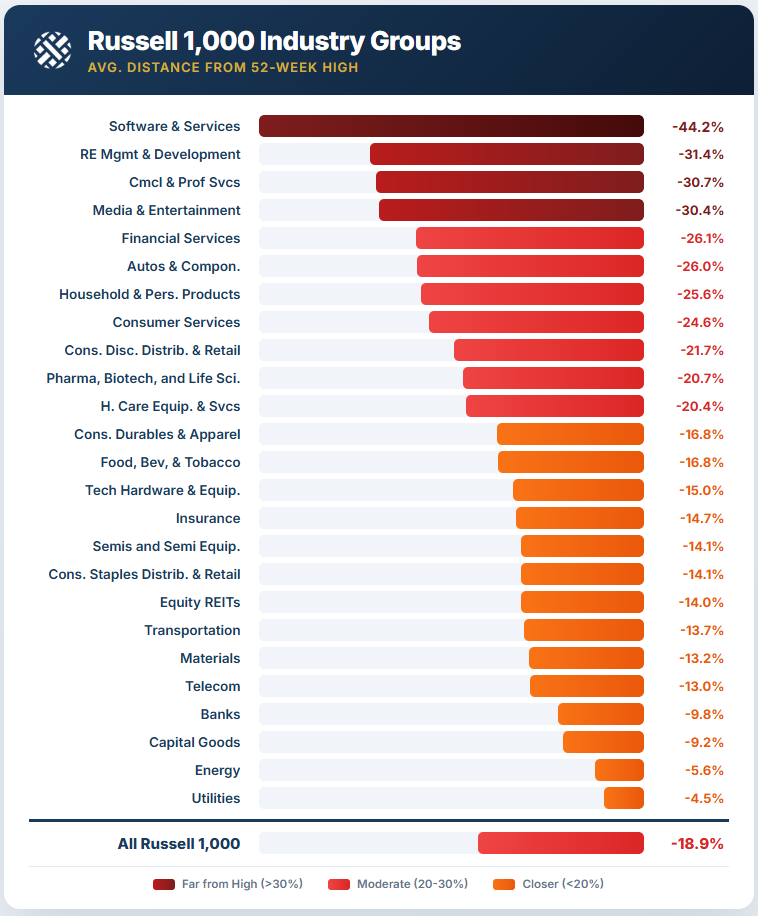
Below is a look at the average stock’s percentage change since 1/28 by industry group. Software and Real Estate Management & Development stocks have easily seen the biggest drops at -20%+.
Nine groups have averaged gains of more than 5%, however.
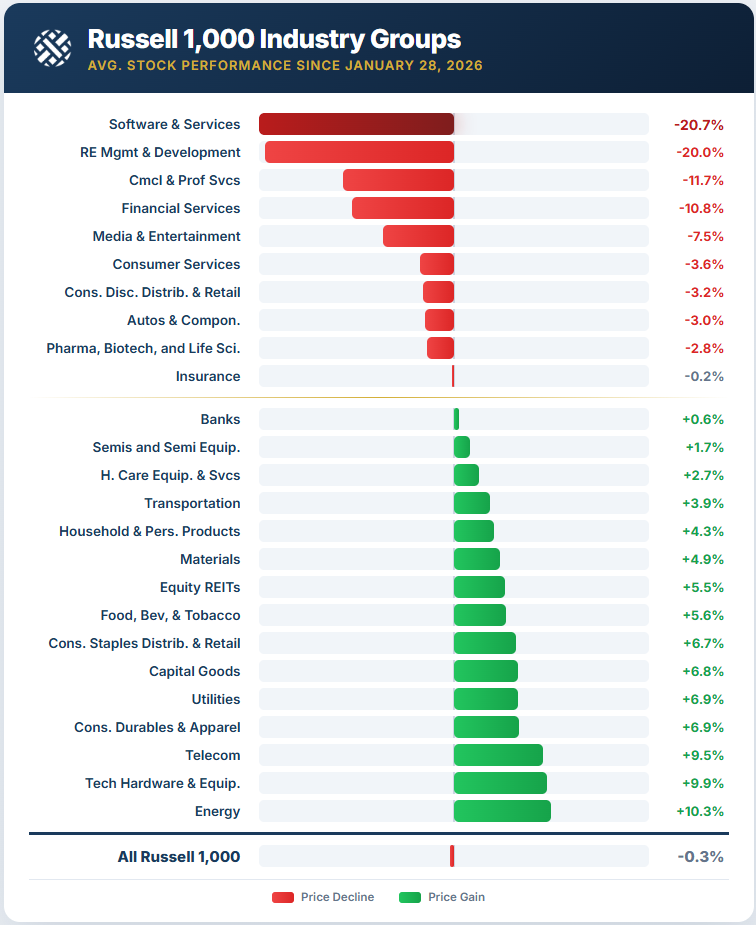
The average Russell 1,000 stock is currently about 19% below its 52-week high. Four groups are at -30%: Software, Real Estate Management & Development, Commercial & Professional Services, and Media & Entertainment. On the flip side, the average Utilities stock is less than 5% from its 52-week high.
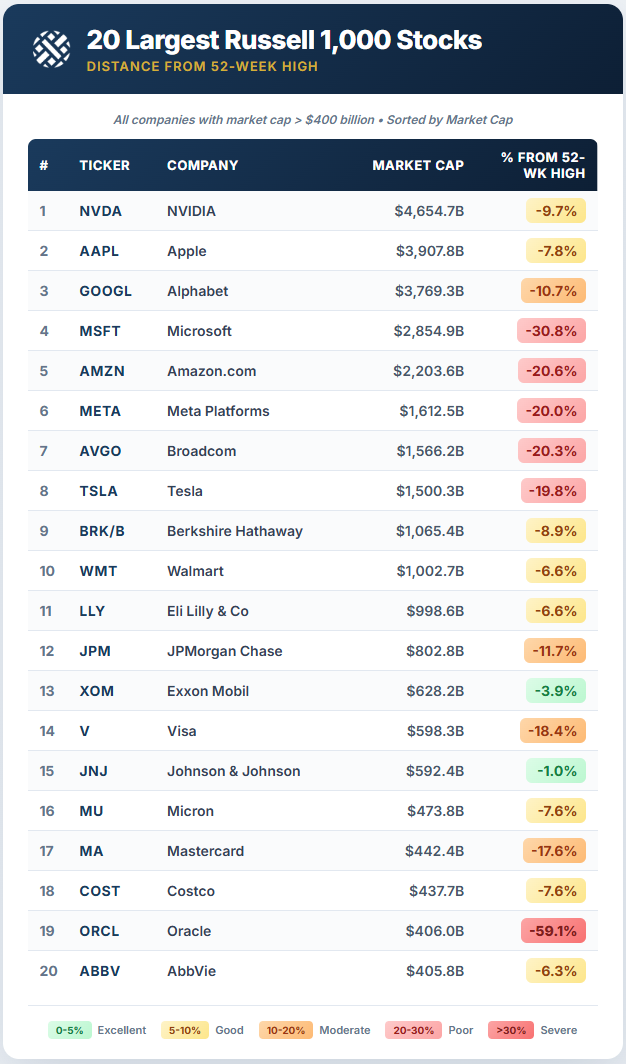
If you’re interested, below is a look at the twenty largest stocks in the Russell 1,000, along with each one’s current distance fromits 52-week high. Of the $1+ trillion companies, Microsoft (MSFT) is in the biggest drawdown at -30.8%, followed by Amazon (AMZN), Meta (META), Broadcom (AVGO), and Tesla (TSLA) – all around -20%. Oracle (ORCL) is the farthest from 52-week highs of the names listed at -59%, while Johnson & Johnson (JNJ) is the closest at just -1%.

Bespoke’s Morning Lineup – 2/24/26 – Worst Snow Day Ever
See what’s driving market performance around the world in today’s Morning Lineup. Bespoke’s Morning Lineup is the best way to start your trading day. Read it now by starting a two-week trial to Bespoke Premium. CLICK HERE to learn more and start your trial.
“I don’t know what happened. It was just euphoria. I can’t even explain what I was feeling, just pure joy.” – Charlie McAvoy

Below is a snippet of commentary from today’s Morning Lineup. Start a two-week trial to Bespoke Premium to view the full report.
After trading uniformly higher earlier, equity futures are mixed this morning, with the S&P 500 fractionally lower, while the Nasdaq is higher. Investors are still reeling from yesterday’s tech sell-off, as markets start to think that AI-disruption will negatively impact just about every business and sector. Treasury yields are little changed, but at 4.03%, the 10-year yield is near the low end of its range. Crude oil is modestly higher but still hovering around $66 per barrel, while gold is down over 1% and Bitcoin is down another 2% and barely hanging on to $63,000.
In Asia, Japan, South Korea, and China were all firmly higher as the latter returned from the Lunar New Year holiday, while India and Hong Kong were both down over 1%. In Europe, trading has been directionless in early trading with the STOXX up 0.2%, but at the country level, performance has varied between gains and losses.
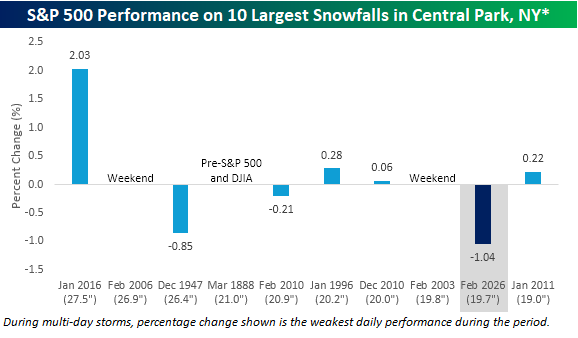
Let’s start with yesterday’s blizzard in the Northeast. With 19.7 inches of snow in New York’s Central Park, it was the ninth-largest snowfall in New York City history. While travel bans were in place around the New York tri-state area, the bears had no trouble getting to work. With the S&P 500 down 1.04%, it was the worst single-day performance for the S&P 500 during one of its ten-largest snowstorms on record. As shown in the chart below, during the prior top ten snowstorms for New York City, the weakest single-day performance during one of these snowstorms was a decline of 0.85% on 12/26/1947.
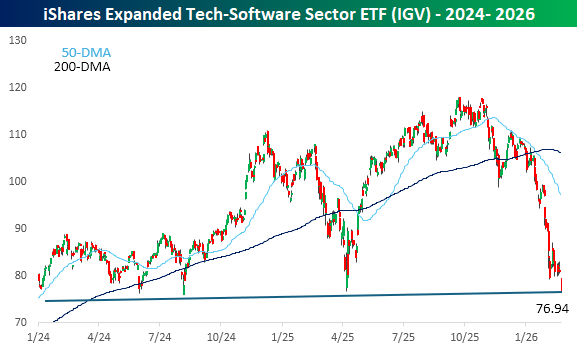
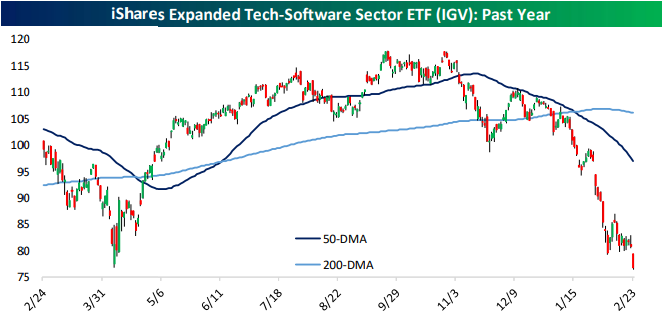
As it has been for some time, the software sector was responsible for much of yesterday’s weakness. The iShares Expanded Tech-Software Sector ETF (IGV) fell close to 5% and to its lowest level on an intraday basis since August 2024 as the lows from earlier this month broke like a hot knife through butter.
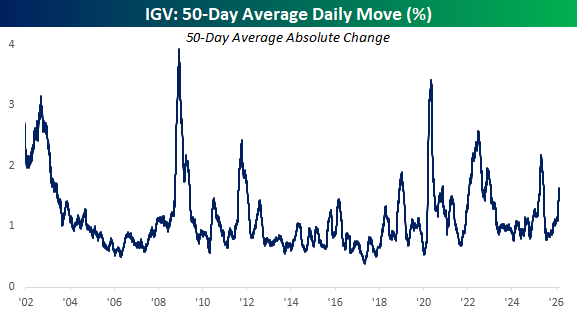
While software has been weak, it hasn’t necessarily been as volatile as you would expect. Over the last 50 trading days, IGV’s average daily change has been a gain or loss of 1.6%. While that’s elevated, it’s hardly anywhere near a historical extreme. Even in early 2025, the average daily change was much higher at over 2%.
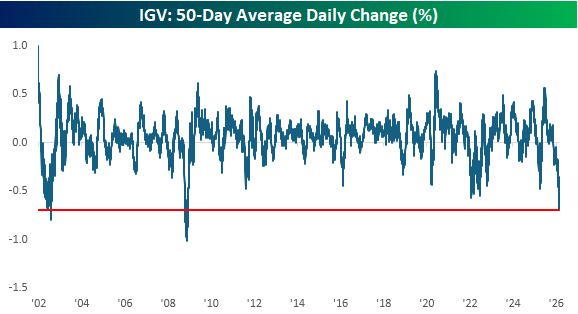
Where the moves in IGV have been extreme, though, is in terms of the average daily percentage change (not the absolute daily change but the average of the trailing 50-day changes). As of yesterday’s close, IGV’s average daily change was a decline of 0.69%, which ranks as one of the most negative readings in the ETF’s history. In fact, the only times that IGV was more of a one-way trade to the downside were during the Financial Crisis and at the end of the dot-com bust.
The Closer – Fedspeak, Software, Scarcity – 2/23/26
Log-in here if you’re a member with access to the Closer.
Looking for deeper insight into markets? In tonight’s Closer sent to Bespoke Institutional clients, we kick off with a review of the latest Fedspeak in addition to all the further pain in software names (pages 1 – 3). Next up, we show where some outperformers were today in addition to an update on regional Fed indices (page 4). After that, we provide a review of the latest positioning data (pages 5 & 6).
See today’s full post-market Closer and everything else Bespoke publishes by starting a 14-day trial to Bespoke Institutional today!
The Triple Play Report: 2/19/26
An earnings triple play is a stock that reports earnings and manages to 1) beat analyst EPS estimates, 2) beat analyst sales estimates, and 3) raise forward guidance. You can read more about “triple plays” at Investopedia.com where they’ve given Bespoke credit for popularizing the term. We like triple plays as an indication that a company’s business is firing on all cylinders, with better-than-expected results and an improving outlook. A triple play is indicative of positive “fundamental momentum” instead of pure fundamentals, and there are always plenty of names with both high and low valuations on our quarterly list.
Bespoke’s Triple Play Report covers what each company does, what this quarter’s results say about their growth outlooks, and their histories of delivering triple plays. Bespoke’s Triple Play Report is available at the Bespoke Institutional level only. You can sign up for Bespoke Institutional now and receive a 14-day trial to read today’s Triple Play Report. To sign up, choose either the monthly or annual checkout link below:
Bespoke Institutional – Monthly Payment Plan
Bespoke Institutional – Annual Payment Plan
Bespoke Investment Group, LLC believes all information contained in these reports to be accurate, but we do not guarantee its accuracy. None of the information in these reports or any opinions expressed constitutes a solicitation of the purchase or sale of any securities or commodities. This is not personalized advice. Investors should do their own research and/or work with an investment professional when making portfolio decisions. As always, past performance of any investment is not a guarantee of future results. Bespoke representatives or clients may have positions in securities discussed or mentioned in its published content.
Rest of World Pulls Ahead
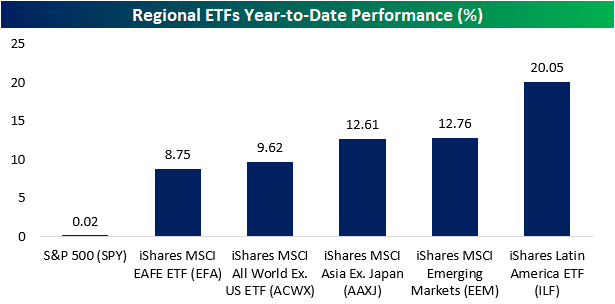
In today’s Morning Lineup, we discussed how the US is experiencing near-historic underperformance relative to the rest of the world so far this year. Obviously, there’s still a lot of time left, considering February isn’t even over yet. However, the US S&P 500 (SPY) is basically unchanged YTD following today’s declines, whereas the rest of the world (ACWX) is closing in on a double-digit gain. Looking at more specific areas, below we show the year-to-date performance of various regional ETFs. As shown, the S&P 500 has been utterly left in the dust. Meanwhile, Asia excluding Japan (AAXJ) is up 12.6%, Emerging Markets (EEM) are up 12.8%, and Latin America (ILF) is up 20% in under two months.
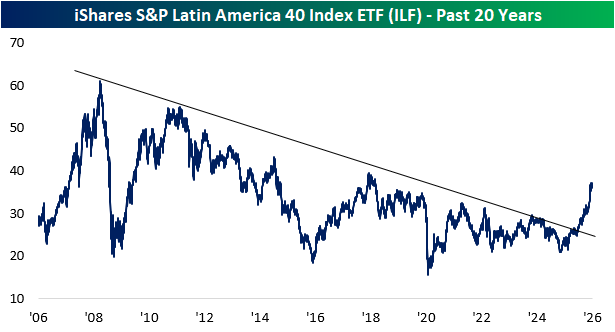
Those big moves this year—some of which are in the context of larger moves across recent months and years—have also resulted in some interesting technical developments. For ILF, the past two decades’ downtrend is now firmly in the rearview as the ETF approaches early-2018 highs.
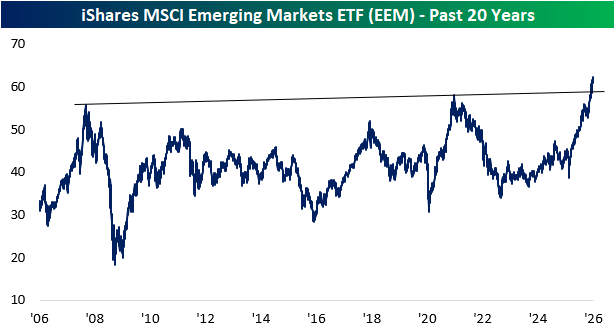
As for EM, the past month has seen that ETF reach some of its first all-time highs since 2021.
Bespoke’s Morning Lineup – 2/23/26 – US Hockey Picks Up the Slack of US Stocks
See what’s driving market performance around the world in today’s Morning Lineup. Bespoke’s Morning Lineup is the best way to start your trading day. Read it now by starting a two-week trial to Bespoke Premium. CLICK HERE to learn more and start your trial.
“I don’t know what happened. It was just euphoria. I can’t even explain what I was feeling, just pure joy.” – Charlie McAvoy
Below is a snippet of commentary from today’s Morning Lineup. Start a two-week trial to Bespoke Premium to view the full report.
Confusion regarding the state of global trade following Friday’s Supreme Court decision striking down the President’s reciprocal tariffs has futures lower to kick off the week. The fact that some form of armed conflict with Iran looks increasingly likely also hasn’t helped. As if that weren’t enough, while the blizzard in the northeast doesn’t have any direct market impact right now, it has effectively paralyzed a central area of economic activity for the day, and air traffic, so it will have some economic impact as well. Crude oil is fractionally higher at close to $67 per barrel; gold is up 2% and looks to be making a new run at its January highs; and silver is up over 5%. Bitcoin, however, is down 2% as some investors are starting to question whether it’s even an effective store of value anymore.
Overnight in Asia, China remains closed for the Lunar New Year, and Japan is also closed, but South Korean stocks traded up nearly 1%, which nowadays doesn’t even register as an impressive move. In Europe, the STOXX 600 is down modestly in a mixed session where Italy and Spain are both up roughly 1% while Germany dips about 0.5%. The disparate performances stem from strength in banks and weakness in industrials (more German-focused).
Datawise, there’s not a lot on the calendar today. At 8:30, we got the Chicago Fed National Activity Index. That will be followed by Factory Orders at 10, and the Dallas Fed at 10:30. Fed Governor Waller is also speaking this morning, and he’s on the wires saying that a March rate cut will depend on the state of the labor market, which he sees as likely remaining weak going forward, citing potential pressures from AI.
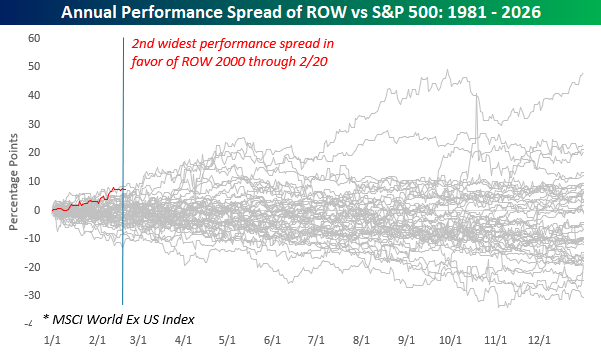
The US is on top of the hockey world this morning after Sunday’s dramatic OT win, and investors are hoping some of those gold-medal vibes rub off on the stock market. As we highlighted in Friday’s Bespoke Report, through the first several weeks of 2026, US stocks have underperformed stocks from the rest of the world to a near-historic degree. As shown in the chart below, the only year since 1980 when the S&P 500 underperformed the rest of the world by a wider margin was in 1984, and barely at that.
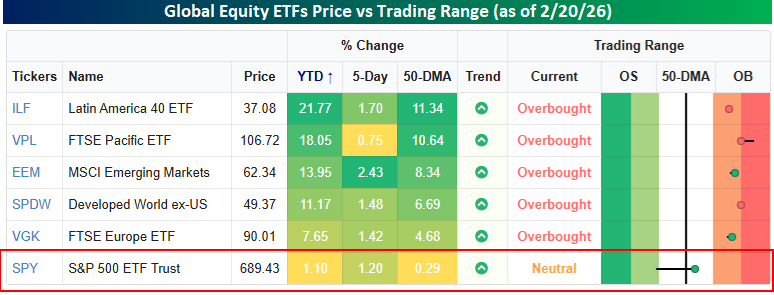
The graphic below puts the short-term US underperformance into even better perspective. Major international regional equity ETFs headed into the weekend on power plays at overbought levels (1+ standard deviation above their 50-DMAs), while the US was short-handed in penalty-killing mode and scrapping to get back above its 50-day moving average. YTD, European equities, as measured by the FTSE Europe ETF (VGK) were outperforming the S&P 500 by more than six full percentage points, but the other four regional ETFs shown were all outperforming by at least 10 full percentage points, with Latin America (ILF) outperforming by 20 percentage points – in less than two months! How the lines have shifted!
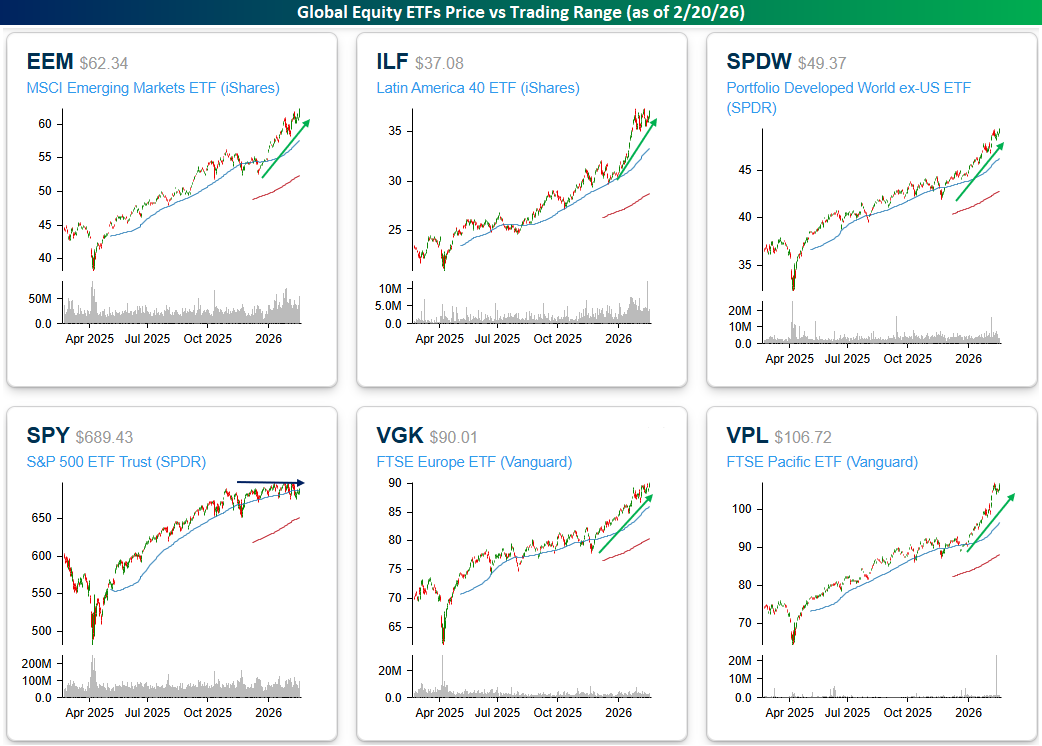
A look at the six price charts also shows the disparity between US and international stocks. Five of the charts shown are in clear, well-defined uptrends, while the US has been stuck in neutral between the blue lines, unable to push the puck into the zone, but also successfully fighting off any bearish attacks into their defensive zone.
Brunch Reads – 2/22/26
Welcome to Bespoke Brunch Reads — a linkfest of some of our favorite articles over the past week. The links are mostly market-related, but there are some other interesting subjects covered as well. We hope you enjoy the food for thought as a supplement to the research we provide you during the week.
Do You Believe in Miracles?: Today is the gold medal game for the men’s ice hockey tournament at the 2026 Olympics. So, in the spirit of that, we have to revisit a monumental event in 1980 that took place on this day in Lake Placid, New York. A group of American college hockey players led by coach Herb Brooks, defeated the heavily favored Soviet Union national ice hockey team 4–3 in a game that became known simply as the “Miracle on Ice.” It was not the gold medal game, but it was the moment that defined those Olympics.
The Soviet team had dominated international hockey for nearly two decades in the build-up to the Miracle on Ice, winning four of the previous five Olympic gold medals and routinely dismantling NHL competition in exhibitions. Just months earlier, they had beaten the US 10–3 at Madison Square Garden. In contrast, the American roster was the youngest in the tournament, composed largely of amateur and collegiate players. Keep in mind, NHL players were not allowed to play in the Olympics at the time under a strict amateur-only rule. The Soviets got around this rule by sending players who were technically employed in other professions but played hockey full-time in the well-oiled machine that was USSR hockey, unlike anything the world had seen.
The stakes extended well beyond hockey. The Cold War framed everything. The Soviet Union had invaded Afghanistan weeks earlier. The US faced economic anxiety and the ongoing Iran hostage crisis. President Jimmy Carter was threatening a boycott of the upcoming Moscow Summer Olympics. When the puck dropped, the expected script seemed ready to unfold. The Soviets controlled possession and fired relentlessly at American goaltender Jim Craig. But the US answered each Soviet goal, keeping the score within reach. In the third period, with the score tied 3–3, captain Mike Eruzione found the net to give the Americans a 4–3 lead.
As the final seconds ticked away, broadcaster Al Michaels delivered a line that would echo through sports history: “Do you believe in miracles? YES!” In the realm of sports, it was certainly a miracle for a team of amateurs to defeat a state-sponsored powerhouse, but it also felt especially important in the context of the Cold War that a hockey game in upstate New York could bear so much weight. Two days later, the USA defeated Finland to secure the gold medal.
In 2004, Disney retold the story in the film Miracle, starring Kurt Russell as Herb Brooks. The movie reintroduced the discipline, tension, and improbable triumph of Lake Placid to a new generation, cementing the game’s place in American memory.

AI & Technology
An AI Agent Published a Hit Piece on Me – More Things Have Happened (The Shamblog)
A developer who rejected an AI agent’s code contribution to a popular Python library was targeted by a personalized, AI-written hit piece designed to shame him into accepting the changes, and a quarter of online commenters actually sided with the bot. The deeper concern isn’t about AI in open source, it’s that autonomous agents can now research individuals, publish convincing defamatory content at scale, and do it all without any traceable human accountability. [Link]
Continue reading our weekly Brunch Reads linkfest by logging in if you’re already a member or signing up for a trial to one of our two membership levels shown below! You can cancel at any time.

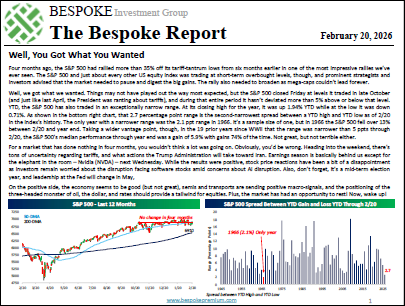
The Bespoke Report – 2/20/26 – Well, You Got What You Wanted
Four months ago, the S&P 500 had rallied more than 35% off its tariff-tantrum lows from six months earlier in one of the most impressive rallies we’ve ever seen. The S&P 500 and just about every other US equity index was trading at short-term overbought levels, though, and prominent strategists and investors advised that the market needed to pause and digest the big gains. The rally also needed to broaden as mega-caps couldn’t lead forever.
Well, we got what we wanted.
Read this week’s Bespoke Report newsletter and gain access to the rest of our product suite with a Bespoke trial. CLICK HERE or on the image below to proceed.