The Bespoke Report – 12/5/25 – Finishing Where We Started
To read our weekly Bespoke Report newsletter and access everything else Bespoke’s research platform offers, start a two-week trial to Bespoke Premium.
The first full week of December was modestly positive, but what really added to the good feelings was a blackout of Federal Reserve speakers.
Futures currently price a 95% chance of a 25-basis point (bps) rate cut at Wednesday’s meeting, which is essentially the exact same as in late October. Given the lack of significant official economic data during this period, the stability in expectations makes logical sense. Without fresh data, how could Federal Open Market Committee (FOMC) members really change their outlook? Sometimes, though, what experts at the Fed —or elsewhere—say doesn’t fully make sense.
Expectations for Wednesday’s meeting haven’t changed from point to point, but the interim saw some dramatic shifts in sentiment, swinging from “they will cut” to “they won’t cut” and back to “they will cut.” Just over two weeks ago, market pricing for a cut at Wednesday’s meeting had dropped significantly to 34%. Accompanying these shifts in sentiment were major swings in stock prices. All of the major index ETFs we track in our Trend Analyzer went from overbought to oversold and back to overbought, driven almost entirely by the words of various Fed officials rather than any fundamental shifts in the US economy. Perhaps Scott Bessent was correct when he said this week, “I think it’s time for the Fed to just move back into the background like it used to do, calm things down, and work for the American people, set monetary policy on a good path…This isn’t sport, it’s people’s lives.”
This week’s Bespoke Report is packed with interesting market trends, so give the full report a read by starting a trial here.

Bespoke’s Morning Lineup – 12/5/25 – Cheers!
See what’s driving market performance around the world in today’s Morning Lineup. Bespoke’s Morning Lineup is the best way to start your trading day. Read it now by starting a two-week trial to Bespoke Premium. CLICK HERE to learn more and start your trial.
“What America needs now is a drink.” – Franklin Roosevelt, 12/5/33

Below is a snippet of commentary from today’s Morning Lineup. Start a two-week trial to Bespoke Premium to view the full report.
It’s been a modestly positive week already, and futures are looking to modestly add to those gains with the S&P 500 up 0.20% and Nasdaq futures pointing to a gain of 0.3%. Bond yields are marginally higher on the day ahead of important (but stale) inflation data, and the 10-year yield is just below 4.12%. Crude oil and gold are little changed, but silver prices are up another 1.5% while copper is up just over 1%. Lastly, crypto prices are lower across the board, but the losses are contained at just 1.3% for Bitcoin.
In Asia, the Nikkei fell 1.1% but still managed to finish the week up 0.5% as yields at the long end of the curve continue to hit multi-year highs. Outside of Japan, though, other indices in the region are trading higher, finishing in positive territory for the week.
European stocks are higher across the board again this morning. The STOXX 600 is poised to close out the week with a gain of nearly 1%, while German stocks lead the region higher as factory orders rose more than expected. Q3 GDP for the entire Eurozone also rose slightly more than expected (0.3% vs 0.2% forecast).
It may have been a Tuesday, but for many Americans, December 5, 1933, probably felt like a Friday. Earlier in the day, Pennsylvania and Ohio had already ratified it, but at 5:32 PM Eastern time, the state of Utah became the 36th state to ratify the 21st Amendment. The amendment repealed the 18th Amendment, and with Utah’s passage, the 21st Amendment achieved the three-fourths majority required for it to become law, ending the nearly 14-year period of national Prohibition in the United States.
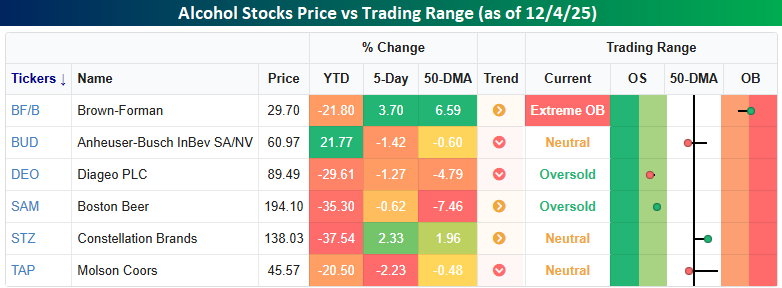
Liquor and tobacco stocks have historically been considered recession-proof investments for most of the last 100 years. However, in the last few decades, tobacco stocks have fallen out of favor due to escalating health concerns and heavy government regulation. In recent years, many of the same pressures surrounding tobacco have begun to affect the stocks of alcohol companies. Between emerging health concerns, the proliferation of GLP-1 treatments that suppress the urge to drink, and the rising popularity of cannabis, alcohol stocks have been taking punches from multiple directions.
As the snapshot illustrates, the majority of major alcohol purveyors have experienced significant Year-To-Date (YTD) declines, with most falling over 20%. While Anheuser-Busch InBev (BUD) may appear to be an outlier and is not down by the same extent, the broader trend is one of sharp underperformance across the sector. More recently, individual stock performance has been mixed: Brown-Forman (BF/B) has seen a multi-week rally, and Constellation Brands (STZ) is also currently trading marginally above its 50-day moving average (50-DMA).
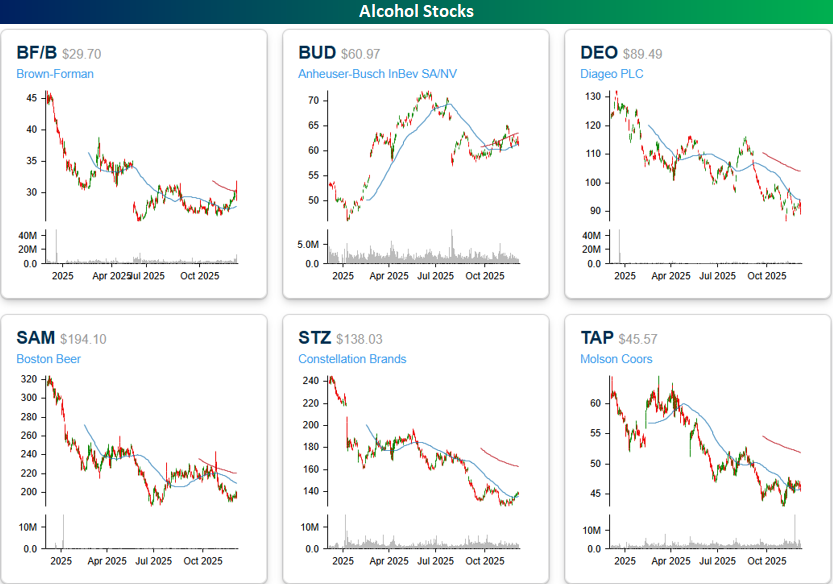
The one-year charts of these six stocks are a sobering picture of underperformance, making you want to grab a drink and drown your sorrows rather than celebrate. Even BUD, while up YTD, is down sharply off its high, but the other five stocks remain mired in steep downtrends.
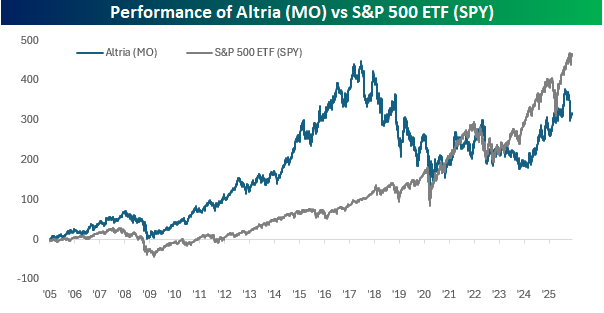
Finally, just because tobacco stocks have fallen out of favor, you could have done worse. As shown in the chart below, from a price perspective, shares of Altria (MO) underperformed the S&P 500, but not by a ton. What the price chart doesn’t account for is dividends. MO has a much larger dividend than the S&P 500, and when you take those dividends into account since the start of 2005, they add up. Had you reinvested dividends back into the stock, MO’s total return would have been over 1,300% compared to a total return of 730% in the S&P 500. Whatever you think of tobacco stocks and their impact on the health of the population, investing in them over the last twenty years has been anything but putting your money up in smoke. See you all at 5:32!
The Closer – Fed Risks, Claims, Sentiment’s New High – 12/4/25
Log-in here if you’re a member with access to the Closer.
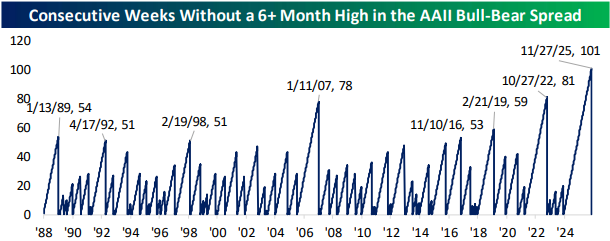
Looking for deeper insight into markets? In tonight’s Closer sent to Bespoke Institutional clients, we start with some commentary regarding the setup of the FOMC and its independence (page 1). We then take a look at jobless claims and some potential reasons for the sharp move this week (page 2). We close out with a dive into AAII sentiment reaching the most bullish reading in nearly a year (page 3).
See today’s full post-market Closer and everything else Bespoke publishes by starting a 14-day trial to Bespoke Institutional today!
Bespoke’s Morning Lineup – 12/4/25 – That’s What You Call Volatile
See what’s driving market performance around the world in today’s Morning Lineup. Bespoke’s Morning Lineup is the best way to start your trading day. Read it now by starting a two-week trial to Bespoke Premium. CLICK HERE to learn more and start your trial.
“It’s not the pace of life I mind. It’s the sudden stop at the end.” – Thomas Hobbes
Below is a snippet of commentary from today’s Morning Lineup. Start a two-week trial to Bespoke Premium to view the full report.
There’s very little going on in futures trading this morning as the S&P 500 and Nasdaq are both indicated to open ever so slightly higher. Treasury yields, meanwhile, are moving up about 3 bps across the curve, with the 10-year yield up near 4.10%. Crude oil is modestly higher, up 0.7%, but the big move remains in the natural gas space as prices are now above $5 for the first time in close to three years. In the metals space, gold and other precious metals are all lower, but the losses are contained at less than 1%. Even the crypto space is quiet as Bitcoin, Ethereum, and Solana are all up or down less than 1%.
In Asia, equities were mixed. While South Korea and China were marginally lower, Hong Kong finished up 0.7% while Japan surged 2.3%. Two catalysts behind the move were a strong 30-year JGB auction and a rally in tech stocks. Shares of Softbank rallied more than 9% following reports that it plans to increase its investment in OpenAI before the end of the year.
European stocks have been trading broadly positive this morning. The STOXX 600 is up 0.4%, and every major country’s benchmark index is trading up on the day. Germany is leading the way higher, up 0.8% as auto stocks rally following yesterday’s announcement from the Trump Administration that it would lower fuel-efficiency standards. Italy and the UK, however, are just barely hanging on to gains of 0.1%. In economic data, Retail Sales for the Eurozone were unchanged in October, and slightly higher than expected on a y/y basis (1.5% vs 1.4% forecast).
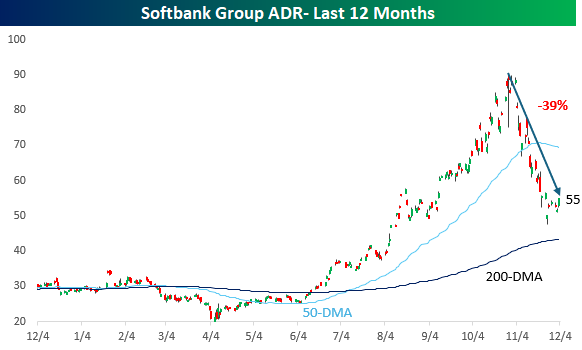
Getting back to Softbank, shares rallied 9% overnight, following a 6% gain on Wednesday. The chart below shows the performance of Softbank ADRs over the last year, and the last three months have been, to put it mildly, a roller coaster. Heading into today’s session, the stock is down 39% from its high in late October. Yet, despite that plunge, it was still 26% above its 200-DMA and 4% above where it closed 3 months ago. It’s hard to remember a stock that has plunged that much over six weeks, yet was still well above its long-term moving average and positive over the last three months.
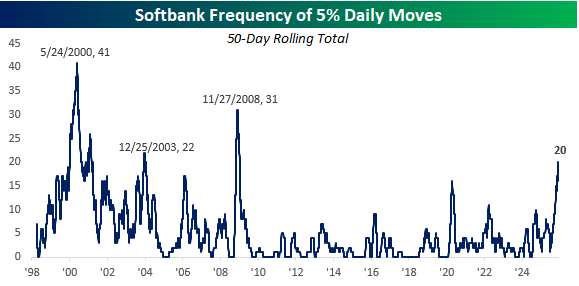
The volatility in Softbank is also evident in the day-to-day moves of Softbank stock. With last night’s 9% rally, the stock has now moved 5% or more in 20 of the last 50 trading days. To find a period where the stock saw more volatility in its day-to-day moves, you have to go back to November 2008. In the stock’s entire history, there have only been three periods when the stock had more 5% daily moves in a 50-trading-day span. The other two were in December 2003 and May 2000, when there were 41 in 50 trading days! It’s not like Softbank is a small-cap stock either. With a market cap of over $150 billion, it’s the fourth-largest stock in the Nikkei 225!
The Closer – Consumer Check, Growth vs. Value, Cold Start – 12/3/25
Log-in here if you’re a member with access to the Closer.
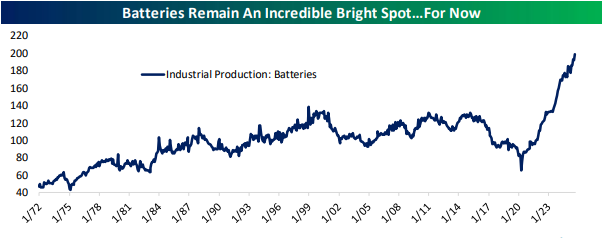
Looking for deeper insight into markets? In tonight’s Closer sent to Bespoke Institutional clients, we begin with a look into a handful of baskets (page 1) in addition to the outperformance of value versus growth (page 2). Next, we offer a look into the latest string of cold weather and what that means for natural gas (page 3). After that, it’s a dive into the latest ISM (page 4) and S&P Global PMI data (page 5) before closing out with reviews of industrial production (page 6) and some earnings (page 7).
See today’s full post-market Closer and everything else Bespoke publishes by starting a 14-day trial to Bespoke Institutional today!
Bespoke’s Morning Lineup – 12/3/25 – Nvidia Sits This Rally Out
See what’s driving market performance around the world in today’s Morning Lineup. Bespoke’s Morning Lineup is the best way to start your trading day. Read it now by starting a two-week trial to Bespoke Premium. CLICK HERE to learn more and start your trial.
“Sometimes reality is too complex. Stories give it form.” – Jean Luc Godard
Below is a snippet of commentary from today’s Morning Lineup. Start a two-week trial to Bespoke Premium to view the full report.
To view this morning’s Squawk Box interview, please click the image below.
Yesterday was a true turnaround Tuesday as the S&P 500, Nasdaq, and even Bitcoin erased most, if not all, of Monday’s declines. This morning, risk assets continued to move higher as the S&P 500 and Nasdaq both look to open 0.2% higher while Bitcoin tests $93K. Gold and other metals are also up 0.5% to 1%, and even crude oil is up 1% and back above $59 per barrel. Treasury yields are also moving lower for the second day in a row, with the 10-year yield back down to 4.06%.
After being starved of economic data for several weeks, this morning we’ll get ADP Employment and PMI readings for the services sector, both current reports. In addition, the backlog of data will continue to ease as September reports covering Import Prices (8:30), Industrial Production (9:15), and Capacity Utilization (9:15) will also hit the tape.
In Asia overnight, the Nikkei rallied over 1% as Hong Kong fell 1% while South Korea added on another 1.0% after Q3 GDP came in higher than expected (1.3% vs 1.2% q/q). In Europe, the picture is more muted as the STOXX 600 gains 0.2%, and the only other countries moving up or down 0.2% or more are Italy (+0.5%) and Spain (+1.5%). Europe’s gains come as PMI reading for the services sector generally surprised to the upside. The only exception was Spain, which ironically is also the country with the largest gain on the day so far.
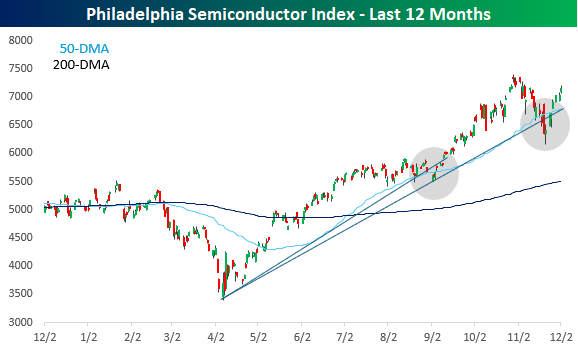
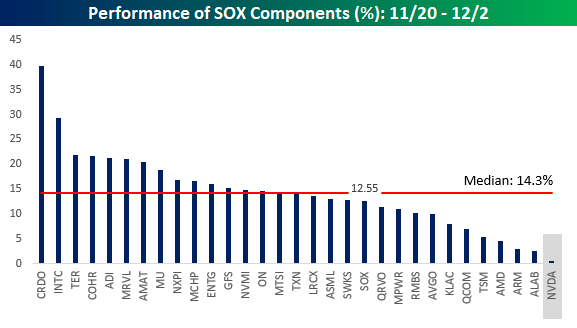
In last night’s Closer, we highlighted multiple equity baskets, which shed some light on how the economy is doing, and their performance is especially important given the lack of official economic data. Another index we follow closely as a gauge of the economy is semiconductors, which, many years ago, we branded the transports of the 21st century. When semis rally and outperform the market, it usually serves as a confirmation of a rally in the broader market and economy. Conversely, when semis falter and underperform, it serves as a red flag.
As shown in the chart below, the Philadelphia Semiconductor Index (SOX) has performed extremely well since the April low. In retrospect, it’s been a smooth ride higher, although there were two speed bumps – in September and just recently – where the trend higher and the 50-DMA was briefly violated. In the moment, both pullbacks felt concerning, but as semis recovered, the selloffs were chalked up to consolidation. The SOX isn’t out of the woods yet, but through yesterday’s close, it was less than 3% from a new high.
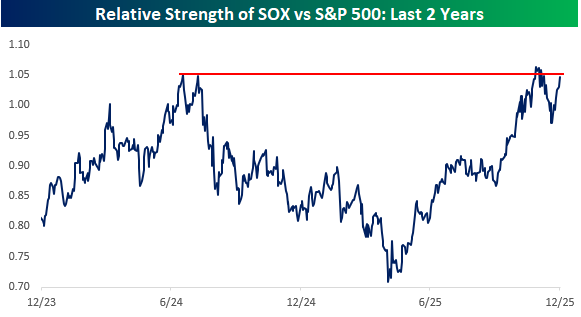
On a relative strength basis, semis have also bounced back nicely. In late October and early November, the relative strength of the SOX briefly made a new high, and now just seven trading days after the recent low, it’s back within a 3% range of that high.
What really stands out about the rally in the SOX off the closing low on 11/20 is the breadth. Since the low, every stock in the index has traded higher, and the median gain has been 14.3%. What’s most impressive, though, is that Nvidia (NVDA) has sat out the rally with a gain of just 0.45% making it the worst-performing stock in the index. NVDA is the largest stock in both the SOX (by a wide margin) and the S&P 500, and during a period when it has essentially been flat, the two indices rallied 12.55% and 4.44%, respectively. It looks like the market can, in fact, rally without NVDA.
The Closer – Planes, Trains, and Automobiles – 12/2/25
Log-in here if you’re a member with access to the Closer.
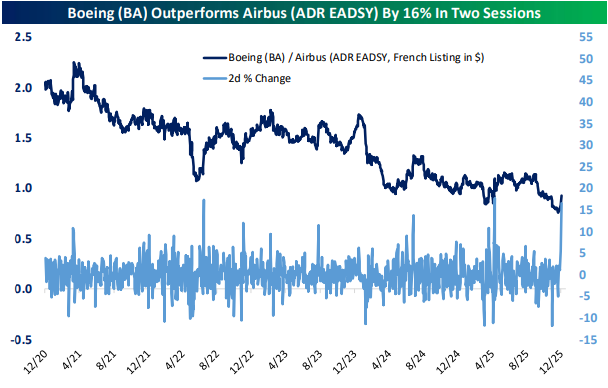
Looking for deeper insight into markets? In tonight’s Closer sent to Bespoke Institutional clients, we start with a look into some valuation metrics for the crypto treasury company Strategy (MSTR) (page 1) followed by a look into the historic strength of Boeing (BA) relative to Airbus (EADSY) (page 2). Next, we pivot into auto sales (page 3) before closing out with a dive into a handful of baskets (page 4) in addition to the Logistics Managers Index and related stocks (pages 5 and 6).
See today’s full post-market Closer and everything else Bespoke publishes by starting a 14-day trial to Bespoke Institutional today!
Early Christmas Gift: Gas Prices Below $3
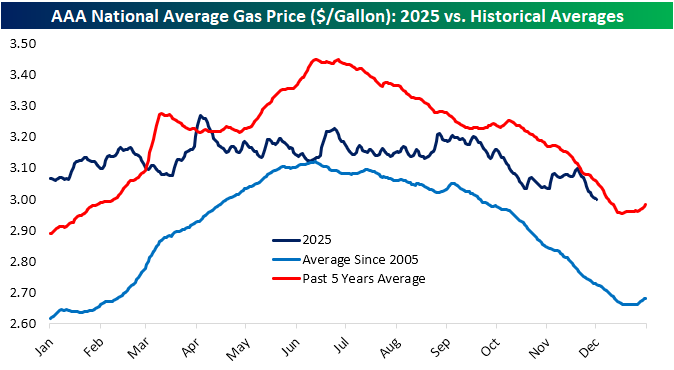
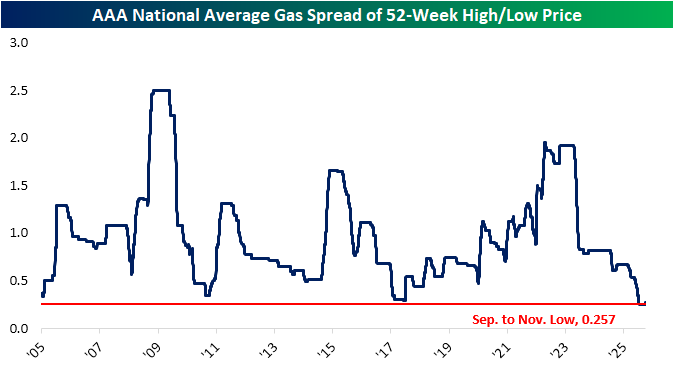
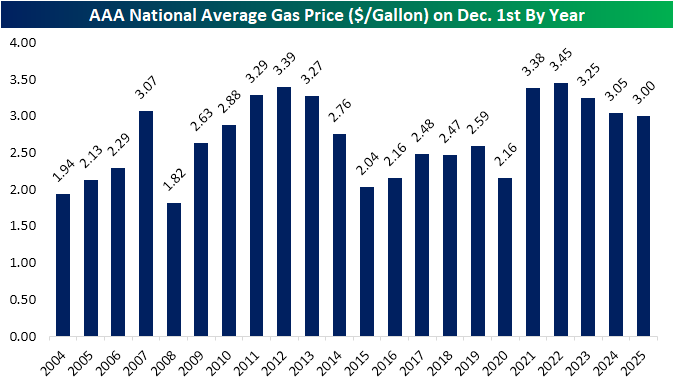
Christmas has come early for the American consumer as the national average for a gallon of gasoline according to AAA fell fractionally below $3 yesterday for the first time since May 2021. As shown below, gas prices have been muted this year with far smaller swings than has been the case for most of the past few years (more on this below). Over the past year, prices have remained in the low $3 range with the the highest price attained being $3.27 in early April. It’s now at $2.99/gallon.
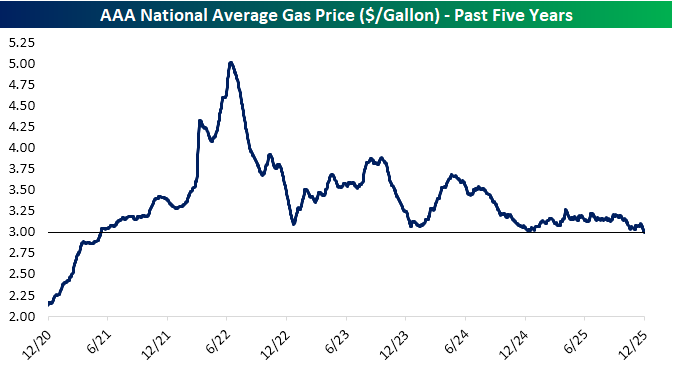
The usual seasonal pattern for gas prices – which has been historically consistent with a ramp higher in the first half of the year followed by declines in the second half – has been less pronounced this year. Prices traded flat through September and have been trending lower since.
Prior to this week’s fresh low below $3/gallon, there had only been a 25.7 cent difference between the past year’s high and low price, which is the smallest high/low spread on record for the AAA series dating back to 2005.
At current levels, prices are down 5 cents versus one year ago. 2025 is now the third year in a row with a lower price of gas year-over-year as of December 1st, although we saw prices in the low to mid-$2 range in the second half of the 2010s.
While the narrative for much of 2025 has been “uncertainty” for the consumer, gas prices have been extremely stable and are now back in the $2s as we enter the peak of the holiday shopping season.

Historic Health Care Relative Strength
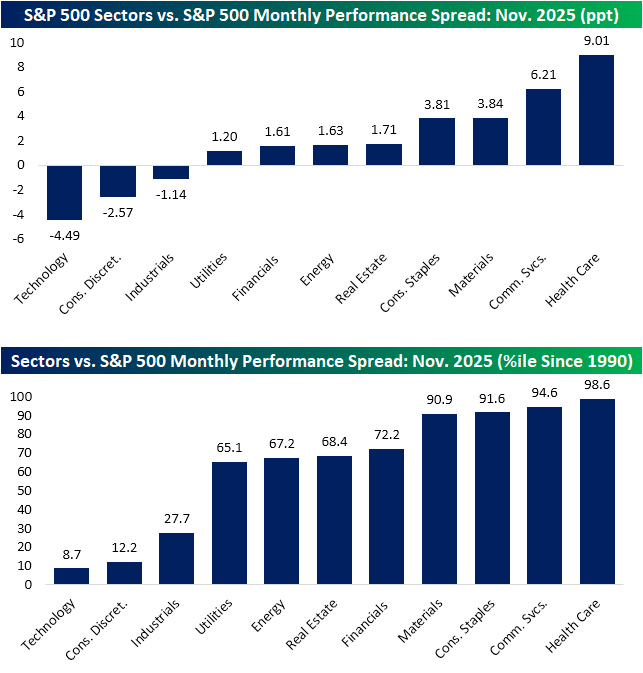
While stocks are getting off to a quiet start to December, the S&P 500 staged a solid recovery in the final week of November to manage a modest 13 bps gain on the month. Below, we show the performance spread of each S&P 500 sector versus the overall index in November. As shown, a majority of sectors actually outdid the index during the month with only Technology, Consumer Discretionary, and Industrials having underperformed. Tech in particular was a significant underperformer given it’s oversized weight; the monthly performance spread ranked in the bottom decile of all months since 1990. Conversely, Materials, Consumer Staples, Communication Services, and Health Care’s performance relative to the S&P 500 ranked in the top decile for all months since 1990. Health Care beat the S&P by nine percentage points in November, which was in the 98th decile for all months since 1990.
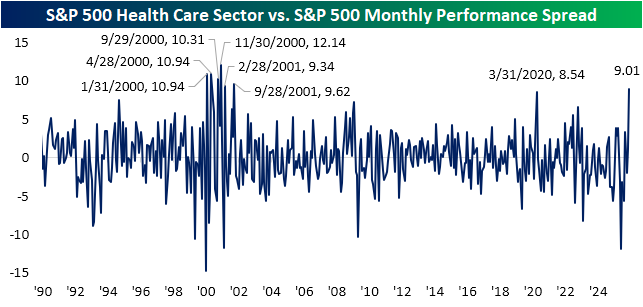
As shown below, it has been exceptionally uncommon for Health Care to outperform the broader market by such a wide degree. The last time the sector’s one-month outperformance was nearly as strong was in March 2020 when it outpaced the S&P 500 by a slightly smaller 8.54 percentage points. Prior to that, the only period with 9 percentage points or more like this November was a string of months in 2000 and 2001. Additionally, we would note that this latest big month for Health Care came only six months after one of its worst months on record versus the broad market; in May the sector fell 5.7% versus the S&P 500’s gain of 6.2%.
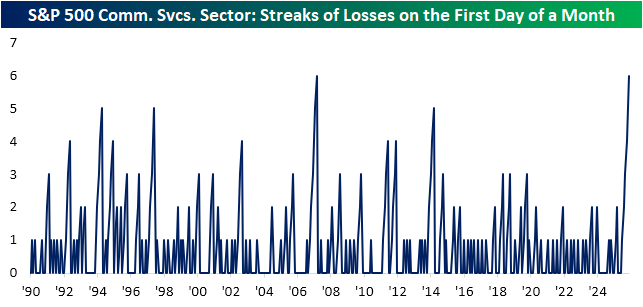
Health Care fell almost 1.5% yesterday to start off December and is again weak today. That was the sector’s first decline on the first trading day of a month since May. As shown below, that ends the longest streak of daily gains on the first day of a month since a seven month long streak ending in July 2017.

Switching over to a different sector, Communication Services also fell yesterday with an over 1% decline. That extends a losing streak of declines on the first day of a month to six months. Given the sector reshuffling in 2018, Communication Services has a different makeup today than it did in the years prior to the reshuffling. With that caveat in mind, there has only been one other period in which it fell on the first day of a month each month for half a year: October 2006 through March 2007.
Bespoke’s Morning Lineup – 12/2/25 – Code Red
See what’s driving market performance around the world in today’s Morning Lineup. Bespoke’s Morning Lineup is the best way to start your trading day. Read it now by starting a two-week trial to Bespoke Premium. CLICK HERE to learn more and start your trial.
“Colonel Jessup! Did you order the Code Red?!” – Lieutenant Daniel Kaffee, A Few Good Men
Below is a snippet of commentary from today’s Morning Lineup. Start a two-week trial to Bespoke Premium to view the full report.
Silicon Valley is abuzz this morning following reports that OpenAI CEO Sam Altman declared a ‘code red’ on Monday as competition from Google and Anthropic intensifies. To fight the threats, initiatives like an advertising model, AI agents, and a personalized “Pulse” service for individual users have been temporarily put on hold. This latest story is just another example of how quickly the currents can change in the AI space, and that no one’s lead is safe.
Going back to the internet era, remember the ‘browser wars’? Google Chrome now dominates the browser space with about 70% market share, but you may find it hard to believe that it wasn’t released until 2008, more than eight years after the Internet bubble burst! There’s still a lot of runway left in the battle for AI supremacy.
US stocks started off December with broad-based declines as the S&P 500 fell 0.5%, but the Dow fared worse, falling nearly 1% as the Nasdaq outperformed, falling just 0.38 as Nvidia’s 2% gain propped that index up. The real area of weakness, though, was in the small-cap Russell 2000, which fell 1.25%. So much for the broadening trade.
Bulls started off the overnight session looking to put up a fight as S&P 500 futures rally 0.25% while the Nasdaq looks to open 0.38% higher. Crude oil is down fractionally as it wasn’t able to trade back above $60 in yesterday’s rally, while gold falls 1%, silver plunges 2%, and platinum falls even more (-2.38%). Crypto had a rough start to December, but has bounced back over 2% this morning, trading back above $87K.
Asian stocks saw mostly muted moves overnight. The one exception was South Korea, as the Kospi rallied nearly 2% following confirmation from US officials that tariffs on exports to the US would be cut to 15%. In Europe, the tone is also positive as the STOXX 600 bounces 0.3% with Germany rallying 0.60%.
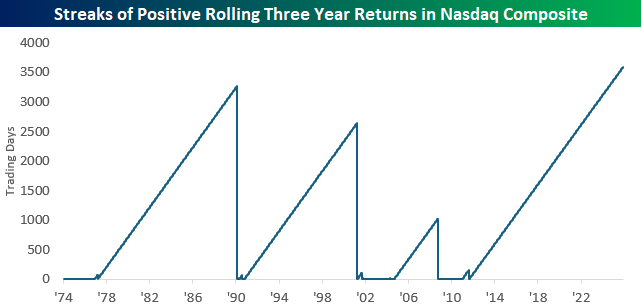
In last night’s Closer, we looked at the performance of the Nasdaq over the three years since the release of ChatGPT and compared that performance to other major tech releases of the last 50 years. Since the launch of ChatGPT in late 2022, the Nasdaq has rallied more than 100% ranking as the strongest three-year return since the period coming out of Covid and the massive tech investment to facilitate the work-from-home era. Outside of that period, the only other three-year period that was stronger was the one coming out of the Financial Crisis.
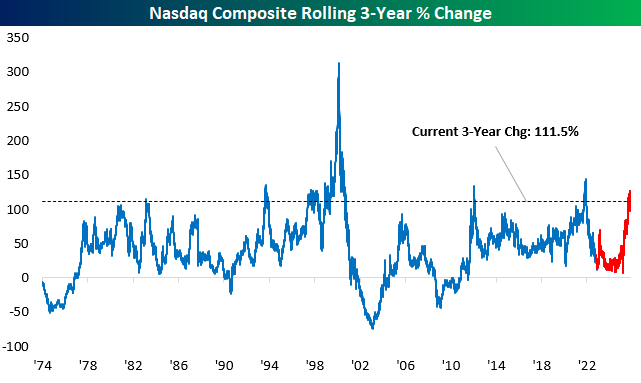
In addition to the massive rally of the last three years, what stood out in the chart was how long it has been since the Nasdaq had a negative rolling three-year return. The last time it was negative was in August 2011, just after S&P downgraded the AAA sovereign US credit rating more than 14 years ago! The chart below shows streaks of positive readings in the Nasdaq’s rolling three-year return, and at a length of 3,590 trading days, the current streak easily ranks as the longest. Besides that, three years ago the Nasdaq was under 11,500, or more than 50% below current levels. In other words, barring a large decline, the current streak of positive three-year returns isn’t going away soon.