The Triple Play Report — 12/10/25
An earnings triple play is a stock that reports earnings and manages to 1) beat analyst EPS estimates, 2) beat analyst sales estimates, and 3) raise forward guidance. You can read more about “triple plays” at Investopedia.com where they’ve given Bespoke credit for popularizing the term. We like triple plays as an indication that a company’s business is firing on all cylinders, with better-than-expected results and an improving outlook. A triple play is indicative of positive “fundamental momentum” instead of pure fundamentals, and there are always plenty of names with both high and low valuations on our quarterly list.
Bespoke’s Triple Play Report highlights companies that have recently reported earnings triple plays, and it features commentary from management on triple-play conference calls, company descriptions and analysis, and price charts. Bespoke’s Triple Play Report is available at the Bespoke Institutional level only. You can sign up for Bespoke Institutional now and receive a 14-day trial to read this week’s Triple Play Report, which features 25 new stocks. To sign up, choose either the monthly or annual checkout link below:
Bespoke Institutional – Monthly Payment Plan
Bespoke Institutional – Annual Payment Plan
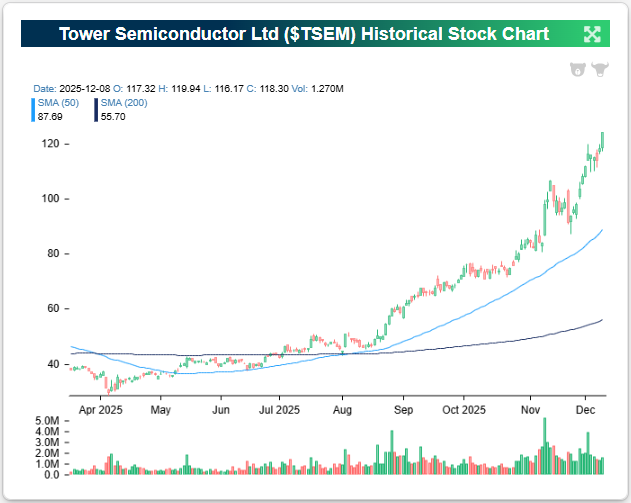
Tower Semiconductor (TSEM) is an example of a company that recently reported an earnings triple play before the opening bell on 11/10. In reaction, TSEM shares rallied 16.7% on the day. That move has helped push the stock up more than 140% YTD!
Here’s how AI describes the company: Tower Semiconductor (TSEM) is a specialized independent foundry that manufactures high-value analog integrated circuits, producing chips for customers who design hardware but do not own their own fabrication facilities. In other words, customers send TSEM blueprints, and it uses its factories to physically build those designs into finished computer chips. Instead of competing on the smallest digital processors, Tower focuses on customizing “specialty” process technologies, such as Silicon Photonics (SiPho), Silicon Germanium (SiGe), and RF-SOI, that excel at managing real-world signals like light, radio waves, and electrical power. You can think of these like the “senses” and “connectors,” rather than the main processors, “brains,” of a computer. These components are critical for optical transceivers in high-speed AI data centers, radio frequency front-ends in 5G smartphones, and power management systems in automotive and consumer electronics. Operating seven manufacturing facilities across Israel, the United States, and Japan, TSEM does not sell devices directly to consumers. Instead, it provides the essential manufacturing service and complex chemical processes needed to create these specific parts, which are then installed inside smartphones, cars, and the massive data centers powering AI.
Tower delivered a strong third quarter with revenue climbing 7% YoY to $396 million and net profit reaching $54 million, while the company raised guidance to a record $440 million for Q4 on the back of huge AI infrastructure demand. The standout performer was the Silicon Photonics segment, which creates optical interconnects for data centers, as revenue here surged 70% to $52 million and is rapidly moving toward ultra-fast 1.6 Terabit speeds that already make up nearly a third of production starts. This demand is so intense that management committed an additional $300 million investment to triple manufacturing capacity for these optical chips by late 2026. Customers are abandoning traditional lasers in favor of Tower’s silicon-based alternative because it offers better performance while requiring only half the number of lasers, making them far cheaper and more efficient.
As we touched on earlier, the stock has staged a historic run; up more than 140% YTD and roughly 325% since the April Tariff Tantrum. The stock is currently trading at its highest level in over 20 years. Wall Street has aggressively re-priced the company from a standard chip manufacturer to a critical piece of the AI supply chain. But this skyrocketing valuation creates a new challenge where expectations are now through the roof. With so much optimism already baked into the price, the company has effectively entered a zone where simply meeting estimates will likely not be enough going forward. To sustain this upward trajectory, TSEM must now likely continually deliver better-than-expected results to justify its massive run.
Looking at the snapshot below from our Earnings Explorer, Tower Semi (TSEM) has found a rhythm with its pace of positive reactions to earnings over the last three and a half years. The stock has risen on 13 of its 14 earnings reaction days since August 2022. EPS and revenue beat rates have been shakier, though. Although not a consistent triple play name, the company has managed a couple recently.

You can read more about TSEM and the 24 other triple plays we covered in our newest report by starting a Bespoke Institutional trial today.
Bespoke Investment Group, LLC believes all information contained in these reports to be accurate, but we do not guarantee its accuracy. None of the information in these reports or any opinions expressed constitutes a solicitation of the purchase or sale of any securities or commodities. This is not personalized advice. Investors should do their own research and/or work with an investment professional when making portfolio decisions. As always, past performance of any investment is not a guarantee of future results. Bespoke representatives or clients may have positions in securities discussed or mentioned in its published content.
Bespoke’s Morning Lineup – 12/10/25 – Hot Rocks
See what’s driving market performance around the world in today’s Morning Lineup. Bespoke’s Morning Lineup is the best way to start your trading day. Read it now by starting a two-week trial to Bespoke Premium. CLICK HERE to learn more and start your trial.
“I am in a charming state of confusion.” – Ada Lovelace

Below is a snippet of commentary from today’s Morning Lineup. Start a two-week trial to Bespoke Premium to view the full report.
On a Fed day, we’d normally say that wherever the futures are in the pre-market, don’t expect the market to be there after the decision is announced, let alone after Powell talks. Based on recent history, though, volatility on Fed days has been muted. As we noted in today’s Chart of the Day, the S&P 500’s average absolute daily change on the last five Fed days has been among the most muted relative to any other rolling five Fed day period since 1994. So, maybe the muted moves in futures markets are on to something!
Outside of equities, the 10-year yield is up 2 bps and back above 4.2% as part of a global move higher yields. Crude oil prices are also up fractionally but still below $58 per barrel, while the slide in natural gas continues as prices break below $4.50. Metal prices are all over the map as gold prices are slightly lower, while silver rallies over 1% and platinum falls over 1%. In the crypto pace, it’s also a mixed but downwardly biased morning as bitcoin falls 1%.
International markets have also been quiet overnight and this morning ahead of the Fed, as most major benchmarks saw, or are seeing, modest declines. Chinese CPI was weaker than expected, falling 0.1% versus forecasts for an increase of 0.2% while PPI in Japan was right in line with forecasts.
Warren Buffett has famously said of gold that it “gets dug out of the ground in Africa, or someplace. Then we melt it down, dig another hole, bury it again, and pay people to stand around guarding it. It has no utility. Anyone watching from Mars would be scratching their head.” While other precious metals like platinum and silver have more industrial uses than gold, based on public records, it has been decades since Buffett has been active in them. The primary reason Buffett has generally avoided commodities is that they are essentially a bet on future supply and demand rather than income-generating assets.
While they don’t produce income, precious metals are commodities that have produced massive capital gains this year. Gold (GLD) has rallied 60%, and those gains look modest relative to the 86.3% gain in platinum (PLTM) and the massive 109.5% gain in Silver (SLV).
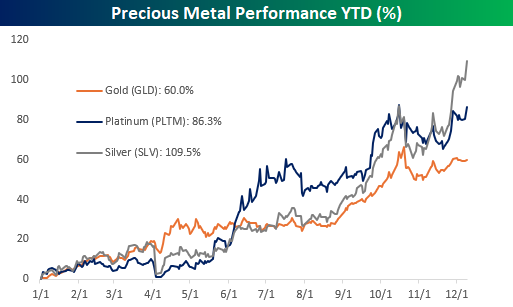
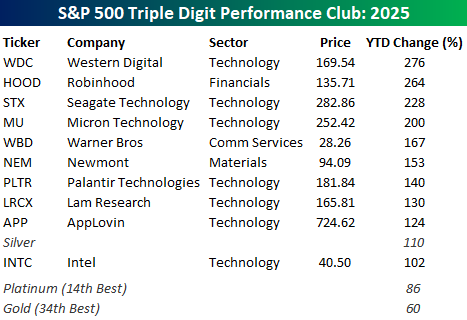
For all three precious metals, the YTD gains would be enough to rank near the top of the list in terms of YTD performance. With its 109.5% gain, SLV would be the tenth-best stock in the S&P 500 this year, ahead of Intel (INTC) and behind AppLovin (APP). Nothing against AppLovin and its prospects over the next several years, but 100 years from now, which do you think has a better chance of still being around in its current form? Silver or AppLovin?
While the gains in Platinum and Gold wouldn’t crack the top ten in terms of performance, the former’s 86.3% gain would rank as number 14 in the S&P 500, while Gold would rank number 34.
Looking at the ten best-performing stocks in the S&P 500 this year, all of them are up by at least 100%, and all but three are from the Technology sector. The top four performing stocks have not only had triple-digit returns, but they’ve also at least tripled! Sticking to the commodities theme, three of those stocks – Western Digital (WDC), Seagate Technology (STX), and Micron (MU) – all make data storage and memory products, which in the universe of the technology sector have for years been considered commodities as well.
The Closer – Cost Woes, PE Enters the S&P, JOLTS – 12/9/25
Log-in here if you’re a member with access to the Closer.
Looking for deeper insight into markets? In tonight’s Closer sent to Bespoke Institutional clients, we kick off with a look into the drop in quality stocks and the rise of private equity names (page 1). We also note the performance of S&P 500 additions (page 2) before shifting into a recap of the JOLTS data (pages 3 and 4).
See today’s full post-market Closer and everything else Bespoke publishes by starting a 14-day trial to Bespoke Institutional today!
Bespoke’s Consumer Pulse Report – December 2025
Bespoke’s Consumer Pulse Report is an analysis of a huge consumer survey that we run each month. Our goal with this survey is to track trends across the economic and financial landscape in the US. Using the results from our proprietary monthly survey, we dissect and analyze all of the data and publish the Consumer Pulse Report, which we sell access to on a subscription basis. Sign up for a 30-day free trial to our Bespoke Consumer Pulse subscription service. With a trial, you’ll get coverage of consumer electronics, social media, streaming media, retail, autos, and much more. The report also has numerous proprietary US economic data points that are extremely timely and useful for investors.
We’ve just released our most recent monthly report to Pulse subscribers, and it’s definitely worth the read if you’re curious about the health of the consumer in the current market environment. Start a 30-day free trial for a full breakdown of all of our proprietary Pulse economic indicators.

Bespoke’s Morning Lineup – 12/9/25 – Power Outage
See what’s driving market performance around the world in today’s Morning Lineup. Bespoke’s Morning Lineup is the best way to start your trading day. Read it now by starting a two-week trial to Bespoke Premium. CLICK HERE to learn more and start your trial.
“Lesson Number One: Don’t Underestimate The Other Guy’s Greed!” – Frank Lopez, Scarface
Below is a snippet of commentary from today’s Morning Lineup. Start a two-week trial to Bespoke Premium to view the full report.
Bespoke’s Paul Hickey will be on CNBC’s Squawk on the Street today at 10 AM. Make sure to check it out!
Markets remain on snooze with little conviction in either direction this morning, and while investors “waiting for the Fed” has been the excuse, is there really any question over what Powell will say and do tomorrow? Futures are as close to unchanged as you can really get this morning, with the S&P 500 indicated to open up 1 point (0.18%) while the Nasdaq is faring “significantly” worse, down 0.06%. As we wait for the Fed, there is some economic data today. Small Business sentiment hit the tape earlier and came in modestly higher than expected, while JOLTS will hit the tape at 10 AM.
Overnight in Asia, it was a ho-hum session with the Nikkei up 0.1% while China, South Korea, and India were all down fractionally (less than 0.5%). The RBA left rates unchanged but had a hawkish tone. In Europe, the STOXX is down 0.1%.
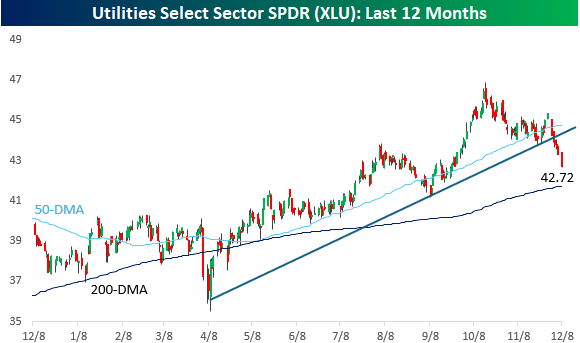
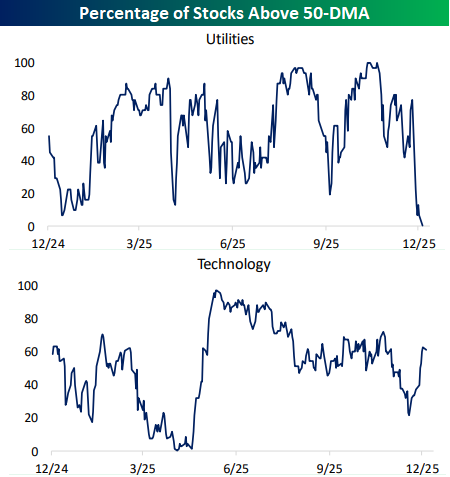
We had a power outage at the Bespoke offices yesterday afternoon, and coincidence or not, have you seen a chart of the Utilities sector recently? After being one of the better performing sectors this year, the sector started to fall on hard times since mid-October, to the point where in late November it broke its uptrend from the April lows. From there, the weakness in the sector picked up in intensity. The fact that longer-term interest rates have been rising hasn’t helped.
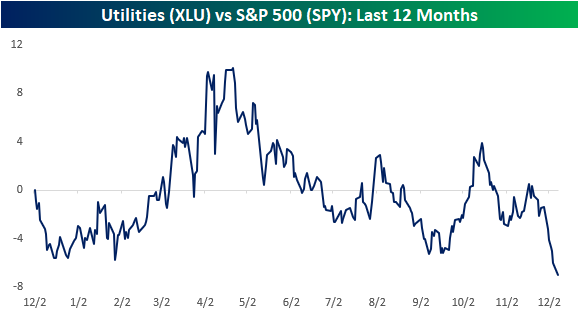
The recent weakness in the sector has also brought its relative strength versus the S&P 500 to a new low for the year. After handily outperforming during the tariff-tantrum in the Spring, the sector started performing in line with the broader market. For much of the last six months, its relative strength oscillated above and below the neutral line, but the last two weeks have seen it make a new leg lower.
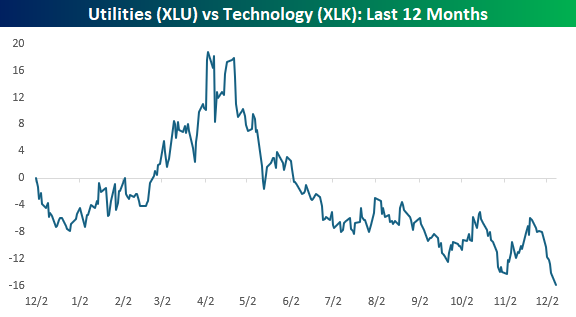
Given the power demands of AI, there have been times in the last few years when Utilities have been considered a technology play, but when you compare the sector’s performance to the Technology sector, it’s not even close. Utilities have been trending lower for the last six months.
The disparity is also apparent when you compare the percentage of stocks in each sector trading above their 50-day moving averages. The Utilities are experiencing a “blackout” in this metric as not a single sector closed above its 50-DMA yesterday. That compares to more than half of stocks in the Technology sector. After some trial and error last night, Con Ed finally got the power back on in our offices last night, now they need to work on getting some power back to the sector!
The Closer – Yields, Correlations, Expectations – 12/8/25
Log-in here if you’re a member with access to the Closer.
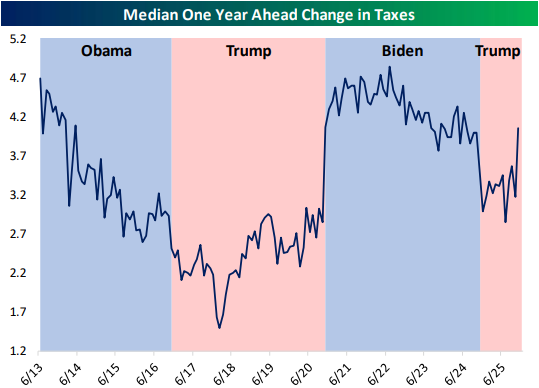
Looking for deeper insight into markets? In tonight’s Closer sent to Bespoke Institutional clients, we begin with a look at the technical pattern in the 10-year yield in addition to what real yields are showing (page 1). We then move onto a cross-asset correlation analysis (page 2) before diving into today’s economic data that includes the New York Fed’s Survey of Consumer Expectations (pages 3 – 4) and some housing releases (pages 5 – 6).
See today’s full post-market Closer and everything else Bespoke publishes by starting a 14-day trial to Bespoke Institutional today!
Consumer Stocks vs. Consumer Sentiment
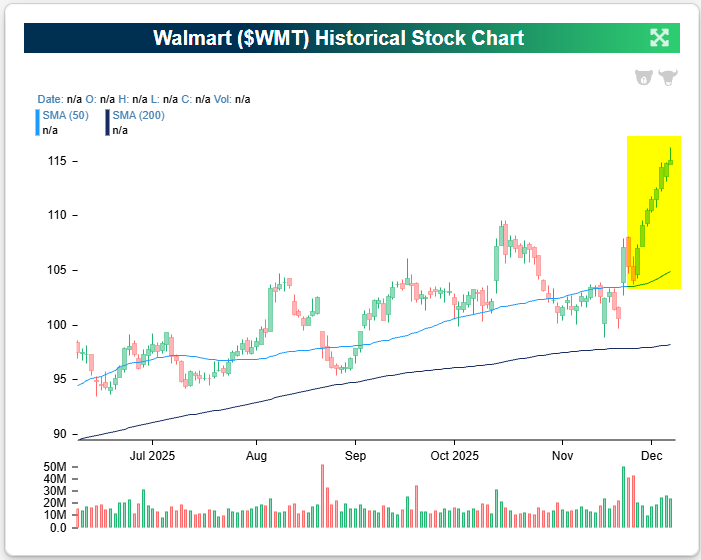
While sentiment surveys show that US consumers are not very happy right now (especially boomers), many consumer-related stocks have been telling a different story lately.
First up is a chart of Walmart (WMT), which has done nothing but trade higher since Thanksgiving:
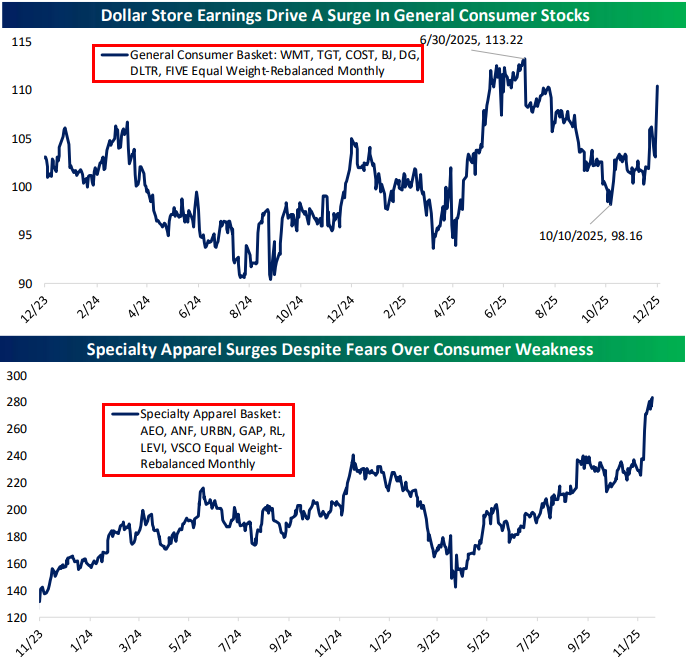
Our equally-weighted basked of general consumer stocks that includes Walmart (WMT), Target (TGT), Costco (COST), BJ’s (BJ), Dollar General (DG), Dollar Tree (DLTR), and Five Below (FIVE) has surged in the last couple of months.
Our specialty apparel basket that has well-known retailers like American Eagle (AEO), Abercrombie (ANF), Gap (GAP), and Levi’s (LEVI) has done even better with a huge jump last week to new highs.
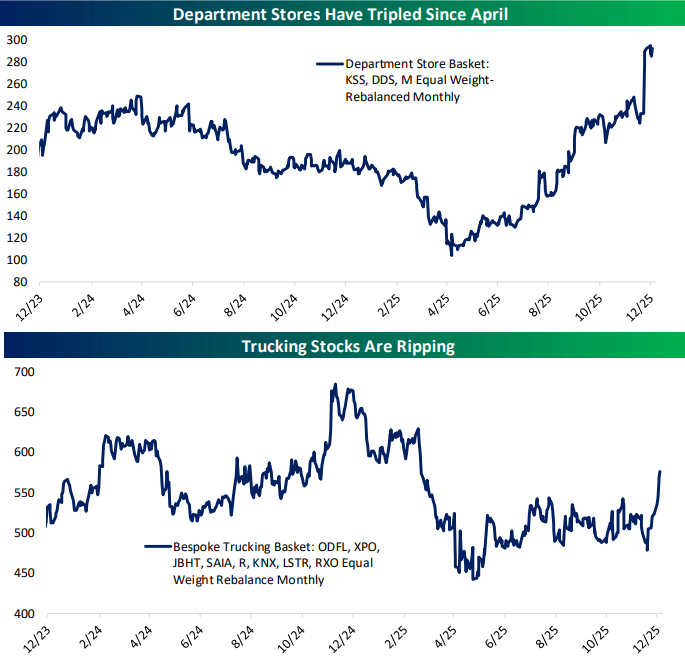
While there are only a few publicly traded department store stocks these days, this basket that includes Kohl’s (KSS), Dillard’s (DDS), and Macy’s (M) has tripled since April. Yes, tripled!
In addition, trucking stocks that deliver goods that ultimately land in the hands of consumers have been ripping over the last month.
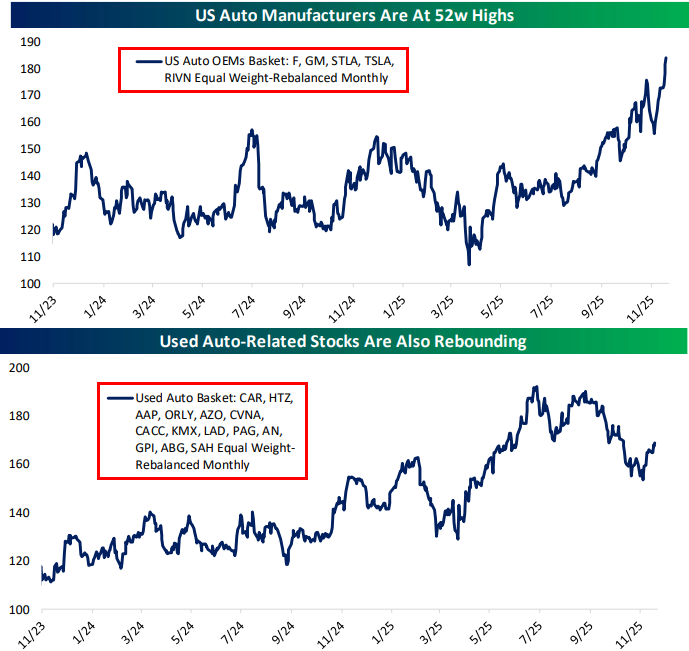
And finally, if the consumer is so weak, we wouldn’t expect to see US auto OEMs and used-car stocks performing as well as they have been lately. Check out the break to new 52-week highs recently in an equally-weighted basket of Ford (F), General Motors (GM), Stellantis (STLA), and Tesla (TSLA).
While our used-car basket isn’t at highs, it remains in an uptrend and has rebounded since the government shutdown ended a few weeks ago.
Not a Bespoke client? We’d love for you to give our equity research platform, Bespoke Premium, a try. You can sign up for complimentary access for 14 days at this link to start receiving our daily emails today!

Chart of the Day: Intraday IBIT Selling
Bitcoin has been whipsawing around $90k for the last week or so. It ended last Friday right around where it’s trading this afternoon, but it’s also down a couple thousand dollars from its highs earlier this morning before the US equity market opened at 9:30 AM ET.
Below is a chart of the iShares Bitcoin ETF (IBIT) since it began trading in January 2024. While IBIT is in a pretty significant drawdown from its all-time high seen in October, its longer trend remains higher. A key support level has formed in the low $40s, and while we have not seen this level get tested during the current drawdown, it would be significant if this support were to break.
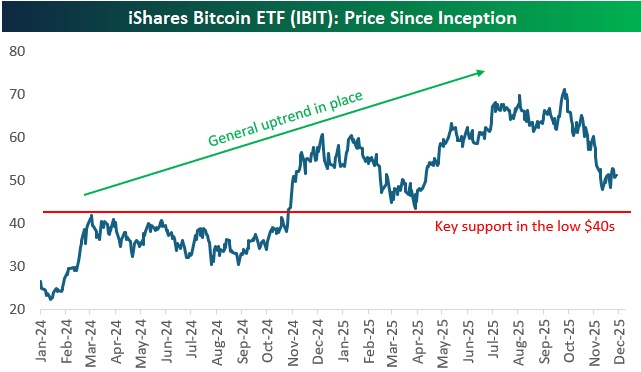
While the long-term chart for IBIT doesn’t look bad, the six-month chart looks pretty brutal:
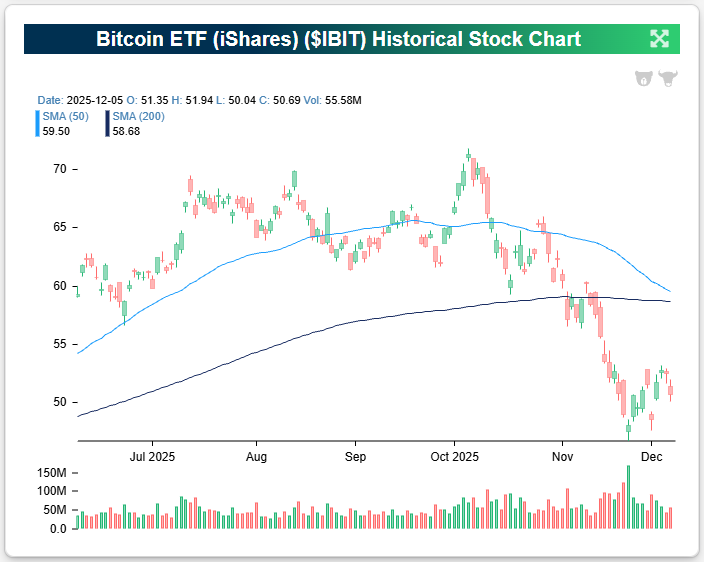
We’ve found what appears to be the problem for IBIT, which trades on US stock exchanges just like other ETFs across asset classes: it trades horribly when the stock market is open.
We looked at IBIT’s action in the six months covered in the chart above to see how it got to its 13.7% decline over this period. Amazingly…
To continue reading the remainder of our latest Chart of the Day, start a 30-day trial to Bespoke Premium or Bespoke Institutional today.

Bespoke’s Morning Lineup – 12/8/25 – Waiting on the Fed
See what’s driving market performance around the world in today’s Morning Lineup. Bespoke’s Morning Lineup is the best way to start your trading day. Read it now by starting a two-week trial to Bespoke Premium. CLICK HERE to learn more and start your trial.
“I’ve noticed that when people are joking they’re usually dead serious, and when they’re serious, they’re usually pretty funny.” – Jim Morrison
Below is a snippet of commentary from today’s Morning Lineup. Start a two-week trial to Bespoke Premium to view the full report.
As investors await Wednesday’s Fed meeting, there’s a modestly positive bias to futures as the S&P 500 knocks on the door of a new high. There’s no economic data on the calendar, so the main area of focus is Wednesday’s Fed meeting, where the market is pricing in a greater than 90% chance of a 25 bps rate cut. While a rate cut is a near certainty, the odds of another cut in January are relatively low, and the consensus is that Powell’s commentary will be hawkish.
Stocks in Asia got off to a mixed start on little news. The Nikkei finished marginally higher, but Hong Kong was down over 1% and China was up fractionally as export data showed a 5.9% y/y increase versus forecasts for growth of just 3.8%. Japan’s Q3 GDP was weaker than expected, falling 0.6%, so the slower growth, coupled with higher inflation, spells out a tough recipe for the BoJ.
European stocks are also showing little direction this morning as the STOXX 600 is little changed, and no individual country benchmark index is up or down 0.3%.
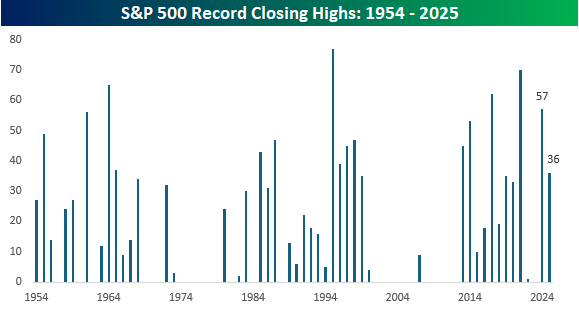
It’s been 28 trading days since the S&P 500 last closed at a record high right before the Fed’s last meeting and Powell’s hawkish cut on 10/29. As we approach this Wednesday’s meeting, though, the S&P 500 is just 30 bps from that October high and its 37th record closing high of the year. With just 17 trading days left this year, even if we hit a record high on every remaining day this year, it wouldn’t be enough to overtake last year’s total of 57, but even if there wasn’t another record high again this year, 36 is still an impressive total.
Since 1953, when the five-trading-day week in its current form started, the average number of record closing highs by year is 18.5. As the chart below illustrates, though, the number can vary widely. In 28 of the last 73 years, there have been no record highs, so there were plenty of valleys after deep bear markets where the market had to rally back over the course of years to dig out of its hole. Earlier this century, there was a six-year drought from 2001 through 2006, and then after just nine record highs in 2007, there was another five-year drought from 2008 through 2012.
Since 2013, there has been just one year without any record highs, while there was just one in 2022. This chart, more than anything, illustrates the nature of the secular bull market US stocks have been in for the last decade or more. As the chart illustrates, though, these periods don’t last forever.
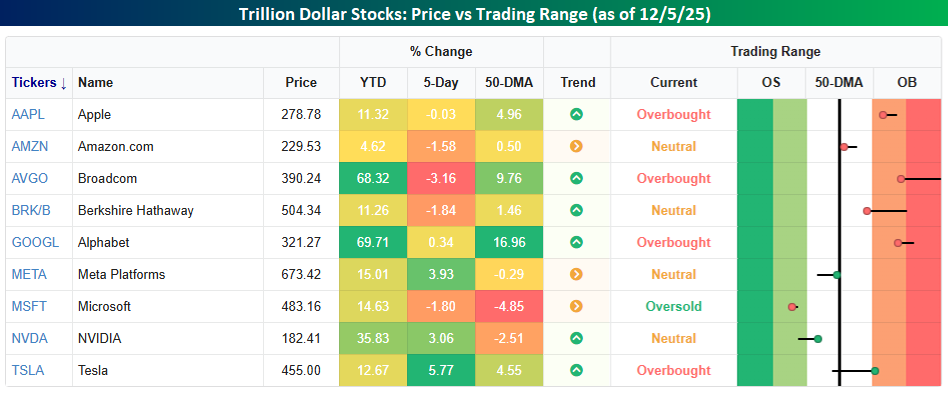
Whether the new highs start flowing again will likely be dictated by the performance of the trillion-dollar stocks. Collectively, the nine stocks in the S&P 500 with market caps of at least a trillion account for nearly 40% of the S&P 500. What’s interesting to note about these nine stocks is that while they’re all up YTD, only three of them – Alphabet (GOOGL), Broadcom (AVGO), and Nvidia (NVDA) – are outperforming the S&P 500 YTD. Not only that, but last week, more than half of them were down, so it’s not as though the group, as a cohort, has become wildly extended. Certain stocks may be overbought in the short-term, but there are also stocks like Meta (META), Microsoft (MSFT), and NVDA that head into the week below their 50-DMAs.
Brunch Reads – 12/7/25
Welcome to Bespoke Brunch Reads — a linkfest of some of our favorite articles over the past week. The links are mostly market-related, but there are some other interesting subjects covered as well. We hope you enjoy the food for thought as a supplement to the research we provide you during the week.
War Awakens the West: On the morning of December 7, 1941, the Japanese strike force, six aircraft carriers positioned 230 miles north of Oahu, launched more than 350 aircraft in two waves, attacking Pearl Harbor. Their targets were battleships, airfields, and fuel depots, with the goal of crippling the Pacific Fleet before it could interfere with Japan’s push into Southeast Asia. The attack began at 7:55 a.m. Hawaiian time. Within minutes, the USS Arizona exploded, killing over 1,100 sailors instantly. Two US Army radar operators on the north shore actually detected the incoming planes but were dismissed by a junior officer who assumed the blip was a group of American B-17s arriving from California.
By the end of the attack, more than 2,400 Americans had been killed, 19 ships were damaged or sunk, and nearly 200 planes were destroyed. But not everything went according to Japan’s plan. The US aircraft carriers Enterprise, Lexington, and Saratoga were all out at sea and survived. The Japanese also missed key infrastructure targets, including fuel farms and repair facilities. Had they destroyed those, the Pacific Fleet’s recovery would have taken far longer.
The next day, Congress declared war on Japan with just one dissenting vote. Germany and Italy declared war on the United States shortly after, finally bringing the Americans into the war. Within hours of the attack, the US government began issuing orders to round up and detain Japanese diplomats stationed in the country, a precursor to the far more sweeping internment of Japanese Americans that followed.
Within a year, the US was producing warships, tanks, and aircraft at a scale that stunned both Allied and Axis powers. In the Pacific, strategy shifted quickly from defensive to offensive, beginning with the Doolittle Raid in April 1942, a symbolic but morale-boosting strike on Tokyo, and then the pivotal Battle of Midway in June. The industrial rush, in concert with the unified political support created by the attack on Pearl Harbor, ultimately helped tilt both the European and Pacific theaters toward Allied victory. Though the attack was devastating, Japan failed to knock out the US fleet long-term and instead awakened an industrial and military sleeping giant.

Markets & Investing
“Captain Gains” on Capitol Hill (NBER)
To almost nobody’s surprise, members of Congress start trading like everyone else, but once they rise into leadership roles, their stock picks suddenly perform far better. Their advantage seems to come from two sources: influence over policy that affects certain companies, and access to corporate information that shows up in their trading before major news breaks. [Link]
Continue reading our weekly Brunch Reads linkfest by logging in if you’re already a member or signing up for a trial to one of our two membership levels shown below! You can cancel at any time.
