Zillow the Go-To in Online Real Estate Search
Yesterday we published a note on the most recent results from our Bespoke Consumer Pulse survey that we conduct on 1,500 US consumers each month (with demographics balanced to census numbers). In regards to real estate and housing, one of the many questions we ask consumers is what their favorite website/app is to search for real estate. When it comes to searching for houses, there’s Zillow and then there’s everyone else. As shown below, 48.3% of respondents said that Zillow is their favorite website/app for searching for real estate. Realtor.com ranks second all the way down at 15.6%. While Zillow’s popularity in our survey dipped somewhat in late 2019 and 2020, it has been trending steadily higher since mid-2021 and just hit new survey highs (since 2014) this month.

While Zillow’s popularity with US consumers hit a record high in our survey this month, the company’s share price certainly hasn’t followed this trend. Since the end of 2020, shares of Zillow (ZG) are down 67%, and they’re down 16.5% over the last five years. Of course, in between we saw shares explode higher by more than 600% from their post-COVID lows in March 2020 to their highs in early 2021:
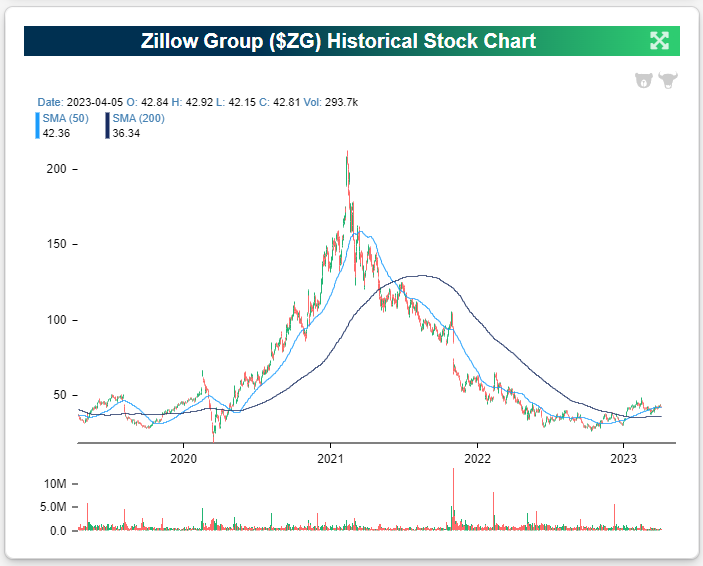
The shorter-term chart for ZG looks quite different, though, with a series of higher highs and higher lows since shares bottomed last October.

Check out our full Consumer Pulse Report here if you’re interested in the latest consumer trends across the economy.
Have you tried Bespoke All Access yet?
Bespoke’s All Access research package is quick-hitting, actionable, and easily digestible. Bespoke’s unique data points and analysis help investors better visualize underlying market trends to ultimately make more informed investment decisions.
Our daily research consists of a pre-market note, a post-market note, and our Chart of the Day. These three daily reports are supplemented with additional research pieces covering ETFs and asset allocation trends, global macro analysis, earnings and conference call analysis, market breadth and internals, economic indicator databases, growth and dividend income stock baskets, and unique interactive trading tools.
Click here to sign up for a one-month trial to Bespoke All Access, or you can read even more about Bespoke All Access here.

Claims Get Revised
Jobless claims were in focus this morning as seasonally adjusted initial claims were surprisingly high at 228K versus expectations of 200K. Previously, adjusted claims had consistently come in well below 200K with 10 readings below that level in the last 11 weeks. However, that large increase in the most recent week’s data was matched with large revisions to the past couple of years’ data as the BLS updated its seasonal adjustment methodology. The net impact of those changes was to redistribute claims throughout the year, revising up readings from Q1 and Q4 while Q2 and Q3 were revised down; total or average annual readings were not changed. As discussed in greater detail on the BLS website and we will review in more depth in tonight’s Closer, there are two methods for seasonal adjustment: multiplicative or additive. Most of the time the claims data has used multiplicative seasonal factoring, but periods like the first year of the pandemic in which the indicator experiences unusually large level increases means an additive approach becomes more apt. This week, the BLS applied a new hybrid approach with additive factoring applied from early March 2020 through mid-2021 and multiplicative factoring for all other periods.
As shown below, that change back to multiplicative factoring resulted in some large revisions for initial claims over the past couple of years. In turn, that has dramatically changed the picture jobless claims have painted. Previously (red line in chart below) claims had been more or less trending sideways after bottoming around a year ago, but after these revisions (blue line) claims are trending upwards and bottomed this past September. In addition, the upward revision to 247K to the print from two weeks ago would mark the highest level since January 2022.

As for the non-seasonally adjusted data, the story is much less noisy being unaffected by the aforementioned revisions. In other words, the overall picture for claims hasn’t changed when looking at this series. Claims remain near historically healthy levels consistent with the few years prior to the pandemic. Granted, those are off the strongest readings from last year. At this point of the year, claims are also trending lower as could be expected based on seasonal patterns. The next couple of weeks may see claims move higher because of seasonality, though, that would likely prove to be a temporary bump in the road with claims resuming the trend lower through the late spring.

The revision likewise impacted continuing claims which rose to 1.823 million in the most recent week. That brings claims back up to the highest levels since December 2021 as they have risen sequentially for three weeks in a row.

Have you tried Bespoke All Access yet?
Bespoke’s All Access research package is quick-hitting, actionable, and easily digestible. Bespoke’s unique data points and analysis help investors better visualize underlying market trends to ultimately make more informed investment decisions.
Our daily research consists of a pre-market note, a post-market note, and our Chart of the Day. These three daily reports are supplemented with additional research pieces covering ETFs and asset allocation trends, global macro analysis, earnings and conference call analysis, market breadth and internals, economic indicator databases, growth and dividend income stock baskets, and unique interactive trading tools.
Click here to sign up for a one-month trial to Bespoke All Access, or you can read even more about Bespoke All Access here.
Sentiment Back to Bullish
Sentiment saw a huge rebound this week based on the latest AAII survey. With the S&P 500 taking out early March highs late last week, bullish sentiment jumped 10.8 percentage points to 33.3%. Although there was a higher level of bullish sentiment as recently as February 16th, this week’s increase was the largest WoW jump since June of last year. Even though a double-digit jump in bullish sentiment sounds significant, S&P 500 performance has been unremarkable following similar instances historically.

The rise in bullish sentiment borrowed almost entirely from those reporting as bearish. Bearish sentiment fell 10.6 percentage points down to 35%. That is the lowest reading since mid-February and the first double-digit drop since November.
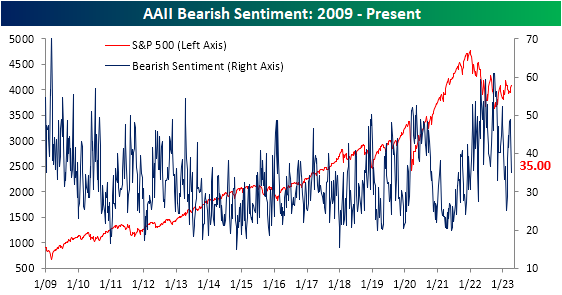
The huge shift in favor of bulls this week resulted in the bull-bear spread narrowing to -1.7 points. That is the least negative reading in the spread since February when the bull-bear spread had broken a record streak of bearish readings.

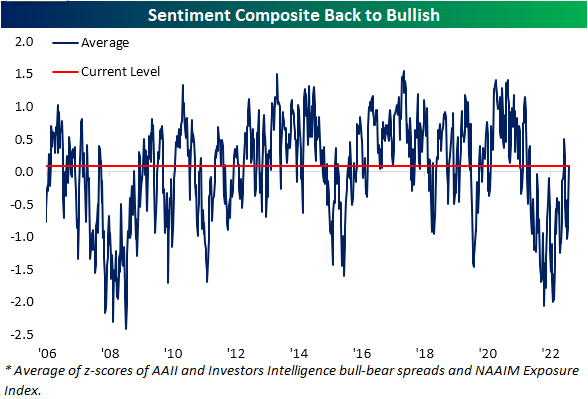
As we noted last week, the AAII survey has been a holdout in showing more optimistic sentiment readings. Whereas other sentiment surveys like the NAAIM exposure index and the Investors Intelligence survey had essentially returned to historical averages, the AAII survey saw firmly bearish sentiment readings with a bull-bear spread of 1.6 standard deviations from its historical average as of last week. Given the quick turnaround this week, the AAII survey is no longer weighing on our Sentiment Composite as it moved back into positive territory indicating bullish sentiment for only the fourth week since the start of 2022.
Have you tried Bespoke All Access yet?
Bespoke’s All Access research package is quick-hitting, actionable, and easily digestible. Bespoke’s unique data points and analysis help investors better visualize underlying market trends to ultimately make more informed investment decisions.
Our daily research consists of a pre-market note, a post-market note, and our Chart of the Day. These three daily reports are supplemented with additional research pieces covering ETFs and asset allocation trends, global macro analysis, earnings and conference call analysis, market breadth and internals, economic indicator databases, growth and dividend income stock baskets, and unique interactive trading tools.
Click here to sign up for a one-month trial to Bespoke All Access, or you can read even more about Bespoke All Access here.
Bespoke’s Morning Lineup – 4/6/23 – Quiet Heading Into The Weekend
See what’s driving market performance around the world in today’s Morning Lineup. Bespoke’s Morning Lineup is the best way to start your trading day. Read it now by starting a two-week trial to Bespoke Premium. CLICK HERE to learn more and start your trial.
“If you want to make enemies, try to change something.” – Woodrow Wilson

Below is a snippet of content from today’s Morning Lineup for Bespoke Premium members. Start a two-week trial to Bespoke Premium now to access the full report.
It hasn’t been an especially good week for economic data so far with notable weakness in employment-related data. Besides the JOLTS and ADP reports which were weaker than expected, the employment component of the ISM Manufacturing report was the lowest in over two years while the employment component of the Services report declined relative to February and is barely clinging to positive territory. Initial Jobless Claims were also just released and came in at 228K relative to expectations for 200K. Continuing Claims were 1.823 mln versus forecasts for 1.7 mln. Initial Claims were the highest since last December while Continuing Claims were the highest since December 2021 So, you can add more weak employment data to this week’s pile. In reaction to the report, futures saw a modest tick lower but nothing major.
All of these indicators are a sideshow, though. Tomorrow’s Non-Farm Payrolls report will either confirm the weakness we have seen in these indicators or render them irrelevant (for a few days at least). Unfortunately, the equity market will be closed for the main event in observance of Good Friday. Bond markets will be open, and lately, they’ve been more volatile than the stock market anyway, so don’t think there won’t be any fireworks. And if that isn’t enough for you, crypto never sleeps!
Open or closed tomorrow, we’ll be watching to see if another epic streak can continue or come to an end. Monthly Non-Farm Payrolls have come in better than expected for eleven straight months, so a better-than-expected report would make it a full year. Never before has the been a streak that long or for that matter even half as long.

Our Morning Lineup keeps readers on top of earnings data, economic news, global headlines, and market internals. We’re biased (of course!), but we think it’s the best and most helpful pre-market report in existence!
Start a two-week trial to Bespoke Premium to read today’s full Morning Lineup.
Smartphones Closing in on TAM; Longer Replacement Cycles
For nearly ten years now we’ve been running our Pulse survey of 1,500 US consumers balanced to census that asks them dozens of questions related to personal finance and economic sentiment. With nearly ten years of data, these survey results are invaluable and give us as good of a read on consumer trends as we can find. (If you would like to learn more about our monthly Bespoke Consumer Pulse survey and the report we produce that accompanies it, you can do so here.)
Along with broader questions about things like employment, credit card payments, new home purchases, and risk tolerance, we also dive into consumer interest across things like smartphones, streaming services, social media use, and e-commerce. In regards to smartphones, every month we ask survey takers a simple question: “Do you own a smartphone?” Below is a chart showing the percentage of respondents that answered “yes” to that question on a monthly basis dating back to July 2014.
In the mid-2010s when we began asking the question, our survey results showed that smartphone penetration in the US was still between 75-85%. By 2020, that number had moved up to ~90%, and since then it has steadily ticked higher to its current level of 97.2%, which hit a new all-time high this month. At 97.2%, there’s basically no runway left when it comes to the total addressable market (TAM) of smartphones in the US. Everyone has one at this point!

The two main competitors in the smartphone space are iPhones and Androids. In our monthly Pulse survey, we closely track trends in this space for investors and companies that are interested in this data.
Along with there now being basically no room to expand smartphone ownership in the US, another problem for smartphone makers is that consumers are replacing them less often. Below are the results from a question we ask survey-takers on how long they typically keep their smartphone before getting a new one. Most respondents to this question typically keep their smartphones for 2+ years before replacing them, but this number actually started to trend lower from 2019 through mid-2021. During that time, respondents reporting that they replace their smartphones every year or less ticked higher. This trend shifted again in 2021, however, and since then we’ve seen a larger and larger share of respondents say that they typically keep their smartphone for 2+ years. Longer replacement cycles mean fewer sales, which is why it’s important for a company like Apple (AAPL) to introduce meaningful new iPhone features that will get consumers to replace their existing iPhones sooner. (Also, remember that longer-lasting batteries and more durable hardware are great for customers, but they also increase the replacement cycle.)

If you would like to check out our full Bespoke Consumer Pulse report, here’s a link that tells you how to do that.
Have you tried Bespoke All Access yet?
Bespoke’s All Access research package is quick-hitting, actionable, and easily digestible. Bespoke’s unique data points and analysis help investors better visualize underlying market trends to ultimately make more informed investment decisions.
Our daily research consists of a pre-market note, a post-market note, and our Chart of the Day. These three daily reports are supplemented with additional research pieces covering ETFs and asset allocation trends, global macro analysis, earnings and conference call analysis, market breadth and internals, economic indicator databases, growth and dividend income stock baskets, and unique interactive trading tools.
Click here to sign up for a one-month trial to Bespoke All Access, or you can read even more about Bespoke All Access here.
Bespoke’s Consumer Pulse Report — April 2023
Bespoke’s Consumer Pulse Report is an analysis of a huge consumer survey that we run each month. Our goal with this survey is to track trends across the economic and financial landscape in the US. Using the results from our proprietary monthly survey, we dissect and analyze all of the data and publish the Consumer Pulse Report, which we sell access to on a subscription basis. Sign up for a 30-day free trial to our Bespoke Consumer Pulse subscription service. With a trial, you’ll get coverage of consumer electronics, social media, streaming media, retail, autos, and much more. The report also has numerous proprietary US economic data points that are extremely timely and useful for investors.
We’ve just released our most recent monthly report to Pulse subscribers, and it’s definitely worth the read if you’re curious about the health of the consumer in the current market environment. Start a 30-day free trial for a full breakdown of all of our proprietary Pulse economic indicators.

Bespoke’s Morning Lineup – 4/5/23 – The Streak Ends
See what’s driving market performance around the world in today’s Morning Lineup. Bespoke’s Morning Lineup is the best way to start your trading day. Read it now by starting a two-week trial to Bespoke Premium. CLICK HERE to learn more and start your trial.
“He was sitting over there, waiting like a possum for something to happen.” – Joe Torre
Below is a snippet of content from today’s Morning Lineup for Bespoke Premium members. Start a two-week trial to Bespoke Premium now to access the full report.
Futures are indicating another weaker open this morning after this morning’s weaker-than-expected ADP Private Payrolls report. In what is a big week for employment data, we’re currently 0-2 (weaker than expected JOLTS and ADP) with jobless claims on deck tomorrow and the Non-Farm Payrolls report in the hole on Friday.
September 20th, 1998 seemed like just a normal night in Baltimore. Heading into the last home game of the season, the Orioles were just two games over .500 and out of the post-season with only the Devil Rays separating them from last place. For most fans, the only reason to go to the game was that they were playing the Yankees who were having one of the best regular seasons of all time and on their way to sweeping the Padres in the World Series. Plus, it was a good weather night for baseball with temperatures in the high 60s. What fans heading into Camden Yards that night didn’t know was that they would leave with an unforgettable memory. No, it wasn’t bobblehead night. It was even better as one of the most iconic records in sports came to an end as Cal Ripken pulled himself from the lineup and ended his iron-man streak of 2,632 consecutive games.
Compared to the environment three years earlier when Lou Gehrig’s ‘unbreakable’ streak of 2,130 games that stood for 56 years was broken, there wasn’t much celebration around the end of Ripken’s streak. The Yankees did come out of the dugout to tip their cap to Ripken and the fans gave him a standing ovation and two curtain calls. But while the whole country watched as Ripken broke the streak in 1995, most Americans didn’t find out about the streak ending until the next morning. The Orioles ended up losing 5-4 as ‘El Duque’ notched his 11th win and the 107th for the Yankees.
In the markets yesterday another record streak ended with even less fanfare than Ripken’s, and chances are that even the morning after, you never even knew about it. After yesterday’s weak economic data, the 10-year yield finished the day at 3.34% which was its lowest close since early last September, marking the first time that the 10-year Treasury yield closed at a six-month low since – wait for it – August 2020! That 664-trading day stretch without a six-month closing low in the 10-year yield was the longest streak in the history of the data going back to at least 1962.
Admittedly, this was a much more obscure streak than Gehrig’s ‘unbreakable’ streak that stood in place for 56 years, but this was something that hasn’t been done in at least 61 years. Also, when you think about it, a run in the 10-year yield that kept it from closing at a six-month low for nearly three years definitely had more of a real-world impact on the lives of Americans (and people around the world for that matter) than any streak of Gehrig’s, Ripken’s, or anyone else who follows them.

Our Morning Lineup keeps readers on top of earnings data, economic news, global headlines, and market internals. We’re biased (of course!), but we think it’s the best and most helpful pre-market report in existence!
Start a two-week trial to Bespoke Premium to read today’s full Morning Lineup.
Gold Back at 52-Week Highs
Gold has been trending higher since the fall, and after a retracement earlier this year, the past month has seen the yellow metal surge by over 12% to reach new 52-week highs on an intraday and closing basis as it moves back above the March 20th intraday high.

Not only is gold at a 52-week high, but it is at the highest level since March 2022. That was when gold spiked higher to come up just short of the August 2020 high. In other words, the recent rally in gold has been significant, but leaves it short of a critical resistance level to watch.

While the post-pandemic highs have yet to be taken out, the fact that the commodity has reached a 52-week high is at least promising based on historical performance. In the charts below we show the average performance of front-month gold after the first 52-week highs (on an intraday basis) in at least two weeks. As shown, near-term performance is nothing to write home about with one-week returns that are basically right in line with the norm for performance since 1975. From there, returns tend to get much stronger with a higher consistency of gains to boot. Longer run returns like six months to one year out are particularly impressive with average gains that are more than double that of the average gain for all periods. As always, past performance is no guarantee of futures results.

Have you tried Bespoke All Access yet?
Bespoke’s All Access research package is quick-hitting, actionable, and easily digestible. Bespoke’s unique data points and analysis help investors better visualize underlying market trends to ultimately make more informed investment decisions.
Our daily research consists of a pre-market note, a post-market note, and our Chart of the Day. These three daily reports are supplemented with additional research pieces covering ETFs and asset allocation trends, global macro analysis, earnings and conference call analysis, market breadth and internals, economic indicator databases, growth and dividend income stock baskets, and unique interactive trading tools.
Click here to sign up for a one-month trial to Bespoke All Access, or you can read even more about Bespoke All Access here.
Bespoke’s Morning Lineup – 4/4/23 – Ctrl+Alt+Del
See what’s driving market performance around the world in today’s Morning Lineup. Bespoke’s Morning Lineup is the best way to start your trading day. Read it now by starting a two-week trial to Bespoke Premium. CLICK HERE to learn more and start your trial.
“We always overestimate the change that will occur in the next two years and underestimate the change that will occur in the next ten.” – Bill Gates
Below is a snippet of content from today’s Morning Lineup for Bespoke Premium members. Start a two-week trial to Bespoke Premium now to access the full report.
We’re looking at a modestly positive start to the trading day with overseas markets leading futures higher. The Reserve Bank of Australia announced a pause in its rate hiking cycle, and PPI fell more than expected in the Eurozone, and inflation expectations in the region slowed from 6.2% down to 5.8%.
48 years ago today, a college dropout and a computer programmer in Boston started one of the most successful business stories in US history. The number of millionaires minted from “Micro-Soft’s” founding in 1975 is nowhere near the number of ‘blue screens of death’ and subsequent airborne staplers flying across the room that its software has caused, but when it comes to money printing presses, they don’t get much more efficient than Microsoft (MSFT). With its market cap of just over $2 trillion, Microsoft is now the second-largest company in the US. To put it another way, $10,000 invested in MSFT stock on the day of the IPO would be worth A LOT more today – like, 20 million more.
The chart below shows the rolling 10-year price performance of MSFT stock since 1996 (ten years after the company went public). The early years for the company were a great time to be a stockholder or a Microsoft employee with stock options, but the heady days of gains came to an end in the early 2000s when the US government launched its antitrust suit against the company. After a judge originally ruled that Microsoft violated parts of the Sherman Antitrust Act, the company later won on appeal, and the verdict was overturned. Microsoft may have won in the courtroom, but it was losing in the stock market. The stock’s rolling 10-year returns plummeted throughout the early 2000s and even went negative for the first time in its history during the financial crisis.

Looking just at the last twenty years, the last decade has been another golden era for the stock, in what has been a legendary reinvention of the company. It’s hard enough to lead one major industry trend, but to completely change your business model and do it again is rare indeed. While the chart above makes it look as though returns for the stock have continued to languish in the last ten years, that’s only because of the perspective of the stock’s returns during the 1990s. As late as 2021, the stock’s rolling 10-year return was a gain of over 1,200%. Even after the market turmoil of the last year or so, MSFT stock is still up over 900% in the last ten years which works out to an annualized gain of 25%. Yup 25%! Feel free to run the numbers in Excel yourself or just go over to Bing and ask GPT.
Another lesson of Microsoft’s stock performance over the last several decades is the power of compounding and the fact that sometimes, the best action is no action. An investor frustrated with the stock’s performance in the early 2000s could have easily sold the stock to chase the next best thing. Not only would they have taken a major tax hit on their gains, but by switching, they would have missed out on what has been a stock run unequaled by the vast majority of other publicly traded stocks. That doesn’t mean that you should always stick with an underperforming position, but if you are going to make a move, you want to be as sure as possible that the alternative is a better option.

Our Morning Lineup keeps readers on top of earnings data, economic news, global headlines, and market internals. We’re biased (of course!), but we think it’s the best and most helpful pre-market report in existence!
Start a two-week trial to Bespoke Premium to read today’s full Morning Lineup.
Bespoke Market Calendar — April 2023
Please click the image below to view our April 2023 market calendar. This calendar includes the S&P 500’s historical average percentage change and average intraday chart pattern for each trading day during the upcoming month. It also includes market holidays and options expiration dates plus the dates of key economic indicator releases. Click here to view Bespoke’s premium membership options.
