“Big” Winners
Whenever you see a list of best-performing stocks, it’s inevitably loaded with many small stocks that most investors have never heard of. This year, though, it’s practically been the opposite trend as the two top performing stocks in the S&P 500 on a YTD basis – Meta Platforms (+96%) and Nvidia (+88%) – are not only household names, but they also have market caps of more than $500 billion. We’d also note that both stocks are more than 30 percentage points ahead of the next closest stocks in terms of top YTD returns!
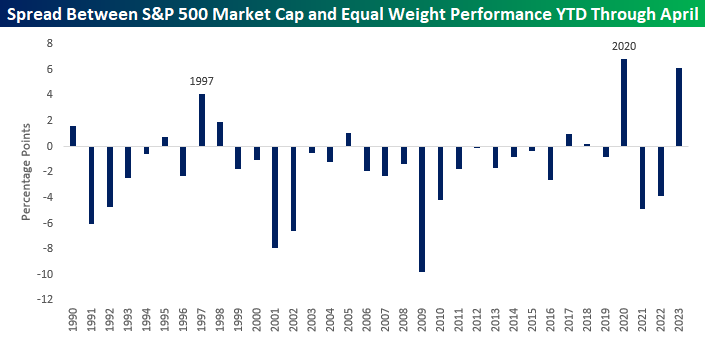
With such strong returns among the largest stocks in the S&P 500, the YTD performance spread between the market-cap-weighted S&P 500 and its equal-weighted counterpart is among the widest ever seen on a YTD basis through the end of April. Through Friday afternoon, the market-cap-weighted S&P 500 was up 8.26% YTD, while the equal-weighted index was up just 2.13%. At 6.14 percentage points, the YTD performance gap between the two indices is the second widest since 1990, trailing only the 6.8% percentage point gap in 2020. Besides 2020, the only other year where the gap was wider than two percentage points was in 1997. While it’s a small sample size and history doesn’t always repeat itself, we’d note that the S&P 500’s rest-of-year performance was a gain of over 20% in both of those years. Just saying.
Besides the two other years where the performance gap was significantly wide like this year, what stands out about the chart below is how common it has historically been for the market cap-weighted index to underperform the equal weight index in the first four months of the year. Including this year, the cap-weighted index has only outperformed nine times in the last 34 years.
Have you tried Bespoke All Access yet?
Bespoke’s All Access research package is quick-hitting, actionable, and easily digestible. Bespoke’s unique data points and analysis help investors better visualize underlying market trends to ultimately make more informed investment decisions.
Our daily research consists of a pre-market note, a post-market note, and our Chart of the Day. These three daily reports are supplemented with additional research pieces covering ETFs and asset allocation trends, global macro analysis, earnings and conference call analysis, market breadth and internals, economic indicator databases, growth and dividend income stock baskets, and unique interactive trading tools.
Click here to sign up for a one-month trial to Bespoke All Access, or you can read even more about Bespoke All Access here.

Bespoke’s Matrix of Economic Indicators – 4/28/23
Our Matrix of Economic Indicators provides a concise summary analysis of the US economy’s momentum. We combine trends across the dozens and dozens of economic indicators in various categories like manufacturing, employment, housing, the consumer, and inflation to provide a directional overview of the economy.
To access our newest Matrix of Economic Indicators, start a two-week free trial to either Bespoke Premium or Bespoke Institutional now!
“Facebook” Becomes “Meta” Becomes “Efficiency AI”
Meta (META) reported an earnings triple play earlier this week when it posted better than expected EPS, better than expected sales, and raised forward guidance. Shares rallied 13% on the first trading day after its Q1 report on Wednesday evening, and that came after shares rallied 23% on the first trading day after its last earnings report back in January.
The turnaround for Meta over the last six months has been impressive and also ironic. Remember, in 2021, founder Mark Zuckerberg did a 180 by putting all the company’s focus into the “metaverse,” going as far as completely renaming the company from Facebook to Meta. During that transition, META (formerly FB) shares tanked 75% from peak to trough, and the company’s market cap fell from $1+ trillion down to the low $200 billions.
In late 2022, Zuckerberg had seen enough. On its Q4 2022 call in January, Zuckerberg forgot about the metaverse and put all of his focus on “efficiency.” Translated, he took the axe to tens of thousands of jobs that were apparently unnecessary and looked to cut expenses everywhere he could while also restructuring the corporate ladder and improving workflows to get the right products to market quicker and cutting products that were going nowhere. At the same time, the current “AI” craze took hold. Zuckerberg and the Meta team have been using AI forever to drive clicks, but up until recently, that was known generically as “the algo.” While Meta actually started mentioning AI on its conference calls a couple of quarters before ChatGPT was released late last year, the stock didn’t start reacting positively to the mentions until ChatGPT became a thing.
Whether it’s known as the algo or “AI,” it doesn’t really matter. What has mattered is that META’s share price has now risen 167% since its lows late last year, and its market cap is back above $600 billion. Given this positive response from investors, we’d now expect them to continue to milk the AI tank as much as possible until it stops working.
Below is a look at the number of times that three words — metaverse, AI, and efficiency — have been mentioned on Meta’s quarterly conference calls going back to Q4 2020. As recently as its Q1 2021 call, these three words weren’t mentioned once on Meta calls! In mid-2021, we saw both metaverse and AI mentions start to pick up, and metaverse continued to get pushed as the company changed its name from Facebook to Meta. Mentions of AI started to really pick up in Q2 of last year and they’ve been increasing ever since. It wasn’t until last quarter that efficiency became the focus with 33 mentions, and we heard it another twenty times on this quarter’s call.
What’s most ironic is that even as Meta has shifted away from the metaverse towards AI and efficiency, we still have to call the company Meta because that’s its official name! If Zuckerberg had to do it all over again, maybe he would have chosen something like “Efficiency AI” instead of Meta, or maybe even “Eff AI” for short!
![]()
Throughout earnings season, we read hundreds of conference call transcripts and then we publish short, succinct recaps of the ones we found the most impactful and interesting. We published our Conference Call Recap on Meta earlier this week, and you can view it with a Bespoke Institutional (All Access) trial if you’re not yet a member. You can click here to sign up if you’d like to read our Meta Recap and all of the other ones that have been published this quarter.
Bespoke’s Morning Lineup – 4/28/23 – These SOX are Quitters
See what’s driving market performance around the world in today’s Morning Lineup. Bespoke’s Morning Lineup is the best way to start your trading day. Read it now by starting a two-week trial to Bespoke Premium. CLICK HERE to learn more and start your trial.
“In Technology, whatever can be done will be done” – Andy Grove

Below is a snippet of content from today’s Morning Lineup for Bespoke Premium members. Start a two-week trial to Bespoke Premium now to access the full report.
While the market initially reacted positively to Amazon’s (AMZN) earnings last night, the stock reversed course and is trading down over 2% this morning. That weakness has overflowed to the major indices as well as the S&P 500 and Nasdaq are both indicated to open lower as treasury yields are lower. It’s been a busy morning of economic data and while there were no major surprises, the majority of reports were more biased to the upside like the Employment Cost Index, Personal Income, and Personal Spending which all exceeded forecasts by 0.1 percentage points. Meanwhile, PCE was inline with forecasts at both the headline and core levels.
It’s been a rough month for semiconductor stocks. After outperforming the S&P 500 by nine percentage points in January, four percentage points in February, and nearly six percentage points in March, the Philadelphia Semiconductor Index (SOX) is down nearly 9% in April compared to a gain of 0.6% for the S&P 500. There’s still a day left of trading in the month, but at the current levels, the SOX is underperforming the S&P 500 by the widest margin since May 2019, and before that, you need to go all the way back to November 2008 to find another month where the SOX lagged the S&P 500 by a larger amount.
As shown in the chart below, there have only been eight other months in the last 20 years that the SOX has underperformed the S&P 500 by 7.5 percentage points or more. While this month’s underperformance comes after three months of steady outperformance, for a sector that has led the market in recent years, the underperformance of semis cannot be ignored.

Start a two-week trial to Bespoke Premium to read today’s full Morning Lineup.
10 Weeks of Bearish Sentiment
As the S&P 500 broke down to the lowest levels of April this week, bullish sentiment according to the weekly AAII survey came in at a new short-term low. After rising to 27.2% last week, only 24.1% of respondents reported as bullish this week, the lowest reading since the end of March.

That resulted in rising bearish sentiment which rose 3.4 percentage points to 38.5%. Conversely, to bullish sentiment, that is the highest reading since the end of March.

With inverse moves in bullish and bearish sentiment, the bull-bear spread has fallen deeper into negative territory meaning bears continue to outnumber bulls, and by a wider margin, although nowhere near the degree as levels seen in 2022.

As we noted throughout 2022 and earlier this year, bears have consistently outnumbered bulls. In fact, this week marked the tenth in a row in which the bull-bear spread was negative. While that is one of only a handful of other streaks lasting for ten or more weeks going back through the history of the survey, it comes on the back of the record 44-week streak that ended this past February. That was only shortly after another 12-week streak ending in March of last year and the second longest streak on record (34 weeks long) that ended in the fall of 2020. In other words, the story remains in which sentiment has been unshakably bearish.

Have you tried Bespoke All Access yet?
Bespoke’s All Access research package is quick-hitting, actionable, and easily digestible. Bespoke’s unique data points and analysis help investors better visualize underlying market trends to ultimately make more informed investment decisions.
Our daily research consists of a pre-market note, a post-market note, and our Chart of the Day. These three daily reports are supplemented with additional research pieces covering ETFs and asset allocation trends, global macro analysis, earnings and conference call analysis, market breadth and internals, economic indicator databases, growth and dividend income stock baskets, and unique interactive trading tools.
Click here to sign up for a one-month trial to Bespoke All Access, or you can read even more about Bespoke All Access here.
Some Improvement in Claims
The latest week’s jobless claims data fell down to 230K from the previous week’s upward revision to 246K. That 16K decline was the largest week over week drop since the first week of the month and brings claims back down to the low end of the past couple of months’ range.
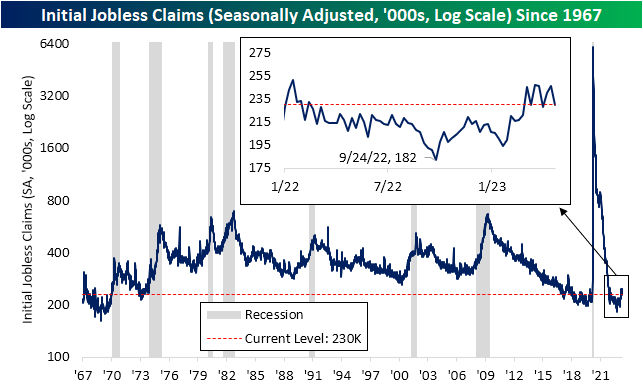
Before seasonal adjustment, claims were lower reaching 225.84K. That is roughly inline with the comparable weeks of last year and the few years prior to the pandemic. As shown in the second chart below, a drop in the current week of the year has very much been the norm historically. As for 2023 as a whole, unadjusted claims have remained relatively flat following the steep seasonal decline in the first weeks of the year. The potential for further seasonal strength will remain in place for the next few weeks as claims historically have reached a seasonal low in late May.

Like initial claims, seasonally adjusted continuing claims also surprised with a decline this week. Continuing claims totaled 1.858 million in the most recent week, down from 1.865 million and better than the expected increase to 1.87 million. Albeit the latest week’s reading was surprisingly strong, the indicator’s uptrend remains firmly in place which as we noted in last week’s Bespoke Report, the overall rise in continuing claims has resembled other recessionary periods.

Have you tried Bespoke All Access yet?
Bespoke’s All Access research package is quick-hitting, actionable, and easily digestible. Bespoke’s unique data points and analysis help investors better visualize underlying market trends to ultimately make more informed investment decisions.
Our daily research consists of a pre-market note, a post-market note, and our Chart of the Day. These three daily reports are supplemented with additional research pieces covering ETFs and asset allocation trends, global macro analysis, earnings and conference call analysis, market breadth and internals, economic indicator databases, growth and dividend income stock baskets, and unique interactive trading tools.
Click here to sign up for a one-month trial to Bespoke All Access, or you can read even more about Bespoke All Access here.
Bespoke’s Morning Lineup – 4/27/23 – AI Fever
See what’s driving market performance around the world in today’s Morning Lineup. Bespoke’s Morning Lineup is the best way to start your trading day. Read it now by starting a two-week trial to Bespoke Premium. CLICK HERE to learn more and start your trial.
“Popping M&Ms in the air and going after them and chomping them like Pac-Man. I actually gained weight in space which no one ever does.” – Mike Massimino
Below is a snippet of content from today’s Morning Lineup for Bespoke Premium members. Start a two-week trial to Bespoke Premium now to access the full report.
We just got a slug of economic data, and the results relative to expectations was mixed. Both initial and continuing jobless claims came in lower than expected which eased some fears about a weaker labor market. GDP, however, was also weaker than expected as was Personal Consumption. Most concerning for the market, though, was that inflation readings in the form of the GDP Price Index and Core PCE both came in higher than expected. Futures are still considerably higher driven by technology as Meta earnings after the close yesterday were considerably better than expected. In response to the data, interest rates increased and futures lost a little bit of steam.
Occasionally, a trend enters the mainstream and sucks all the air out of the room. In the early 1980s, Pac-Man was released with little fanfare and critical acclaim, but it quickly overtook the country. Only 5,000 arcade units were originally produced for the US, but according to Wikipedia, within a year of its release, Pac-Man had grossed more than a billion dollars in quarters and generated more revenue than Star Wars. That’s literally tons of money! One reason for Pac-Man’s popularity was its ability to cross the gender divide; it was not only popular with boys and young men, but also wildly popular among women (hence the subsequent release of Ms. Pac Man). Pac-Man became so popular that in 1982, the song “Pac-Man Fever” reached number nine on the Billboard 100!
Since the early 1980s, there have been several other trends that have had different levels of lasting impact on mainstream consciousness, with the latest being AI. As a caveat, this is in no way meant to imply that AI is a fad. Unlike Pac Man, AI technologies will have a lasting and profound impact on every sector of the economy in ways that we can’t even imagine, so let’s just get that little bit of housekeeping out of the way. But the way in which AI has overtaken every other topic and crowded out every conversation has been unparalleled to anything we have ever seen, and Chat GPT’s ability to make AI technology accessible to everyone is probably a big reason why.
Corporate America is a perfect example of how AI has crowded everything else out. In Tuesday’s conference call from Alphabet (GOOGL), the term AI was mentioned 58 times after being mentioned 59 times in its January call. That’s an average of about once a minute! Alphabet first started to call itself an ‘Ai-first’ company in 2017, so you would think that they’ve been talking about it a lot on their quarterly calls since then. However, prior to the Q4 2022 call, the term was only mentioned more than 20 times once, and the average number of mentions per call up until then was less than ten. It wasn’t until Chat GPT’s launch in November that Alphabet (and many other companies) really started talking about it.
Unlike Pac-Man, AI doesn’t yet have a hit song topping the charts, but it’s probably only a matter of time. In this case, though, “AI-Fever” probably won’t even be written by a human.

Our Morning Lineup keeps readers on top of earnings data, economic news, global headlines, and market internals. We’re biased (of course!), but we think it’s the best and most helpful pre-market report in existence!
Start a two-week trial to Bespoke Premium to read today’s full Morning Lineup.
Bespoke’s Morning Lineup – 4/26/23 – The More Things Change…
See what’s driving market performance around the world in today’s Morning Lineup. Bespoke’s Morning Lineup is the best way to start your trading day. Read it now by starting a two-week trial to Bespoke Premium. CLICK HERE to learn more and start your trial.
“Unlike some governments which fear change and fear the future, China is beginning to reach out toward new horizons, and we salute your courage.” -Ronald Reagan 4/27/1984
Below is a snippet of content from today’s Morning Lineup for Bespoke Premium members. Start a two-week trial to Bespoke Premium now to access the full report.
Times have really changed in the last 39 years. In 1984, when President Reagan became the third US President, after Nixon and Ford, to visit China, it was a much smaller player on the global economic stage. According to the World Bank, Chinese GDP per capita was $250.7 in 1984, compared to $17,121.2 in the US. Through 2021 (the latest available data), GDP per capita in the US has increased by over 300% to $70,248, which sounds impressive at face value. However, in China, the same figure has grown by 4,900% to $12,556 per capita. US GDP per capita is still much larger than it is in China, but the gap has narrowed immensely, and China is on a much more equal footing with the US than it was then.
What’s also changed in the last 39 years is the relationship between the US and China. Reagan’s visit was a major diplomatic event where he was greeted with a 21-gun salute in Tiananmen Square. Today, it’s hard to imagine a US President even considering a visit to China, as diplomatic relations between the two countries have mostly frozen over. If there’s one bipartisan issue in Washington right now, it’s that China is an enemy rather than a friend.
One thing that hasn’t changed between now and 1984 is the issue of Taiwan’s independence, one of the primary reasons for the now icy relationship. During President Reagan’s visit in 1984, Chinese Premier Zhao noted in a news conference with reporters that “The question of Taiwan remains the major obstacle to stable, sustained development of Sino-U.S. relations”. The more things change…
Moving on to the markets this morning, futures are trading modestly higher as concerns over First Republic (FRC) get pushed back, and positive earnings from several companies, most notably Microsoft (MSFT), drive positive sentiment. Given the concerns over the banking sector and the debt limit, Treasuries are at the short end of the curve. Speaking of how the more things change, the more they stay the same, just as MSFT is trading at 52-week highs, the company finds itself in regulatory crosshairs on antitrust concerns. This time it’s the proposed acquisition of Activision (ATVI) which the UK CMA has blocked citing risks to innovation in cloud gaming. Is this the 2020s or the late 1990s?
Looking ahead, as the FOMC appears almost certain to hike rates another 25 basis points (bps) next week, even as risks of a recession increase, the spread between short and long-term US Treasuries yields continues to widen. As of yesterday’s close, the 10-year vs. 3-month yield curve, the Federal Reserve’s preferred measure of the yield curve as an indicator of a recession, was inverted by 164 bps, which is the most extreme reading since the early 1980s. Every other time in the last 60 years that it inverted by as much or more, the economy was either right on the cusp of or already in a recession.

Even more extreme than the actual level of the yield curve is the pace at which it has flattened/inverted over the last year. As shown in the chart below, the 367 bps pace at which the yield curve has flattened over the last year is the most extreme since just before the onset of the second dip of the double-dip recession in May 1981. Besides that, the only other time that the curve flattened by as much was in 1973, just months before the onset of a recession lasting nearly a year and a half.

Our Morning Lineup keeps readers on top of earnings data, economic news, global headlines, and market internals. We’re biased (of course!), but we think it’s the best and most helpful pre-market report in existence!
Start a two-week trial to Bespoke Premium to read today’s full Morning Lineup.
S&P 500 Futures Historically Shorted
As we do each Monday, in last night’s Closer we highlighted the latest futures positioning data from last Friday’s release of the CFTC’s Commitments of Traders report. Of all assets, perhaps the most striking number was in S&P 500 futures. In data as of last Tuesday, a net 15.11% of open interest among speculators was positioned short. That marked the most bearish positioning for this class of investors since September 2007. Prior to that, there have been relatively few instances of speculator positioning exceeding 15% net short. Most of those occurred in the late 1990s and early 2000s when positioning readings were far more volatile on account of open interest being much smaller than it is today. With that being said, we would also note that open interest has been trending lower in the past few years with recent readings being some of the lowest since 2008 on a 52-week moving average basis.
Make sure to check out tonight’s Closer, where we provide an analysis of the performance of the S&P 500 following other historically net short readings.

Have you tried Bespoke All Access yet?
Bespoke’s All Access research package is quick-hitting, actionable, and easily digestible. Bespoke’s unique data points and analysis help investors better visualize underlying market trends to ultimately make more informed investment decisions.
Our daily research consists of a pre-market note, a post-market note, and our Chart of the Day. These three daily reports are supplemented with additional research pieces covering ETFs and asset allocation trends, global macro analysis, earnings and conference call analysis, market breadth and internals, economic indicator databases, growth and dividend income stock baskets, and unique interactive trading tools.
Click here to sign up for a one-month trial to Bespoke All Access, or you can read even more about Bespoke All Access here.
Fed Days Flipping Script
The FOMC blackout period is now underway meaning there will be no communications from FOMC members until the day of the May meeting. As we detailed yesterday, performance outside of and during blackout periods has been pretty weak during the current roughly year-long tightening cycle. However, things have been improving more recently. As for Fed days themselves, the opposite has been true.
In the chart below, we show the performance of the S&P 500 on the day of FOMC rate decisions going back to 1994. Earlier in the current tightening cycle, Fed days offered the market a brief respite from selling. In fact, some of the strongest Fed days (in terms of S&P 500 performance) of the past few decades occurred last year as the rolling 10-meeting average hit a more than decade-long high in July. With that being said, that average has been rolling over with weaker reactions to the FOMC in the past few meetings. In other words, to some extent, S&P 500 performance during and outside of blackout periods and on Fed days has begun to flip the script in the past few FOMC meetings.

Have you tried Bespoke All Access yet?
Bespoke’s All Access research package is quick-hitting, actionable, and easily digestible. Bespoke’s unique data points and analysis help investors better visualize underlying market trends to ultimately make more informed investment decisions.
Our daily research consists of a pre-market note, a post-market note, and our Chart of the Day. These three daily reports are supplemented with additional research pieces covering ETFs and asset allocation trends, global macro analysis, earnings and conference call analysis, market breadth and internals, economic indicator databases, growth and dividend income stock baskets, and unique interactive trading tools.
Click here to sign up for a one-month trial to Bespoke All Access, or you can read even more about Bespoke All Access here.