Bulls Bounce as S&P Stumbles
Although the S&P 500 has dropped in the past week, sentiment has surged with the latest survey from the American Association of Individual Investors (AAII) showing 42.2% of respondents reporting as bullish. That is up 9.1 percentage points from the previous week. While not large enough to earn any long standing superlatives, it marks the largest one week jump in bullish sentiment since July 20th when it increased 10.4 percentage points and indicates a significant increase in bullish sentiment.

Bearish sentiment in turn was lower at 29.6%. However, the weekly decline was much smaller at only 4.9 percentage points. Although the jump in bullish sentiment did not borrow heavily from bears, the 4.9 percentage point drop was the largest one week decline since early June.

Additionally, the drop in bearish sentiment was enough to lift the bull-bear spread back into positive territory. That follows two straight weeks of negative readings. While not as elevated as the late spring and early summer, at these levels, the bull-bear spread is indicating more bullish sentiment than has been observed for much of the past year and a half.

Using the latest AAII data in combination with the findings from the sentiment surveys from Investors Intelligence and the NAAIM Exposure Index, our weekly sentiment composite indicates that investors hold slightly more optimism than has been the historical norm as the index is slightly positive. That compares to negative readings the prior two weeks and extremely bullish readings as recently as the second half of July.
In last night’s Closer, we included a look at this composite with the addition of another sentiment indicator: the TD Ameritrade Investor Movement Index.


The Bespoke 50 Growth Stocks — 9/7/23
The “Bespoke 50” is a basket of noteworthy growth stocks in the Russell 3,000. To make the list, a stock must have strong earnings growth prospects along with an attractive price chart based on Bespoke’s analysis. The Bespoke 50 is updated weekly on Thursday unless otherwise noted. There was one change to the list this week.
The Bespoke 50 is available with a Bespoke Premium subscription or a Bespoke Institutional subscription. With Bespoke Premium, you’ll receive a number of daily market updates from us along with our weekly newsletter and a portion of our investor tools. With Bespoke Institutional, you’ll receive everything that’s included with Premium plus additional daily macro analysis and more stock-specific research.
To see all 50 stocks that currently make up the Bespoke 50, simply start a two-week trial to Bespoke Premium or Bespoke Institutional.

The Bespoke 50 performance chart shown does not represent actual investment results. The Bespoke 50 is updated weekly on Thursday. Performance is based on equally weighting each of the 50 stocks (2% each) and is calculated using each stock’s opening price as of Friday morning each week. Entry prices and exit prices used for stocks that are added or removed from the Bespoke 50 are based on Friday’s opening price. Any potential commissions, brokerage fees, or dividends are not included in the Bespoke 50 performance calculation, but the performance shown is net of a hypothetical annual advisory fee of 0.85%. Performance tracking for the Bespoke 50 and the Russell 3,000 total return index begins on March 5th, 2012 when the Bespoke 50 was first published. Past performance is not a guarantee of future results. The Bespoke 50 is meant to be an idea generator for investors and not a recommendation to buy or sell any specific securities. It is not personalized advice because it in no way takes into account an investor’s individual needs. As always, investors should conduct their own research when buying or selling individual securities. Click here to read our full disclosure on hypothetical performance tracking. Bespoke representatives or wealth management clients may have positions in securities discussed or mentioned in its published content.
Housing Prices Back on the Rise
In last night’s Closer, we discussed a couple of recent releases of alternative housing data sets including the latest delinquency data from Black Knight and housing inventory numbers from Realtor.com. Zeroing on the latter, Realtor.com’s August inventory data showed only 585K active listings nationally after seasonal adjustment. Inventories have been drawn upon for seven months in a row, resulting in the lowest level since June 2022. On the bright side, August did also see a seasonally unusual uptick in new listings, but that only puts a small dent in what are historically low inventories.

Using state level data aggregated by region, the multi-month drawdown in inventories has been observed throughout the country. The South has tended to have the highest quantity of homes on the market while the opposite applies to the Northeast. In fact, whereas other regions have generally seen inventories rise off of their lowest levels reached in late 2021, the Northeast is only slightly above its series low.

Similar to aggregate inventory levels, median days on market are well off their record lows early last year but have begun to roll over. Currently, median days on market is at 53 days, which is well below the pre-pandemic range.

Given the continued low supply, prices have swung higher with median prices at the highest level since last July both in terms of total price and price per square foot. Rising at a high single digit month over month annualized pace, August also saw the most rapid appreciation since June of last year.

Breaking down home prices by geography, the West has the highest median home price in the country, but those prices have been relatively stagnant since early 2022. The Northeast, on the other hand, has consistently had the second highest prices in the country and prices have been steadily rising. In fact, prior to seasonal adjustment, prices in the Northeast have risen 11% YoY compared to the next highest of 8.8% YoY in the Midwest and low single digit growth in the South and West. For more in-depth coverage of housing and the economy, make sure to subscribe to our Closer feed.

Claims Notch New Lows
The latest update of jobless claims was broadly positive with both initial and continuing claims moving lower by more than expected. Although initial claims were revised up by 1K to 229K last week, this week’s reading fell down to 216K. That means claims have broken down out of the past several months range, notching the lowest levels since the end of January.

Before seasonal adjustment, claims are even more impressively low at 190K. That marks the third week in a row below 200K, however, that is still above the comparable readings for the same weeks of the year in 2018, 2019, and 2022. Additionally, as we show in the second chart below, the current week of the year has historically been the one to see claims put in their annual low meaning from a seasonal perspective, claims will face headwinds from here on out.

Switching over to seasonally adjusted continuing claims, like initial claims the latest reading is back down to the low end of the recent range. Claims have been fluctuating around 1.7 million over the past couple of months, but at 1.679 million this week, continuing claims are tied with the week of July 15th for the lowest reading since January 21st.

Bespoke’s Morning Lineup – 9/7/23 – More September Weakness
See what’s driving market performance around the world in today’s Morning Lineup. Bespoke’s Morning Lineup is the best way to start your trading day. Read it now by starting a two-week trial to Bespoke Premium. CLICK HERE to learn more and start your trial.
“There is no law. It’s just the best lawyers always win.” – Ron Baron

Start a two-week trial to Bespoke Premium now to get full access the Morning Lineup.
Trade disputes and the potential for moving towards more closed borders on commerce has weighed on futures this morning. Futures are down across the board, but the Nasdaq is taking it hardest as additional restrictions on Apple iPhone usage for Chinese government employees could be coming. In the other direction, both the US and Europe are considering adding additional tariffs on Chinese steel imports.
On the economic side of things, Non-Farm Productivity and Unit Labor Costs were both higher than expected, and jobless claims came in lower than expected on both an initial and continuing basis. That kind of data won’t do much to weigh down interest rates, but it will certainly pressure stock prices.
Given its reputation, September has started just how you would expect it to. While the S&P 500 barely avoided finishing the first three trading days of the month down 1%, the Nasdaq finished down 1.16% month to date yesterday. The chart below shows the index’s performance during the first three trading days of the month for all years since 1971, and the red bars indicate years that the index was down 1%+. As shown, 1%+ declines in the first three trading days haven’t been particularly uncommon, especially in the last six years.

So, does a bad start to September for the Nasdaq mean anything with respect to the rest of the month? The table below lists each year that the Nasdaq was down 1%+ in the first three trading days of the month. For each year, we also show the index’s YTD performance heading into the month along with its performance for the remainder of the month. Of the sixteen prior years shown, the Nasdaq’s average change for the rest of the month was a decline of 2.85% (median: -3.70%) with gains less than a third of the time. That’s considerably worse than the 0.85% average decline for all years since 1971.
While it appears that months which start out poorly for the Nasdaq lead to further declines over the course of the rest of September, there is a caveat. If you look at the years when the Nasdaq was up over 10% heading into September but then traded down over 1% in the first three trading days, performance wasn’t nearly as bad. In fact, the S&P 500’s average rest of month performance was a gain of 0.61% (median: 1.56%) with positive returns four out of seven times.

Start a two-week trial to Bespoke Premium to read today’s full Morning Lineup.
The 20 Most Loved Stocks by Wall Street Analysts
In the large-cap Russell 1,000, there are more than 18,800 individual analyst ratings, meaning the average stock in the roughly 1,000 member index has more than 18 analyst recommendations. It’s widely known that there are way more “buy” ratings than “sell” or “hold” ratings, but to put a number to it, right now 54.5% of all analyst ratings in the Russell 1,000 are “buy” ratings. (A “buy” rating includes terms like “outperform” or “overweight” that some firms prefer to use.)
Today we wanted to provide you with a list of the current stocks in the Russell 1,000 that have the highest percentage of “buy” ratings. These could be considered the most loved stocks by Wall Street analysts. (To be included on the list below, the stock needed to have at least five analyst ratings.)
Starting at the top, there are nine stocks that have 100% buy ratings, and the name with the most number of buys is Alexandria Real Estate (ARE) at eleven. WillScot Mobile (WSC), Royalty Pharma (RPRX), Liberty Media Sirius XM (LSXMA), Kirby (KEX), Curtiss-Wright (CW), Churchill Downs (CHDN), Service Corp (SCI), and Howard Hughes (HHH) are the eight other stocks with 100% buy ratings. The remaining eleven stocks shown have at least 93% buy ratings, and the most notable are two mega-caps with $1+ trillion market caps: Amazon (AMZN) and NVIDIA (NVDA). At the moment, 61 of 64 analyst ratings for Amazon (AMZN) are buys, while 59 of 63 ratings for NVIDIA (NVDA) are buys.
NVIDIA (NVDA) has already surged 232% in 2023, so it’s pretty remarkable that analysts are still this bullish on the name. It may be hard to believe, but the average analyst price target for NVDA has moved up to $638/share. NVDA’s current share price is 26.6% below that price target. The average stock in the Russell is only 14% below its consensus price target, so analysts expect more gains for NVDA than they do for the average name in the index.
Remember, from a contrarian’s perspective, a stock with an extremely high percentage of buy ratings may be a name to avoid. After all, once you get to 100%, there’s no more room for analysts to get more bullish!

The Closer – Credit Spreads, WTI Surge, Beige Book, PMIs, Housing Data – 9/6/23
Log-in here if you’re a member with access to the Closer.
Looking for deeper insight into markets? In tonight’s Closer sent to Bespoke Institutional clients, we begin with a look into credit spreads and the steep backwardation of crude (page 1). We follow up with a quantified look at the Beige Book (page 2), trade balance (page 3), and ISM data (page 4). We then take a look into the latest housing delinquency data from Black Knight (page 5) in addition to housing inventories from Realtor.com (pages 6 – 7). We finish with an update on the latest investor sentiment data from TD Ameritrade (page 8).

See today’s full post-market Closer and everything else Bespoke publishes by starting a 14-day trial to Bespoke Institutional today!
2% Moves Are Back
As we noted in a tweet this morning, price action of US equities has been flipped from Tuesday with large caps suffering larger losses than small caps. Looking at yesterday, the decline in the Russell 2,000 (-2.1%) dwarfed the S&P 500’s (-0.4%). For the small cap Russell 2,000, that marked the first daily move of at least 2% (positive or negative) since June 5th when the index rallied 2.4%. As shown below, that three month stretch without a daily move of 2% is far from the longest on record, but it does stand out as one of the largest in some time. Running for 61 trading days, it was the longest since the 133 day streak ending on 10/9/18.

As previously mentioned, today’s price action is a bit of the reverse of Tuesday, however, the S&P 500 is far from a 2% drop of its own. In fact, the S&P 500 has been on an even longer streak without a 2% daily move. At 136 trading days, the current streak ranks as the longest since February 2018 (310 days). As with the Russell, the current streak would have a long way to go to reach records that lasted for years like from 2003 to 2006. Regardless, the fact of the matter is that day to day volatility by this measure has been extremely muted of late.

Bespoke’s Morning Lineup – 9/6/23 – Living at the Woodshed
See what’s driving market performance around the world in today’s Morning Lineup. Bespoke’s Morning Lineup is the best way to start your trading day. Read it now by starting a two-week trial to Bespoke Premium. CLICK HERE to learn more and start your trial.
“It’s not what you look at that matters, it’s what you see.” – Henry David Thoreau
Start a two-week trial to Bespoke Premium now to get full access the Morning Lineup.
It’s another weak morning for US equity futures as the backdrop of higher rates and oil prices weigh on sentiment. Futures are lower across the board, but not by a large amount. The key report of the day will be ISM Services at 10 AM. Plus, there are a number of conferences today, so be on the look out for individual company news throughout the day.
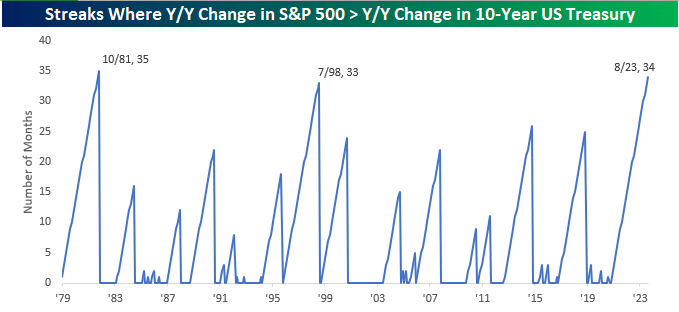
176 years ago today, Henry David Thoreau moved in with Ralph Waldo Emerson and his family after living in a woodshed on Walden Pond for two years. Two years in a shack is a long time, but bonds have been out behind, or maybe more accurately, in front of the woodshed for even longer. As measured by the Bank of America 10+ Year US Treasury Index, August was the 31st straight month that the year/year total return for US Treasuries was negative, easily surpassing the 15th month streak than ended in December 1980. Not only has the y/y change in long-term Treasuries been negative for more than two and a half years, but the y/y change has also lagged the y/y total return of the S&P 500 for 34 straight months.
Since 1979, there have only been two other periods where the 10-year underperformed the S&P 500 on a y/y basis for more months. The most recent ended in July 1998 at 33 months while there was a 35-month streak ending in October 1981. Given the way the numbers work out, unless treasuries stage a monster rally and/or stocks take a sharp leg lower this month, it’s almost a guarantee that the current streak will at least tie, if not exceed, the 35-month streak from 1981. In at least the last forty years, there hasn’t been a worse time to be creditor of Uncle Sam.
Start a two-week trial to Bespoke Premium to read today’s full Morning Lineup.
Bespoke’s Consumer Pulse Report — September 2023
Bespoke’s Consumer Pulse Report is an analysis of a huge consumer survey that we run each month. Our goal with this survey is to track trends across the economic and financial landscape in the US. Using the results from our proprietary monthly survey, we dissect and analyze all of the data and publish the Consumer Pulse Report, which we sell access to on a subscription basis. Sign up for a 30-day free trial to our Bespoke Consumer Pulse subscription service. With a trial, you’ll get coverage of consumer electronics, social media, streaming media, retail, autos, and much more. The report also has numerous proprietary US economic data points that are extremely timely and useful for investors.
We’ve just released our most recent monthly report to Pulse subscribers, and it’s definitely worth the read if you’re curious about the health of the consumer in the current market environment. Start a 30-day free trial for a full breakdown of all of our proprietary Pulse economic indicators.
