Nike (NKE) – Can the Swoosh Recover?
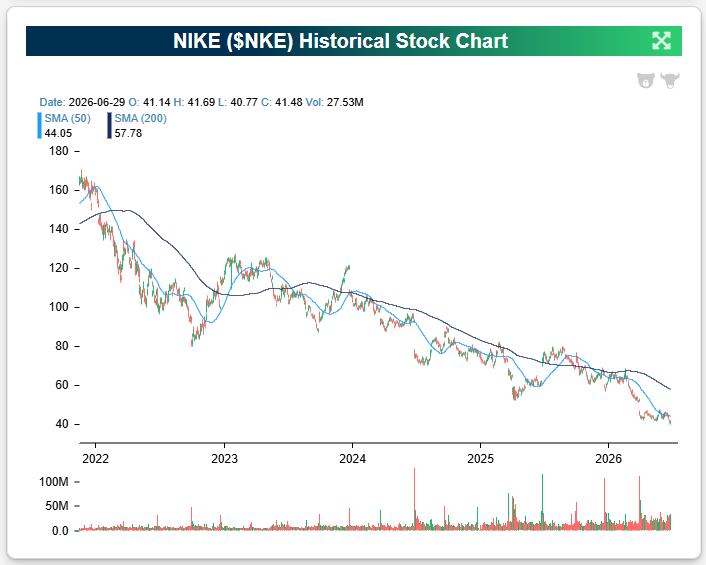
Nike (NKE) is set to report earnings after the close after falling more than 20% in Q2. Below is a look at NKE’s price chart since early 2022. It’s ugly.
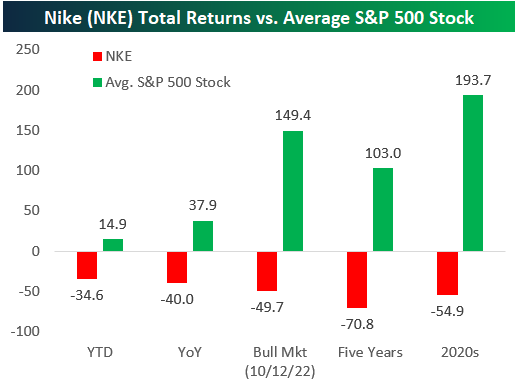
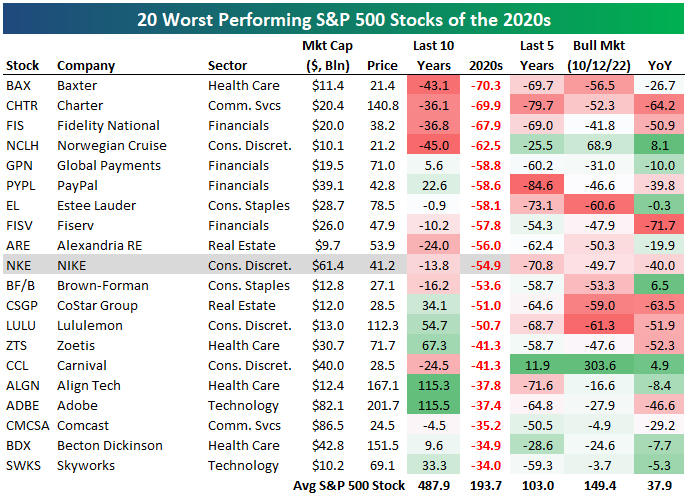
It hasn’t just been a bad year for Nike (NKE), but rather a bad decade.
So far in the 2020s, the average stock in the S&P 500 is up 193.7%. NKE is down 54.9%.
As shown below, during the current bull market that began in October 2022, the average stock is up 149.4% versus NKE’s decline of 49.7%.
Over the last five years, NKE is down more than 70%, while the average S&P stock has more than doubled.
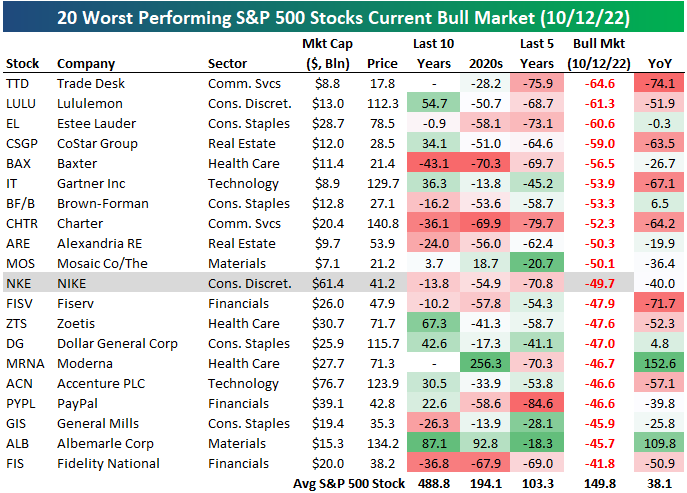
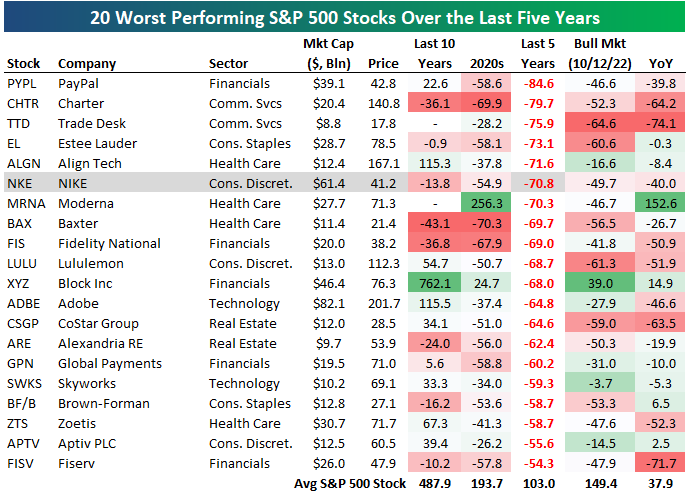
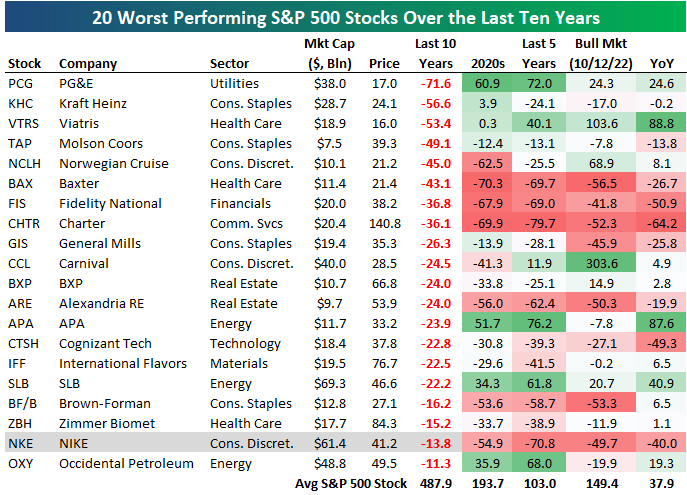
Below we show tables of the 20 worst performing current S&P 500 members over various time frames: during the current bull market, over the last five years, since the start of 2020, and over the last ten years.
Nike ranks in the bottom 20 across all four time frames.
During the current bull, NKE has been the 11th worst performing S&P 500 stock. Over the last five years, NKE has been the sixth worst. NKE ranks as the tenth worst since the start of 2020, and it has been the 19th worst over the last ten years.
This has been an almost unimaginable decline for what was one of the bluest of blue chips out there. NKE has to be one of the most disappointing stocks of the 2020s at this point. It has three and a half years left to turn the decade around, though, and America certainly loves a comeback story!
Want more from Bespoke? You can start by joining our Think BIG mailing list, where you’ll receive an interesting market stat in your inbox a few times per week. All we need is your email address. Join now by clicking here or on the image below.

Q1 2026 Earnings Conference Call Recaps: AeroVironment (AVAV)
Bespoke’s Conference Call Recaps use AI to summarize lengthy earnings calls. The commentary below is AI-generated and then edited by Bespoke for quality control. As always, none of these summaries should be construed as recommendations to buy or sell any securities, and investors should do their own research and/or consult with a financial professional before making any investment decisions.
Our latest recap available to Bespoke subscribers covers AeroVironment’s (AVAV) Q4 2026 earnings call.

AeroVironment (AVAV) is a defense-technology company that makes unmanned aircraft systems (UAS), loitering munitions, one-way attack drones, counter-drone systems, directed-energy weapons, missile interceptors, space communications equipment, and mission software. Its products serve the US military and allied governments, giving investors a view into drone warfare, missile-stockpile rebuilding, defense-budget priorities, satellite modernization, and the push toward cheaper, scalable weapons. AVAV reported record quarterly revenue of $642 million, up 31% organically, with $572 million of bookings and $1.2 billion of funded backlog. Demand was strongest for Switchblade (loitering munitions), Red Dragon (one-way attack drones), Titan (radio-frequency counter-drone systems), and JUMP 20 (UAS). Management described counter-UAS as an early-stage growth market: Titan sales doubled, LOCUST (a directed-energy laser weapon) can defeat drones for under $10 per shot, and Freedom Eagle-1 (a low-cost missile interceptor) is being designed to intercept drones for roughly $100,000–$150,000 versus millions for traditional missiles. AVAV is investing 12%–14% of revenue in capacity across Salt Lake City, Huntsville, Albuquerque, and Dayton, leaving fiscal 2027 free cash flow negative. Guidance assumes defense-budget delays push orders and profits toward the second half, but management expects strong US and international demand as inventories remain depleted. AVAV shares were up more than 15% on 6/30 in reaction to better-than-expected EPS and revenue…
Continue reading our Conference Call Recap for AVAV by becoming a Bespoke Institutional subscriber. You can sign up for Bespoke Institutional now and receive a 14-day trial to read our newest Conference Call Recap. To sign up, choose either the monthly or annual checkout link below:
Bespoke’s Morning Lineup – 6/30/26 – Put a Bow On It
See what’s driving market performance around the world in today’s Morning Lineup. Bespoke’s Morning Lineup is the best way to start your trading day. Read it now by starting a two-week trial to Bespoke Premium. CLICK HERE to learn more and start your trial.
“Commerce with all nations, alliance with none, should be our motto.” – Thomas Jefferson

Below is a snippet of commentary from today’s Morning Lineup. Start a two-week trial to Bespoke Premium to view the full report.
US stocks are looking to close out what has been a very strong quarter on a positive note. S&P 500 futures are slightly higher with a gain of 0.10%, while the Nasdaq is up 0.25%. Treasury yields are slightly higher, with the 10-year yield trading just below 4.4%. Crude oil prices, along with gold, are slightly higher, while Bitcoin is down over 2% and trading back below $59K.
In Asia, stocks had a mixed session with the Nikkei rallying 0.9% and South Korea gaining 1.0%. In the other direction, Hong Kong fell 0.6%. Chinese PMI data for June came in slightly better than expected for both the Manufacturing and Services sectors, with both coming in above 50, the threshold for expansion. In South Korea, Retail Sales rebounded 0.1% in May after falling 3.5% in April, but Industrial Production fell 3.0%, accelerating April’s 0.7% pace of decline.
European stocks are closing out the quarter on a much stronger note. The STOXX 600 is up over 1%. Germany is leading the gains (even though they were knocked out of the World Cup) with a gain of 1.5%, while France and Spain are both up 0.6% or less. Along with the strength in German stocks, Retail Sales in the country surprised to the upside, rising 1.1% versus forecasts for no change. In France and Italy, there was also some good news on the inflation front as CPI for June came in weaker than expected.
Getting back to the US, the only data on the calendar is the Chicago PMI at 9:45 and Consumer Confidence and JOLTS at 10 AM. In terms of earnings, we’ll also get reports from Nike (NKE) and Constellation Brands (STZ) after the close. NKE is coming off back-to-back quarterly reports of falling by double-digits, while STZ has reacted positively to each of its last five reports.
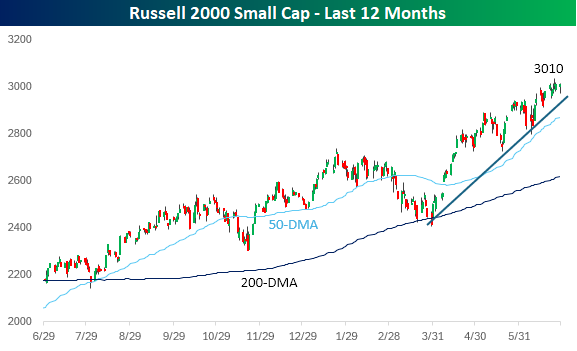
With a gain of 21.3% YTD, the Russell 2000 is on pace for its best first half of the year since 1991.
Because almost all the gains were squeezed into Q2, the small-cap benchmark is on pace for a quarterly gain of over 20%, which would mark the best quarter since the Q4 2020 post-Covid reopening rally (+31%), which was also the largest quarterly gain in the index’s history.
As the chart below illustrates, the period coming out of Covid not only included the Russell’s strongest-ever quarter but also two quarters within a three-quarter period when it rallied more than 20%.
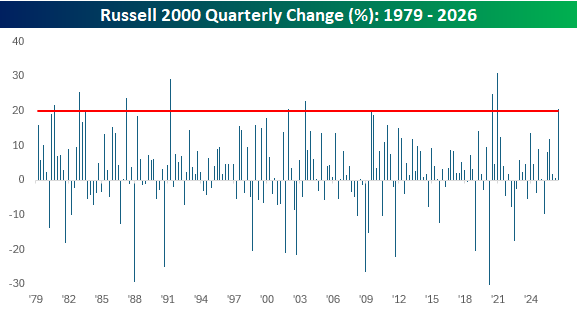
The chart below shows where each prior quarterly 20%+ gain occurred within the long-term history of the Russell 2000. They have occurred within all stages of bull market cycles, so it’s hard to say much in terms of what they indicate, but it is worth pointing out that following the nine prior quarterly gains of at least 20%, the Russell 2000’s average change in the following quarter was a gain of 7.7% with positive returns 78% of the time. That’s more than twice the 2.8% average gain for all periods since 1979.
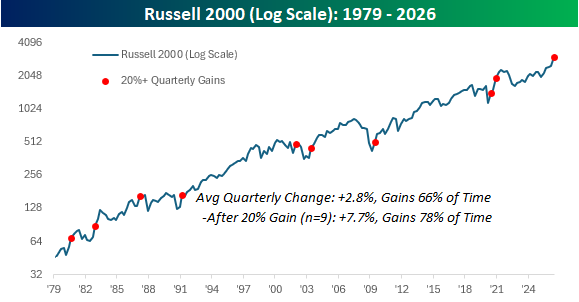
From a short-term perspective, small-caps look a bit stretched and have shown a slight loss of momentum over the past week. The index is also still trading 5% above its 50-day moving average, which means that a minor pullback wouldn’t even do significant technical damage.
The key test will be the recent index rebalancing. Many of the top-performing stocks that drove the Russell 2000 to these heights “graduated” to the Russell 1000 in last week’s rebalancing. For the rally to continue, the index will need some new blood to step up.
Start a two-week trial to Bespoke Premium to continue reading today’s full Morning Lineup.
The Closer – Independence Affirmed, Magnificent Day for Mag 7 – 6/29/26
Log-in here if you’re a member with access to the Closer.
- With today’s decision on Fed Governor Lisa Cook, the Supreme Court affirmed the independence of the Fed.
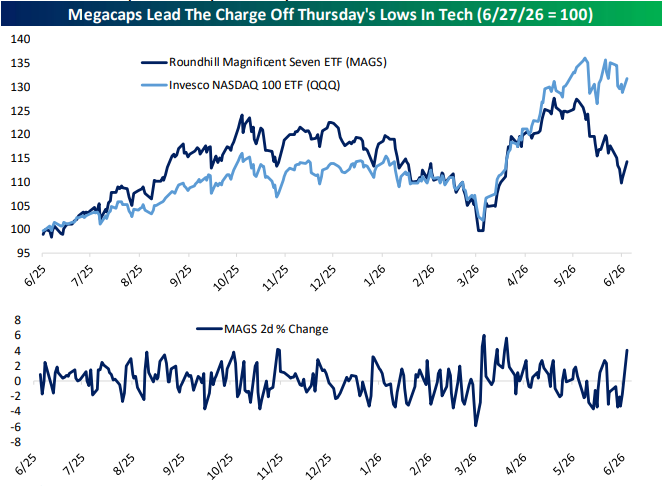
- The Magnificent 7 had their best two-day showing since April today as the group has diverged from the rest of the large caps over the past couple of months.
- Our Five Fed average of regional Fed manufacturing activity indices finished June at a fractional new high for the current cycle.
See today’s full post-market Closer and everything else Bespoke publishes by starting a 14-day trial to Bespoke Institutional today!
You Say Up, I Say Down
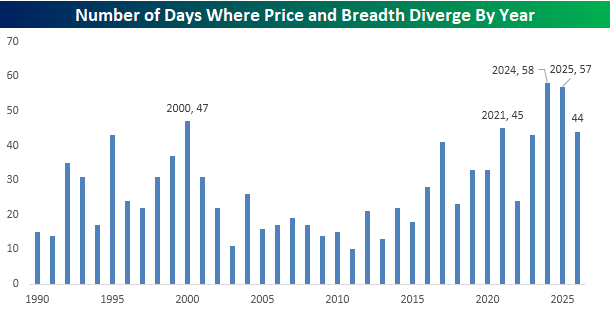
With five straight down days last week, you wouldn’t expect to see breadth, which has been weak for several weeks, to suddenly show strength, but that’s exactly what we saw last week. Through Friday’s close, the S&P 500 has more daily gainers than losers (positive breadth) for six straight days, which was tied for the longest streak of positive readings in nearly a year.
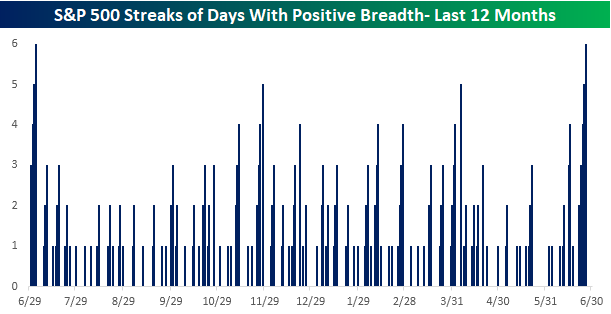
Just as unusual as last week’s positive breadth amid a falling market, today, the S&P 500 is up over 1%, and breadth is negative. After five straight days of positive breadth divergences last week, today we’re seeing a negative breadth divergence, extending the streak of divergent breadth days to a record six trading days. Like an unhealthy relationship, price and breadth just can’t seem to agree on anything.
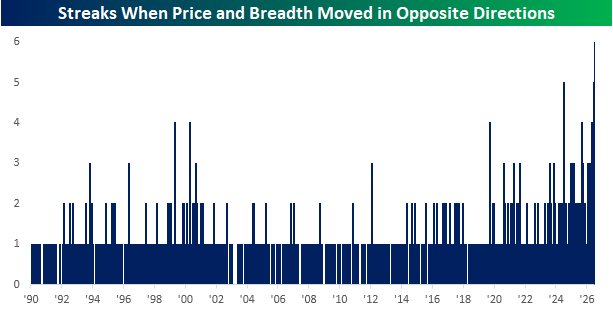
Besides the fact that we’re currently in the middle of the longest streak of divergent breadth days on record, the chart below also shows an increasing frequency of divergent breadth days in recent years. The chart below breaks down the number of diverging days by year. The record for most diverging days was 58 in 2024, followed by 57 in 2025 (we told you there was an increased frequency in recent years), but this year there have already been 44 – and the year is only half over!
There’s obviously no guarantee that the pace of diverging days in the second half will match the pace in the first half; if it did, the S&P 500 would have 88 diverging breadth days in 2026. That’s 30 more than the prior record from 2024 and works out to more than once every three trading days!
Want more from Bespoke? You can start by joining our Think BIG mailing list, where you’ll receive an interesting market stat in your inbox a few times per week. All we need is your email address. Join now by clicking here or on the image below.
Going Nowhere
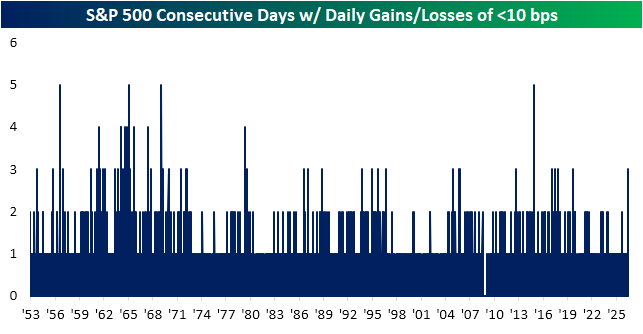
The S&P 500 is kicking off the week with a gain of over 1% as of midday Monday. In multiple ways, it has been a sharp turnaround from last week. For starters, last week saw the S&P 500 fall on all five trading days, with the last three sessions having remarkably small moves. As shown below, the index was basically flat from Wednesday to Friday as each day didn’t even see a move greater than 10 bps. Additionally, we would note that despite the five-day losing streak, it wasn’t exactly all doom and gloom as the index also had positive breadth on each of the five days.
Historically, it has been uncommon for the S&P 500 to move so little day-to-day as it did last week. As shown below and as we first highlighted in Friday’s Sector Snapshot, last week was the first time the index rose or fell less than 10 bps for at least three days in a row since September 2019. In total, since the start of the five-day trading week in 1953, the S&P 500 has only had similar streaks 53 times (including this most recent instance). Given the over 1% gain as of this writing, the current streak is likely to end today, which would check out historically as only a handful of these prior streaks extended to more than three days. In fact, since 1970 only two streaks have lasted more than three days: a four-day streak ending in May 1979 and a five-day streak ending in November 2014.
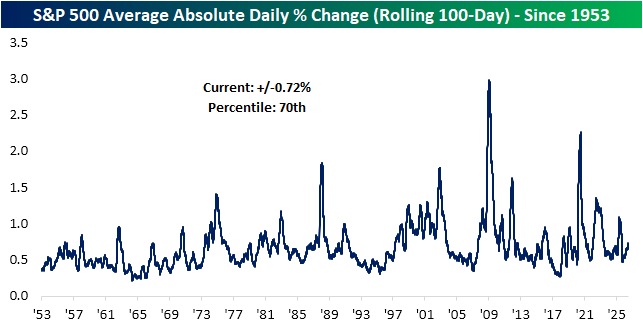
Finally, we would note that this latest string of snoozer sessions comes on a slight upswing in volatility. As shown below, over the past 100 sessions, the S&P 500 has averaged a move of 0.72%. While that’s far from earning any superlatives, it ranks in the 70th percentile of readings over the past several decades.
Want more from Bespoke? You can start by joining our Think BIG mailing list, where you’ll receive an interesting market stat in your inbox a few times per week. All we need is your email address. Join now by clicking here or on the image below.
Bespoke’s Morning Lineup – 6/29/26 – Rebounding After An Unusual Week
See what’s driving market performance around the world in today’s Morning Lineup. Bespoke’s Morning Lineup is the best way to start your trading day. Read it now by starting a two-week trial to Bespoke Premium. CLICK HERE to learn more and start your trial.
“Real men despise battle, but will never run from it.” – George Washington
Below is a snippet of commentary from today’s Morning Lineup. Start a two-week trial to Bespoke Premium to view the full report.
After an unusual week where the S&P 500 traded lower every day but market breadth remained positive, leaving the average S&P 500 stock up 0.20%, investors are heading into the short week looking to push the indices higher. The S&P 500 is priced to open 0.8% higher, while the Nasdaq is poised to gain more than 1%. Investors will be watching mega-caps and memory stocks, which both came under pressure late last week, to see if they can get back on track.
Treasury yields are little changed, while oil trades up over 1% to $70 per barrel. Regarding oil, it could be worse as the US and Iran lobbed strikes at each other over the weekend but have since agreed to pause any strikes ahead of talks tomorrow. Gold prices are down about 1% while Bitcoin rallies just over 2% and moves back above $60K.
In Asia, it was a relatively quiet start to the week relative to recent trading. The Nikkei rallied 0.2% while South Korea fell 0.2%. Chinese stocks saw a little more action, rallying more than 1%. In Europe, stocks are mostly lower, but the losses have been modest. The STOXX 600 is down only 0.1% while France and the UK lead the losses with a decline of 0.4%.
In the US today, there’s not much data, but later in the week, we’ll have several key economic reports capped off with the June employment report on Thursday. In earnings news, some of the reports to focus on will be AeroVironment (AVAV) after today’s close and Constellation Brands (STZ) and Nike (NKE) after the close tomorrow.
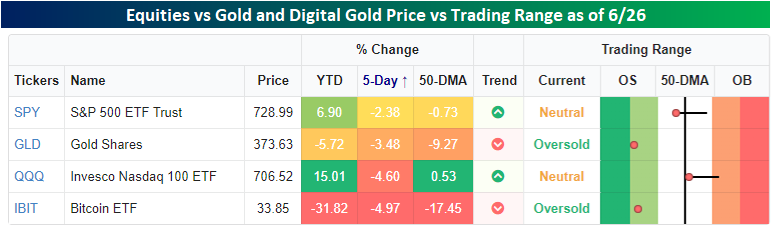
As bad a week as it was for the S&P 500 last week, it was even worse for both physical gold and its digital cousin (Bitcoin). Physical gold, as measured by the Gold ETF (GLD), fell more than a percentage point more than the S&P 500, while Bitcoin, as tracked by the Bitcoin ETF (IBIT), lost nearly 5%. Bitcoin’s performance was even worse than the Nasdaq 100 ETF (QQQ), which some would consider a more digital version of the S&P 500. While equities, gold, and Bitcoin were all down last week, the weakness was more of an anomaly relative to this year’s trend for equities, while it was a continuation of a trend of weakness for gold and Bitcoin, which were both already down YTD heading into last week.
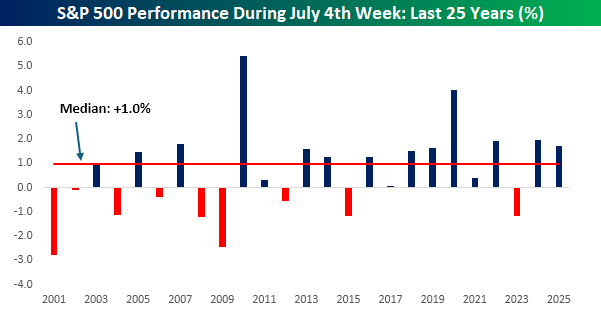
The rally in futures this morning comes right on cue for what is typically a positive time of year for equities. As shown in the chart below, the S&P 500’s median performance during the July 4th week over the last 25 years has been a gain of 1.0%, with positive returns just under two-thirds of the time. In more recent years, performance has been even stronger with a median gain of 1.6% and positive returns nine out of ten times.
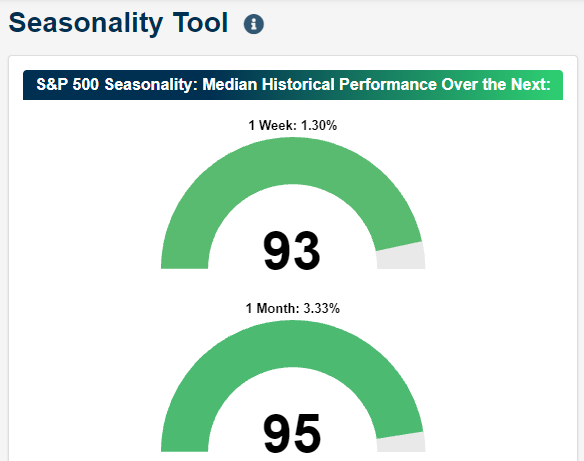
The strong seasonal tailwind shows up in our Seasonality Tool as well. As shown in the snapshot below, the S&P 500’s median one-week and one-month returns from the close today rank in the 93rd and 96th percentile relative to all other periods of the year with gains of 1.3% and 3.45%, respectively.
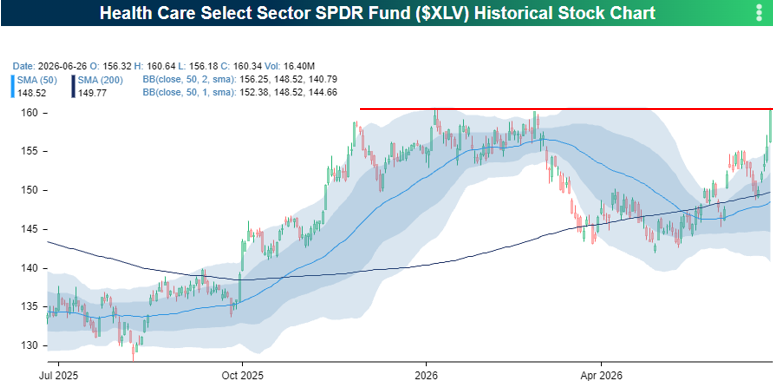
Even with the S&P 500 down over 2% last week, most sectors finished higher. Leading the charge were Real Estate (XLRE), Utilities (XLU), and Health Care (XLV), which were all up over 3%. Health Care’s massive 7%+ surge was its largest single-week gain in over a year, single-handedly rescuing the sector from a YTD loss to a 3%+ gain.
As shown in the chart below, last week’s rally took the sector ETF right up to key resistance around $160. This is a formidable ceiling: XLV failed to break it three times late last year and early this year, and it previously stalled out there back in the summer of 2024. The sector has now had about two years to convalesce, so we’ll see if this base is strong enough to finally push it into a higher trading range.
Start a two-week trial to Bespoke Premium to continue reading today’s full Morning Lineup.
Brunch Reads – 6/28/26
Welcome to Bespoke Brunch Reads — a linkfest of some of our favorite articles over the past week. The links are mostly market-related, but there are some other interesting subjects covered as well. We hope you enjoy the food for thought as a supplement to the research we provide you during the week.
Two Shots in Sarajevo: By June 1914, Europe was divided into rival alliances and dealing with growing nationalism, military competition, and disputes over territory. Tensions were especially high in the Balkans, where Serbia supported efforts to unite South Slavic peoples, including those living under Austro-Hungarian rule. Archduke Franz Ferdinand, heir to the Austro-Hungarian throne, became a target for Serbian nationalist militants when he visited Sarajevo, the capital of Bosnia, on June 28, 1914.
During the visit, several conspirators positioned themselves along the archduke’s motorcade route. One threw a bomb at his car, but it bounced away and exploded beneath another vehicle. Later that morning, Franz Ferdinand decided to visit people injured in the attack. After his driver took a wrong turn and stopped to reverse, 19-year-old Gavrilo Princip happened to be standing nearby. Princip approached the car and fired two shots, killing Franz Ferdinand and his wife, Sophie.
Austria-Hungary blamed Serbia for the assassination and, with Germany’s support, issued a set of demands that Serbia did not fully accept. Austria-Hungary declared war on Serbia on July 28. The alliance system then brought Russia, Germany, France, Britain, and other countries into the conflict, setting World War I and, subsequently, World War II, into motion.

Business
Secretive Wall Street Powerhouse Jane Street Seizes the AI Spotlight (WSJ)
Jane Street has grown into one of Wall Street’s most profitable firms, earning nearly twice as much as Goldman Sachs or Morgan Stanley last quarter with a fraction of their staff. After decades of secrecy, it is becoming more public to recruit AI talent, attract startup investments, and expand its use of the technology in trading. [Link]
Continue reading our weekly Brunch Reads linkfest by logging in if you’re already a member or signing up for a trial to one of our two membership levels shown below! You can cancel at any time.

The Bespoke Report – Equity Market Pros and Cons – Q3 2026
This week’s Bespoke Report is an updated version of our “Pros and Cons” edition for Q3 2026.
With this report, you’re able to get a complete picture of the bull and bear case for US stocks right now. It’s heavy on graphics and light on text, but we let the charts and tables do the talking.
On page three of the report, you’ll see a full list of the pros and cons that we lay out. Slides for each topic are then provided on page four and beyond.
To read this report and access everything else Bespoke’s research platform has to offer, start a trial to any of our three membership levels today!

A Month For “the Rest”
We’ve made numerous mentions of the weakness in mega-cap stocks so far this month, and given their weightings in the S&P 500, the impact on the index is notable. The S&P 500 peaked on 6/2 and quickly sold off in the early days of June. A mid-month rally brought the market back near its prior highs, but momentum has stalled since 6/15 with a string of weak days with consistent intraday selling.
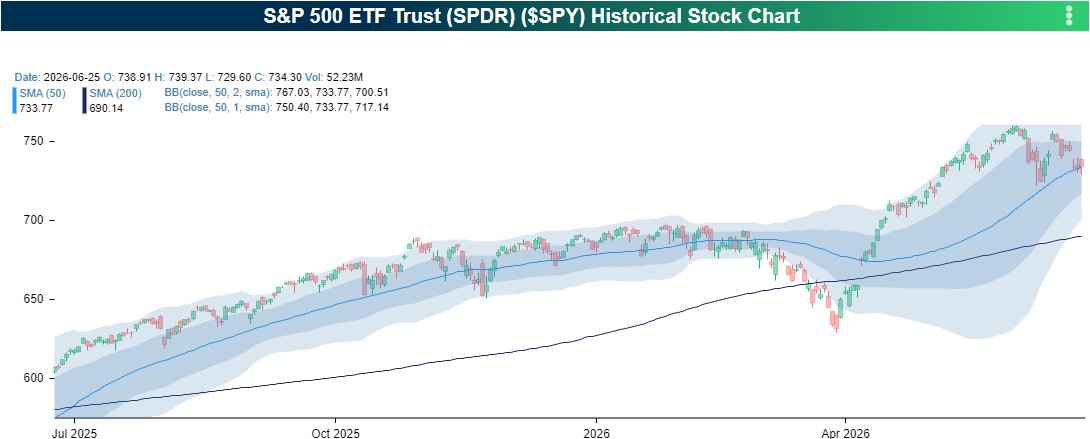
Although the cap-weighted S&P 500 has been weak, performance outside the largest eight stocks has been better, and the average stock has seen modest gains this month. This is reflected in the performance of the S&P 500 Equal Weight index as proxied by the RSP ETF. Unlike the cap-weighted index, RSP made a higher high in mid-June, but it has also seen some, although not as consistent, weakness in the last few days.
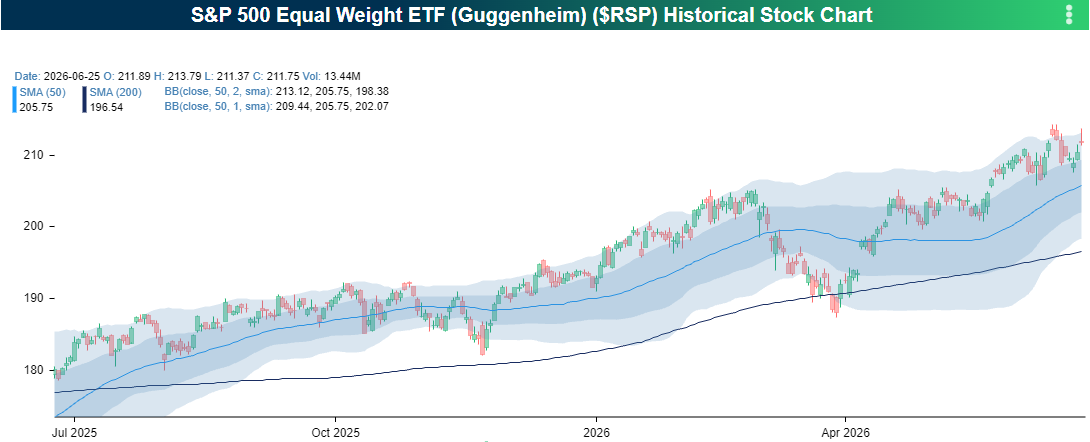
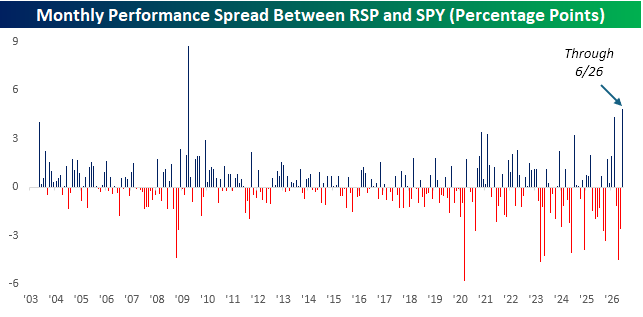
With their divergent returns, the cap-weighted S&P 500 (SPY) is down 2.4% this month, while the equal-weighted (RSP) is up 2.4% for a performance gap of 4.8 percentage points. There are still a few days left in the month, but this type of divergence is nearly unheard of.
What’s also interesting about the divergent returns is that this June is on pace to be the second time this year that the monthly performance spread between the two indices exceeded four percentage points. In the nearly 17 years from the launch of RSP in 2003 through 2019, the monthly performance gap between RSP and SPY was typically narrow, exceeding three percentage points just three times. In the six and a half years since then, though, there have been twelve separate months when the performance spread exceeded three percentage points. Quadruple the occurrences in nearly a third of the time!
Investors can’t seem to make up their minds. Do they want the mega caps or everyone else?
Want more from Bespoke? You can start by joining our Think BIG mailing list, where you’ll receive an interesting market stat in your inbox a few times per week. All we need is your email address. Join now by clicking here or on the image below.